Research Articles

Activity of cold vortex in northeastern China and its connection with the characteristics of precipitation and circulation during 1960-2012

  • LIU Gang 1, 2 ,
  • FENG Guolin 3 ,
  • QIN Yulin 2 ,
  • CAO Ling 4 ,
  • YAO Hongwei 5 ,
  • LIU Ziqi 2
Expand
  • 1. Atmospheric Sciences Academy of Lanzhou University, Lanzhou 730000, China
  • 2. Meteorological Observatory of Jilin Province, Changchun 130062, China
  • 3. National Climate Centre, CMA, Beijing 100081, China
  • 4. Jilin Province Meteorological Service Center, Changchun 130062, China
  • 5. Meteorological Bureau of Nong'an County, Nong’an 130200, Jilin, China

Received date: 2015-03-17

  Accepted date: 2015-06-26

  Online published: 2015-12-31

Supported by

National Natural Science Foundation of China, No.41375078, No.41405094, No.41175083, No.41275096.Science and technology development plan in Jilin Province of China, No.20150204023SF

Copyright

Journal of Geographical Sciences, All Rights Reserved

Abstract

Based on the daily reanalysis data released by NCEP/NCAR and the daily precipitation of 753 Chinese stations from May to August during the period of 1960 to 2012, the statistical characteristics of the cold vortex in northeastern China were analyzed. In addition, the strength index, which described the characteristics of the vortex consistently and frequently, and the geographical distribution were given by continuous anomalies of circulation. Based on this index, the activity routines of the cold vortex, characteristics of atmospheric circulation, and their effects on precipitation in northeastern China were analyzed. The results show that: the activities of the cold vortex exhibit remarkable features of annual and interdecadal oscillation, and the vortex high frequency and its characteristics of atmospheric circulation are described more accurately by the strength index of the cold vortex, which shows a high correspondence with the vortex precipitation during early summer and midsummer in the northeast. In strong (weak) vortex years, the general circulation in the middle and high latitudes of Eurasia is to the advantage (disadvantage) of the formation, development and maintenance of the cold vortex, thus it is easy (difficult) to form the circulation which is beneficial to transmit vapor from south to north during the period of July to August. Blocking over the Ural Mountains prevails (does not prevail) in early summer, and blocking over the Sea of Okhotsk prevails (does not prevail) in midsummer. Areas where the subtropical high is too small (large) and moves toward the north too late (early) are better (worse) for the maintenance of the cold vortex in northeastern China.

Cite this article

LIU Gang , FENG Guolin , QIN Yulin , CAO Ling , YAO Hongwei , LIU Ziqi . Activity of cold vortex in northeastern China and its connection with the characteristics of precipitation and circulation during 1960-2012[J]. Journal of Geographical Sciences, 2015 , 25(12) : 1423 -1438 . DOI: 10.1007/s11442-015-1243-2

1 Introduction

The cold vortex in northeastern China which is a slow-moving and resident low pressure is a type of low-frequency weather process, and is one of the cutoff lows. The cold vortex may form in any season of the year, especially in summer, has a greater impact on the medium-range weather in the northeastern region (Wang et al., 2007). Research on the cold vortex in northeastern China mainly includes three stages: the first is the synoptic analysis stage, the second is diagnostic analysis and numerical modeling stage, and the final stage is the climatic effect study stage.
Since the 1980s, the activity of the cold vortex in northeastern China have had an obvious impact on the inter-annual variation of the summer climate of the northeastern region, which has attracted the attention of Chinese scholars. Tao (1980) has pointed out that the cold vortex is a circulation feature, which may cause thunder shower weather in northern and northeastern China. Since the 1990s, Chinese scholars have made significant progress in studying the weather process of the occurrence and development of the cold vortex, as well as its spatial-temporal distribution climatological laws and interim dynamic process, etc. (Zhou et al., 2011; Zhao et al., 2013; Ge et al., 2014). From the beginning of the 21st century, scholars have linked the cold vortex with the climate state anomaly prediction in summer in eastern China (Shun et al., 2000, 2002). This reveals the teleconnection fact of the continuous northeast cold vortex activity with the North Pacific Oscillation (NPO) and seasonal transition of atmospheric circulation in the Northern Hemisphere in summer.
Based on the study of the mutual relationship between the blocking high and cutoff low (cold vortex) on its south side or east and west side (Liu et al., 2014a), scholars have further studied the link between northeast cold vortex activity and Eurasian blocking high through a variety of low-frequency scale diagnoses, and have observed that the obvious anomaly of the cold vortex activity corresponds with the blocking circulation pattern in the upstream of the Ural Mountains, downstream anomalous circulation near Japan, and Western Pacific Ocean persistent circulation anomaly at its east side (Liu et al., 2014b). In addition, research by He et al., (2006) has shown that frequent northeast cold vortex activity has a significant “climatic effect”, which not only affects the mean monthly temperature in the lower troposphere of northeastern China, but also has an impact on the precipitation in the Meiyu period in the East Asia region. In recent years, Yang et al., (2012) have systematically studied the cold vortex process occurring in summer from 1981 to 2010, and objectively defined the cold vortex deviation index, which can represent the cold vortex strength based on the probability method of the Gauss distribution model. The studies described that the persistent impact of the cold vortex actually reflects the impact of the persistent anomaly of atmospheric circulation on the weather and climate in the eastern areas.
It is not difficult to see that the previous researches on the climatic effects of the cold vortex began from the high-frequency scale characteristics to analyze the persistent activity characteristics, then studied the impact of its low-frequency scale; or the study does not involve the cold vortex weather process, instead of directly analyzing the cold vortex climatic effects through the circulation evolution. Along with the synoptic scale process, the cold vortex’s persistent activity will undergo the “climatic effect”, but how the synoptic scale activity forces the high frequency to have an impact on the low frequency still requires further study. Regarding this as the cutting point and combining the features of geographical distribution in the frequent occurrence of the cold vortex, this study begins from the persistent anomaly of atmospheric circulation to reflect the frequent occurrence characteristics of the cold vortex by analyzing the persistent anomaly characteristics of circulation during the cold vortex activity. On one hand, this will provide a good representation meaning for the persistent activity of the cold vortex, and on the other hand it will also provide new ideas for the selection of northeast cold vortex factors in short-term climate prediction.

2 Data and method

We provided the daily 500 hPa geopotential height, temperature, relative humidity, wind field and other reanalysis data to distinguish the cold vortex process, and analyze the atmospheric circulation characteristics. The data were from NCEP/NCAR with a spatial resolution of 2.5°×2.5° from 1960 to 2012.
The precipitation data shown in this paper are the daily precipitation data from 753 stations in China, provided by the National Meteorological Information Center. The study period is from May to August. Method of using difference treatment to deal with the missing precipitation data which is very seldom, so the treatment will not affect the final results.
The process of distinguishing the cold vortex adopts the definition standard provided by Sun et al. (1994). The Western Pacific subtropical high (hereinafter referred to as the subtropical high) area index and ridge line index adopt the definition standard provided by Liu et al., (2012), and the first (second) northward jumping time of the subtropical high adopts the definition standard provided by Ye et al. (2014).

3 Definition of the “cold vortex” process

We extracted the cold vortex weather process from May to August of 1960-2012 by means of the cold vortex process distinguishing standard provided by Shun et al., (1994), while in accordance with the automatic identification method of the cold vortex provided by Liu et al., (2014b). There is a total of 811 northeast cold vortex processes, and about 15 occurrences (3.8/month) each year. The cold vortex activity lasts 3501 days, and the average numbers of days of such activity in each month are respectively 14, 19, 19 and 15. Particularly worth noting is the cold vortex activity, which will last an average of 67 days from May to August each year, accounting for 54% of the total number of days of the cold vortex. This signifies that the cold vortex is an important synoptic system in Northeast Asia.
The cold vortex process mainly reflects the high-frequency characteristics, while the cold vortex also has obvious persistent activity characteristics (Ge et al., 2014). Circulation anomaly may result in the anomaly of weather, while the anomaly of weather may also reflect the circulation anomaly. In addition, the magnitude of the circulation intensity is mainly expressed by the size of the control scope and its own characteristic quantity, and in the research of the cold vortex these two characteristic quantities are reflected as the low pressure area and central geopotential height, thus it is necessary to determine the main areas of the cold vortex activity at first. The cold vortex is a low-pressure system with a closed center in accordance with the definition. In accordance with this characteristic and the daily cold vortex state in the process of the cold vortex process, we selected the 9-point space on the grid, with the cold vortex low-pressure center as the dot 7.5°×7.5° (resolution: 2.5°×2.5°, the dot is the low-pressure center of the cold vortex, the height values of eight surrounding points are not lower than the low-pressure center value to represent the closed curve), in order to represent the cold vortex state of this day. The cold vortex state of each cold vortex day is then projected into the space grid, in accordance with the actual longitude and latitude positions, to obtain the geo-spatial frequency distribution of the cold vortex state. The fact shows that there are different atmospheric circulation backgrounds under the abnormal activity of the cold vortex in the periods of May-June and July-August (Liu et al., 2014a), this paper makes superposition in two periods (May-June and July-August), to obtain the repeated distribution characteristics as shown in Figure 1. It can be observed from the figure that northeastern China is located in the high-pressure central location in the frequent occurrence area of the cold vortex. The cold vortex activities in May-June are concentrated in the central part of northeastern China, while the cold vortex activities in July-August are concentrated in the northwestern part of the northeastern region. The distribution characteristics of concentration areas show that northeast of China in May-June enters the rainy season of the cold vortex, and is controlled by the cold vortex; on the other hand, northeastern China enters the summer monsoon rainy season in July-August, when the impact of the monsoon system becomes more obvious. Therefore, the concentration area of the cold vortex activity is northwesterly in July-August.
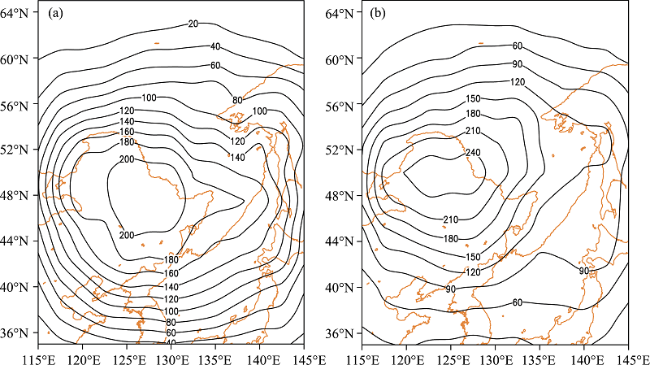
Figure 1 The distribution of area of northeast cold vortex activity from 1960 to 2012.a. May-June; b. July-August
The main characteristics of the cold vortex are reflected as the low geopotential height on the barometric surface. This paper analyzes the cold vortex activity characteristics through the circulation evolution in the concentration area of cold vortex activity. Due to the fact that the time scale of the cold vortex process is larger than or equivalent to three days, the new broad concept of the “cold vortex” process (hereinafter referring to the broad meaning of “cold vortex”) is provided by considering the atmospheric circulation evolution characteristics during the process of occurrence, development and disappearance of the cold vortex, i.e. one broad “cold vortex” process will be defined when the anomaly sum of the geopotential height in the 500 hPa height field within the cold vortex activity concentration area has negative definition for five days or more. In other words, the main characteristic of the broad “cold vortex” process in the above areas is the negative anomaly synthetic field for five consecutive days. In accordance with the definition, there are 144 broad “cold vortex” processes in May-June during 1960-2012 (1244 days in total), and the average duration of each process is 8.6 days. There are 135 processes in July-August (1411 days in total), and the average duration of each process is 10.5 days.
The broad “cold vortex” process is obtained in accordance with the negative anomaly synthetic duration in the height field of the cold vortex concentration area. In order to verify whether this broad “cold vortex” process can represent the frequent occurrence characteristics of the cold vortex weather process more effectively, the top 14 broad “cold vortex” processes according to the duration from the 144 processes were selected and then compared with the cold vortex weather process (Table 1 is May-June, and July-August is omitted). It can be observed from Table 1 that there are several northeast cold vortex weather processes during the broad “cold vortex” period, and the cold vortex weather process activity will be more apparent with the increased duration of the broad “cold vortex”. As shown in the table, the broad “cold vortex” process duration in the third slot is 22 days (June 9th to June 30th, 1974), and there is a total of five northeast cold vortex weather processes during this period (accumulatively up to 19 days). In Table 1, the accumulative number of days of the cold vortex weather process accounts for 62% of the total broad “cold vortex” duration days, and there is also a similar correspondence relationship in July-August. These observations indicate that the negative anomaly of persistent circulation reflected by the broad “cold vortex” process is favorable to the formation of persistent northeast cold vortex activity, and can reflect and represent the frequent occurrence characteristics of the cold vortex more effect- tively. The broad “cold vortex” uses a new perspective to describe the several cold vortex processes occurring under the same persistent abnormal circulation background.
Table 1 The contrast between the generalized “cold vortex” and northeast cold vortex during 1960-2012
Num The generalized “cold vortex” Northeast cold vortex
Year Day 1 Start time End time Day 2 Frequency
1 1969 40 May 10th June 18th 16 5
2 1972 24 June 7th June 30th 16 4
3 1974 22 June 9th June 30th 19 5
4 1964 19 June 10th June 28th 10 3
5 1983 19 May 31st June 18th 10 3
6 1986 19 May 7th May 25th 12 2
7 1961 18 May 7th May 24th 4 1
8 1976 18 May 20th June 6th 10 3
9 2009 18 June 9th June 26th 13 3
10 1999 16 May 1st May 16th 7 1
11 1992 15 June 3th June 17th 15 1
12 1995 15 May 19th June 2nd 8 2
13 1996 15 Jun 1st June 25th 15 2
14 2011 15 May 31st June 14th 13 2

Notes: Day 1 represents the lasting time of the generalized “cold vortex” process; Day 2 represents days (number) of northeast cold vortex occurred during the generalized “cold vortex” process (day)

4 “Cold vortex” with precipitation in northeastern China

The cold vortex in northeastern China activity can cause strong convection weather processes such as the thunder wind, thunderstorms, etc. The long-term duration or frequent occurrence of these weather processes may result in serious flood disasters in northeastern China (Meng et al., 2012; Zhao et al., 2013). In order to further analyze the relationship between the broad “cold vortex” process and the precipitation in May-August, Figure 2 shows the inter-annual variation of precipitation during the broad “cold vortex” process period in May-June of 1960-2012. It can be observed from the figure that the annual average ratio between the precipitation in the broad “cold vortex” process period and total precipitation is 45.6%; the annual average ratio between the number of days of the process and total number of days is 16.0%; and the annual average ratio between the number of precipitation days in the process and total number of precipitation days is 46.0%. In other words, the precipitation occurring during the broad “cold vortex” period only accounts for 16.0% of the total number of days, accounts for 45.6% of the total precipitation in May-June, and for 46% of the total number of precipitation days. The precipitation characteristics reflected by the broad “cold vortex” process in July-August are similar to those in May-June (figure omitted). The precipitation produced in the broad “cold vortex” process period accounts for 17.7% of the total number of days in July-August of 1960-2012, accounts for 42.9% of the total precipitation in July-August, and for 43% of the total number of precipitation days. Therefore, it can be seen that the broad “cold vortex” process can very effectively reflect the persistent activity characteristics of the cold vortex weather process, and can also more effectively represent the precipitation characteristics within May-June and July-August.
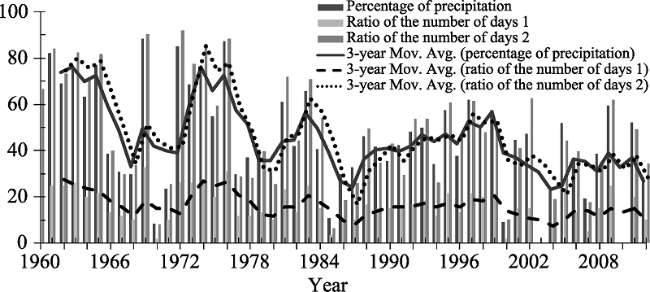
Figure 1 The contrast between the value and the rainy days of precipitation in the northeast during “cold vortex” in May-June from 1960 to 2012 Note: the percentage of precipitation represents the ratio of precipitation leading to the generalized “cold vortex” and total precipitation; ratio of the number of days 1 represents the ratio of rainy days in “cold vortex” days and the total rainy days; ratio of the number of days 2 represents the ratio of days in the process of the cold vortex and the total days; broken lines represent 3 years of moving average.
The above sections detail the correspondence relationship between the broad “cold vortex” activity and the precipitation in northeastern China through the time evolution characteristics of the annual average precipitation. This research begins from the spatial distribution characteristics of precipitation to further analyze the precipitation characteristics in northeastern China during the broad “cold vortex” period. Figure 3 shows the distribution of percentage of the number of days of the national average process precipitation, as well as the percentage of precipitation during the broad “cold vortex” activity periods of May-June and July-August. As shown in the figure, the number of precipitation days and the precipitation in the broad “cold vortex” process in the two periods have the highest percentages of distribution in northeastern China, and this situation is most prominent in the east-central part of northeastern China, with the highest percentage reaching up to 45% and more. In accordance with the annual average precipitation (number of precipitation days) distribution and regional single-station precipitation (number of precipitation days) distribution in the periods of May-June and July-August, it may be observed that the broad “cold vortex” process can also more effectively reflect the precipitation characteristics in northeastern China.
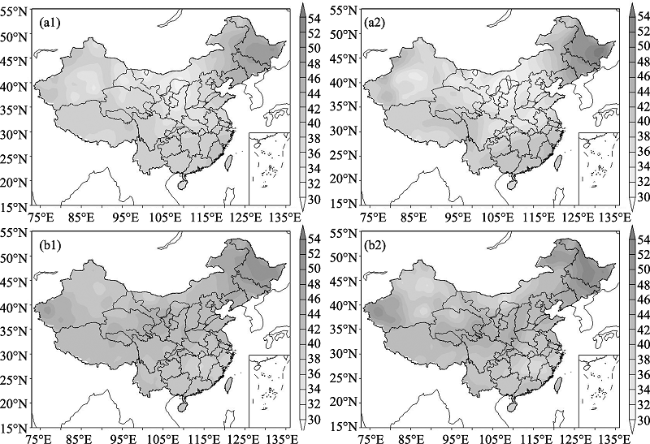
Figure 3 The distribution of percentage of precipitation days and precipitation during the generalized “cold vortex” from 1960 to 2012 a1 and a2 represent May-June; b1 and b2 represent July-August; a1 and b1 represent percentage of precipitation days; a2 and b2 represent percentage of precipitation

5 Broad “cold vortex” strength index

5.1 Definition

The broad “cold vortex” activity describes the cold vortex activity characteristics from the perspective of circulation, which can describe the precipitation characteristics in northeastern China in the periods of May-June and July-August more effectively. In order to quantitatively and qualitatively describe the characteristics of the broad “cold vortex” activity, the broad “cold vortex” strength index (abbreviated as NCVSI) was defined. The specific method is as follows:
The negative anomaly synthetic values in the 500 hPa height field of the cold vortex activity concentration area on each day during the broad “cold vortex” process in the period (May-June or July-August) are accumulated. The synchronous correspondence relationship between the cold vortex index and cold vortex strength is considered, but the anomaly synthetic values are negative values, thus the accumulative values in the formula take the absolute values of the negative anomaly synthetic values, to obtain the following:
where my represents the duration days of the broad “cold vortex” process, y=1, 2,…,Y (Y=66) represents the year, and Xi represents the absolute values of the average negative anomaly values in the height fields of all grid points within the broad “cold vortex” concentration area on the ith day. It can be shown by the formula that the broad “cold vortex” strength index φy is the accumulative value of the absolute negative anomaly synthetic value in the 500 hPa height field of the cold vortex activity concentration area within the broad “cold vortex” during the period (May-June or July-August). The broad “cold vortex” activity will be strong during the period (May-June or July-August) that the strength index value is positive, and be weak when the strength index value is negative.
The broad “cold vortex” strength index first represents the persistence characteristic of the broad “cold vortex” process. After performing a standardized treatment of the broad “cold vortex” process days in the periods of May-June and July-August from 1960 to 2012, we compared it with the broad “cold vortex” strength index. It can be observed from Figures 4 a1 and b1 that the NCVSI had consistent trend variation characteristics with the broad “cold vortex” days, and their correlation coefficients in May-June and July-August respectively reach 0.890 and 0.889, which exceed the 99.9% of reliability test, i.e. the broad “cold vortex” process can more effectively reflect the persistence characteristic of the broad “cold vortex” process. As far as the index strength evolution is concerned, the NCVSI is in the strong phase of oscillation stage from the 1960s to the late 1970s, and most of the years are in the positive phase, particularly in July-August, during which the oscillation amplitude is increased.
From the late 1980s to around 2000, the NCVSI has a small inter-annual oscillation amplitude and undergoes positive and negative phase fluctuation change regarding the 0 phase as the center. Comparing with the above period, the NCVSI from the beginning of the century to 2012 is weaker and almost shows consistent negative phase characteristics. In accordance with the NCVSI wavelet analysis characteristics, as shown in Figures 4a2 and b2, it can be seen that the NCVSI has obvious inter-annual and inter-decadal oscillation characteristics in May-June (Figure 4a2). The NCVSI in 1963-1978 has an oscillation cycle of 2-3 years, while the NCVSI from 1978 to the late 1990s has the oscillation cycle of about 5 years. The inter-decadal oscillation of the NCVSI has the characteristic of 30-35 years of periodic oscillation, and it has an oscillation cycle of about 15 years before 1980. The periodic characteristics of the NCVSI in July-August (Figure 4b2) have certain differences with those in May-June; the NCVSI has about 10-15 years of periodic oscillation, and its inter-annual change is similar to that in May-June. In addition, there are about six years of oscillation period from 1960 to 1978.
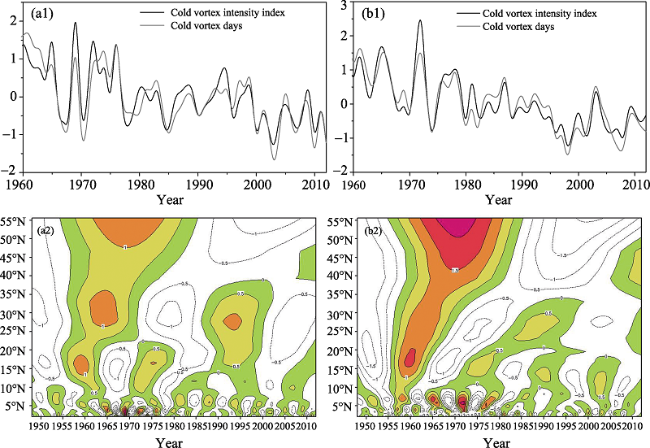
Figure 4 The contrast between NCVSI and days of the generalized “cold vortex” (standardization) (a1 and b1) and wavelet analysis of NCVSI (a2 and b2) from 1960 to 2012 a1 and a2 represent May-June; b1 and b2 represent July-August

5.2 Broad physical meaning of “cold vortex”

The “cold vortex” in northeastern China is an important component of the East Asian atmospheric circulation, and the closed low vortex circulation (Sun, 1997) can still be obtained by analyzing its persistent activities on the monthly average figure. The broad “cold vortex” process may more effectively represent the abnormal circulation characteristics of the cold vortex activity. In order to further analyze the broad representation meaning of “cold vortex”, the contemporaneous correlation of NCVSI and meteorological element field is calculated. Figure 5 shows that the NCVSI in May-June and July-August from 1960 to 2010 is correlated with the contemporaneous 500 hPa temperature field, height field, relative humidity and wind field. As shown in the figure, for the temperature field, the area from the north of northeastern China to the Yakutsk is a consistent negative correlation area; the central values of correlation coefficient in May-June and July-August reach -0.7 and -0.5, which exceed the 99.9% confidence level. The negative correlation area extends westward to the Balkhash Lake region in July-August; the higher the index is, the lower the regional temperature; and the lower the index is, the higher the temperature. As for the height field, northeastern China is a consistent negative correlation area; the central value of negative correlation area exceeds -0.8, which surpasses the 99.9% confidence level. The Northwest Pacific Ocean region is the non-significant positive correlation area, which means that northeastern China is prone to form the low pressure system and promotes the frequent occurrence of the cold vortex when the index is higher. On the contrary, the lower the index is, the higher the height value in the northeastern region, which will be not beneficial to the development and holding of the cold vortex. In addition, the Ural Mountain range in July-August is a significant positive anomaly area, which means that the strong NCVSI corresponds with the prevailing blocking situation in the Urals in midsummer, while the weak index corresponds with the non-significant blocking situation in this mountain region. As for the relative humidity, northeastern China is a consistent significant positive correlation area. This means that the higher the index is, the higher the relative humidity in this area, which will be conducive to the occurrence of precipitation, and vice versa. Meanwhile, it can be observed that the scope in the Ural Mountains and to their east is a zonal significant negative correlation area (Figure 5b), which means that the higher the index (weaker) is, the lower (higher) the relative humidity in the zonal area. The airflow has branches, possibly due to the blocking situation in this area when the index is higher, which then form the circulation pattern against the arrival or collection of water vapor. This further describes the reasons for the significant positive correlation area which appeared in the south of the zonal negative correlation area. As for the wind field, a significant cyclonic circulation is shown in the center of northeastern China. This means that a higher index stands more occurrences of the cyclonic circulation and vortex activity, while a lower index shows that it is prone to cause the anti-cyclonic circulation and go against the formation of the vortex. In addition, there are two southern airflows conveying from the south to the north in July-August and entering the cyclonic circulation in the northeastern region. One airflow originates from the Bay of Bengal, passing through the Yunnan-Guizhou Plateau and Qinling Mountains in the northeast, then conveying to the northeastern part of northeastern China. The other airflow is relatively weak, conveying from the South China Sea to the north, thus converging with the first airflow near the Qinling Mountains. The relationship between the broad “cold vortex” activity and Western Pacific subtropical high will be described in the following sections.
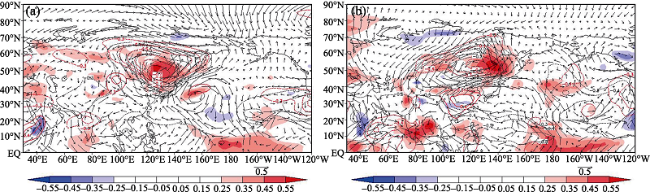
Figure 5 The correlation of NCVSI with meteorological elements field from 1960 to 2012 a. May-June; b. July-August (correlation coefficients are shown in the figure), color shadows represent relative humidity, red contours represent temperature, black contours represent geopotential height)
From the above descriptions, the higher (lower) NCVSI signifies easy occurrence of lower (higher) temperature and higher (lower) humidity (anti-cyclonic) cyclonic activity in northeastern China and its surrounding areas. This circulation background will be favorable (unfavorable) to the occurrence, development and holding of the cold vortex, and form a circulation pattern which will (will not) be prone to cause precipitation. If the NCVSI is higher in the midsummer, it is prone to generate south-north water vapor conveying from the Bay of Bengal and South China Sea. Therefore, the NCVSI activity intensity is likely linked with the Indian monsoon and South China Sea monsoon.

5.3 Characteristics of abnormal activity of the “cold vortex”

In order to further analyze the representation meaning of the broad “cold vortex” activity intensity and its reflected atmospheric circulation characteristics, we respectively select the active and inactive years of the NCVSI in May-June and July-August (see Table 2). This reveals the abnormal characteristics of the broad “cold vortex” activity through the synthesis of the meteorological element field. In order to highlight the synthetic effect, the first five years of various types for synthesizing was selected, and the selected meteorological elements include the 500 hPa geopotential height, temperature, relative humidity and wind distribution.
Table 2 The top ten of NCVSI active years, inactive years and normal years from 1960 to 2012
Num May and June July and August
Active years Inactive years Normal years Active years Inactive years Normal years
1 1969 2003 1973 1972 1998 1993
2 1976 2010 1992 1965 2008 1986
3 1965 2000 2011 1961 1974 1990
4 1972 2012 2005 1971 1980 1995
5 1960 1970 1998 1981 1996 1989
6 1974 1996 1964 1966 2002 1975
7 1995 1968 1986 1964 2001 2000
8 1961 1985 1993 1987 2006 1973
9 1963 2007 1987 1978 1999 2009
10 2009 1978 1997 1976 2005 1969
Figure 6 shows the synthesis of various meteorological elements in the broad “cold vortex” activity anomaly years. It can be observed from the figure that the Northeast Asia region in the synthesis of May-June (Figure 6a1) in active years is under the control of cyclonic circulation, and the temperature field and height field are negative anomaly areas showing characteristics of high humidity. The Ural Mountain region at the upstream of the negative anomaly area of the height field is a positive anomaly in the height field, i.e. the blocking situation of the Ural Mountains is prevailing. The negative anomaly area in the temperature field extends toward the northwest to the west of the Central Siberian Plateau. This situation is favorable to the high-latitude cold air flowing southward along the blocking high of the Ural Mountains, and provides steady cold air for the cold vortex circulation. Meanwhile, the anti-cyclonic circulation at its south has a certain blocking effect on the eastward movement of the cold vortex system, and is favorable to maintaining the cold vortex. In the synthesis in May-June of the inactive years (Figure 6b1), the Northeast Asia region shows the anti-cyclonic circulation situation, and the height field and temperature field are consistent positive anomalies showing the characteristics of low humidity. The temperature field and height field in the Baikal Lake and its western region in the upstream of this positive anomaly area show a dipole distribution mode, which is positive in the north and negative in the south. The cold vortex system is clearly westward, which is possibly due to the westward position and weak strength of the cold vortex, resulting from the strong Okhotsk blocking situation extending to the Northeast Asia region.
Figure 6 The distribution of synthesize of meteorological elements anomaly during different NCVSI years (5 years respectively) from 1960 to 2012 1 represents May-June; 2 represents June-August; a represents week years; b represents strong years; c represents normal years; shadows represent relative humidity, vector arrows represent wind speed, black contours represent geopotential height, red contours represent temperature)
Compared with the synthesis in May-June of the active years, the cyclonic circulation position in the synthesis in July-August of the active years (Figure 6a2) is westward. The height field and temperature field in the east of the Baikal Lake and north of northeastern China have consistent negative anomalies and show characteristics of high humidity. The Sea of Okhotsk in the downstream of the negative anomaly area of the height field is a positive anomaly area where the Okhotsk blocking situation prevails. In the wind field synthesis, a south-north wind speed belt occurs along the subtropical high edge in the South China Sea, and this belt extends towards the north to enter the cyclonic circulation system. The existence of this southwest jet stream is possibly one of the main reasons for the cyclonic circulation position being westward. Therefore, northeast China is simultaneously impacted by the cold vortex system and summer monsoon circulation in the midsummer. In the synthesis in July-August of the inactive years (Figure 6b2), the locations of cyclonic circulation and synthesis in July-August of the active years are clearly westward, and the cold vortex identification area is controlled by the significant anti-cyclonic circulation. However, the southwestern jet stream from south to north is not significant, and is replaced by the zonal cyclonic circulation characteristics at the low and middle latitudes of Asia, blocking the northward conveying of the south water vapor. The negative anomaly areas in the height field and temperature field no longer exist, in particular the Ural Mountain region has a low-pressure center of negative anomaly, and the height field anomaly in the Okhotsk region shows the characteristics of a “saddle type field”. On one hand, this type of circulation situation is unfavorable to the water vapor supply to the north along China's southeastern coastal areas; on the other hand, it is unfavorable to the maintenance and development of the cold vortex system.
From the above descriptions, it can be seen that the 500 hPa circulation situation in the Northeast Asia region is the cyclonic circulation in the active years of the “cold vortex” in May-June, showing low temperature characteristics and prevailing the blocking situation of the Ural Mountains. In May-June of the inactive years, the Northeast Asia region is controlled by the anti-cyclonic circulation, and shows the characteristics of high temperature and low humidity. In July-August of the “cold vortex” active years, the eastern part of the Baikal shows the characteristics of low-temperature and high-humidity cyclonic circulation, resulting in a strong blocking situation in the Okhotsk region, and the prevailing East Asian summer monsoon. In July-August of the inactive years, although the Northeast Asia region has characteristics of anti-cyclonic circulation, the central features of positive anomaly in the height field are significant and show the characteristics of high temperature and low humidity. The East Asian summer monsoon is weak, and the blocking situation does not prevail in the Ural Mountains or the Sea of Okhotsk.

5.4 Broad “cold vortex” and subtropical high

Many scholars have observed that the positive-negative-positive wave train formed in the active years of cold vortex, by regarding the cold vortex as the center, not only shows in the east-west direction, but also in the south-north direction. This signifies that the cold vortex activity is also closely linked with the Western Pacific subtropical high (abbreviated as subtropical high) (Zhou et al., 2011; Meng et al., 2012). Whether the characteristic index of subtropical high has a certain link with the abnormal activity of the broad “cold vortex” has been discussed. In accordance with the definition standards for the different characteristic indexes of the subtropical high, we selected the first northward jumping time, second northward jumping time, location of ridge axis, area, etc. as the characteristic indexes. Through calculation, the average time of the first and second northward jumpings of the subtropical high were respectively found to be 33 pentads (June 11th to June 15th) and 41 pentads (July 21st to July 25th). Therefore, in the comparative analysis the first (second) northward jumping will be compared with the broad “cold vortex” activity in May-June (July-August). Table 3 shows a comparison of the different characteristic indexes of subtropical high in May-June and July-August with the strongest 10 years, weakest 10 years and most typical 10 years of NCVSI.
Table 3 The contrast between NCVSI and subtropical high's characteristic features from 1960 to 2012
May and June Subtropical high’s characteristic July and August Subtropical high’s characteristic
Time of the first northward jump Ridge line Area Time of the second northward jump Ridge line Area
The most active
10 years
7 years later
2 years earlier
1 year normal
5 years northerly
5 years southerly
2 years larger
8 years less
The most active 10 years 8 years later
2 years
earlier
6 years northerly
4 years southerly
3 years larger
7 years less
The most inactive
10 years
2 years later
5 years earlier
3 year normal
4 years northerly
6 years southerly
5 years larger
5 years less
The most inactive 10 years 2 years later
4 years earlier
4 year normal
4 years northerly
6 years southerly
8 years larger
2 years less
The normal
10 years
1 years later
9 years earlier
3 years northerly
7 years southerly
6 years larger
4 years less
The normal 10 years 7 years later
2 years earlier
1 year normal
5 years northerly
5 years southerly
3 years larger
7 years less
It can be observed from the table that the northward jumping and area characteristics of subtropical high have a high correspondence relationship with the active years of the broad “cold vortex” activity, and the correspondence relationship between the location characteristics of subtropical high ridge line and the broad “cold vortex” activity intensity is not significant. Specifically, in May-June of the strongest 10 years, the subtropical high is mainly dominated by the late first northward jumping time (accounting for 7 years) and small area (8 years). In July-August of the strongest 10 years, the subtropical high is mainly dominated by the late second northward jumping time (8 years) and small area (7 years). There is no obvious correspondence relationship between May-June and July-August in the weakest and strongest years and the characteristics of the subtropical high. Therefore, in May-June and July-August of the active years of the broad “cold vortex” activity, the location of subtropical high is southward and has a small area, due to the effect of the low-pressure system in the low and middle latitudes, which means that this state characteristic is the result of the joint effect of the subtropical high and strong cold vortex activity. This further verifies the conclusion obtained by Lang Hong et al., (2009): the subtropical high is strengthened and northward-jumping forms at the beginning of the cold vortex, then it reverts to the south with the development and strengthening of the cold vortex, and will move northwards again when the cold vortex is reduced. In this case, the broad “cold vortex” activity intensity is weaker, and the subtropical high location and intensity may suffer more impact from the mutual effect of other circulation systems, which cause the subtropical high in the different characteristic states.

6 Conclusions and discussion

On the basis of the characteristics of the geographical distribution of the cold vortex activity in May-August of 1960-2012, we provide the definition standard of the broad “cold vortex”, more effectively formulate the strength index which can describe the broad “cold vortex” activity, analyze the relationship between the broad “cold vortex” activity and the precipitation in northeastern China, and then begin from the circulation to analyze the atmospheric circulation evolution characteristics under the abnormal activity of the cold vortex. The detailed conclusions are as follows:
(1) The average maintenance period of the broad “cold vortex” process is 11 days; it can describe the frequent occurrence characteristics of the cold vortex process, and more effectively reflect the circulation evolution characteristics under the background of the cold vortex activity.
(2) The broad “cold vortex” activity in May-June and July-August can more effectively represent the contemporaneous precipitation characteristics in northeastern China. The “cold vortex” days, accounting for 16% of the total number of days, will generate 45.6% of the average precipitation and 46% of the precipitation days. According to the precipitation distribution of all stations in China, the percentages of precipitation days and precipitation amount are the highest in northeastern China.
(3) The NCVSI can more effectively represent the evolution characteristics of the broad “cold vortex” activity. The broad “cold vortex” activity has obvious inter-annual and inter-decadal oscillation characteristics, which are mainly divided into three stages: the high-phase large oscillation stage in 1960-1976; positive and negative-phase small amplitude oscillation stage in 1977-1996; and small amplitude oscillation stage in 1997-2012, with negative phase as the principal.
(4) The middle and high latitudes show different circulation characteristics with the change of the broad “cold vortex” activity intensity. When the NCVI is stronger (weaker), northeastern China is prone to higher (lower) temperature and higher (lower) humidity (anti-cyclonic) cyclonic activity, which will be (unfavorable) favorable to the formation, development and maintenance of the cold vortex, and (not) prone to cause the circulation situation of precipitation. When the “cold vortex” activity is stronger, then it will be easier to form the south-north conveying channel for the water vapor originating from the Bay of Bengal and South China Sea.
(5) The abnormal activity of the broad “cold vortex” shows different atmospheric circulation characteristics. In May-June of the active years, the 500 hPa circulation situation shows low-temperature cyclonic circulation in the Northeast Asia region, and the blocking situation of the Ural Mountains prevails in this area. In May-June of the inactive years, the Northeast Asia region is controlled by the anti-cyclonic circulation, and shows the characteristics of high temperature and low humidity. In July-August of the active years, the eastern part of the Baikal shows the cyclonic circulation characteristics of low temperature and high humidity, with a higher blocking situation in Okhotsk and prevailed East Asian summer monsoon in this region. In July-August of the inactive years, the Northeast Asia region is controlled by the anti-cyclonic circulation, which has significant central characteristics of high values in the height field, and shows the characteristics of high temperature and low humidity. In addition, this region has a weak East Asian summer monsoon, with the blocking situations in the Ural Mountains and the Sea of Okhotsk do not prevail in this area.
(6) The subtropical high has an obvious modulation effect on the activity of the broad “cold vortex” activity in the active years. The later northward jumping time and smaller area of the subtropical high will be more beneficial to the occurrence of the broad “cold vortex” activity, and the modulation effect of the subtropical high on the broad “cold vortex” in the non-active years will be more complex in terms of impact and mechanism, which requires further study in the future.

The authors have declared that no competing interests exist.

1
Chen George Tai-Jen, Chou Lan-Fan, 1994. An investigation of cold vortices in the upper troposphere over the Western North Pacific during the warm season.Monthly Weather Review, 122: 1436-1448.Abstract Sixty cold lows in the warm months (June鈥揙ctober) of 1982鈥87 (1984 missing) over the western North Pacific were studied by using rawinsonde data, airplane reports, and satellite cloud-tracked winds. The general characteristics of cold lows were analyzed. Various cloud types were derived from the cloud observations of the Geostationary Meteorological Satellite of Japan. Cloud distribution was investigated over different sectors of the vortex, over different regions of the jet streak, and at different life stages of the vortex. Structure of the vorticity and divergence fields was also studied for selected cases of cold lows. Cold lows generally moved westward with a mean speed of 4.1 m s 鈭1 and a mean lifetime of 6.3 days. The frequency of occurrence exhibited significant interannual and monthly variations and reached a maximum in August and a minimum in October. One of the interesting findings of this study is the existence of a type NW (northwest) and/or a type S (south) jet streak for the majority of cold lows (87%). The type NW jet mainly formed in the northwest sector and then propagated downstream and dissipated in the southwest sector, while the type S jet usually formed in the southwest and southeast and then propagated downstream and dissipated in the northeast or northwest sector. Larger horizontal length scales and longer lifetimes were found for the cold lows accompanied by a jet as compared to those without a jet. A thermally direct circulation over the entrance region and a thermally indirect circulation over the exit region associated with both the type NW and the type S jets were derived from the thermal structure, the divergence pattern, and the cloud distribution over the vortex region. The cloud distribution over the vortex region was observed to be mainly modulated by the jet streaks. The evolution of a cold low was primarily related to the accompanied type S jet streak.

DOI

2
Gao S T, Zhu W S, Dong M, 1998. On the wave-flow interaction in the low frequency atmospheric variation: Blocking pattern.Acta Meteorologica Sinica, 56(6): 665-680. (in Chinese)In this paper the history of studying the low frequency variation is reviewed. An analysis and some of synoptic/climatological points of view is put forward on the formation and maitainance of the blocking flow pattern through the diagnoses of obser vation facts com bined with some experiences in forecast practice. It is emphases that the eastward steepening of low troug hs in the upstream of the blocking high, the SST variation and the topography effect are the major factors influencing the variation of the blocking high. The wave-flowint eraction during the maint enance of Woollier Mountain blocking high is studied through the layout of the barocl inic trough (transient wave) and the blocking flow. This will give a primary basis for the further theoretical study on the formation mechanism of the blocking high.

DOI

3
Ge Q S, Zheng J Y, Hao Z Xet al., 2014. State-of-the-arts in the study of climate changes over China for the past 2000 years.Acta Geographica Sinica, 69(9): 1248-1258. (in Chinese)We reviewed the state-of-the-arts of climate change research in China over the past 2000 years and summarized the achievements during recent 10 years; the research works perspectives of this field were discussed as well. The overview mainly focuses on the development of proxy data, reconstructions of temperature and precipitation (wetness/dryness) changes for the past 2000 years, and recognition on the cold/warm periods, modeling simulation and diagnosis of climate changes for the last millennium, as well as the new findings on impacts of climate change on society in historical times. It is found that spatial coverage of proxy data increased largely and that quantifications of climate proxy indicator interpretation and impacts of climate change on society were improved. The understanding of the decadal to centennial climate change and its possible driving forces and impacts were improved. These achievements provide a solid scientific basis for revealing the rhythms of past changes in earth system, in particular for a better understanding of the spatial and temporal characteristics of climate change in China and dynamics of regional climate change.

DOI

4
He J H, Wu Z W, Jiang Z Het al., 2006. The climatic effects of northeast cold vortex and its impacts on Meiyu.Chinese Science Bulletin, 51(23): 2803-2809. (in Chinese)

5
Lian Y, Shen B Z, Gao Z Tet al., 2004. An exploration on the determination of East Asia summer monsoon index.Acta Meteorologica Sinica, 62(6): 782-789. (in Chinese)In this paper,NCEP/NCAR 1948-2002 daily reanalysis data and monthly rain data in 151 stations archived in NCC were used to calculate the date of est ablishment and with drawal of East Asia summer monsoon at every 5 latitude (north of 20&#176;N) along 112.5,117.5 and 122.5&#176;E as well.The met hod is similar to the criterion of establishment and withdrawal of East Asia summer monsoon in Northeast China defined by us.Amean date [pentad] map of est ablishment and withdraw al of East Asian summer monsoon is drawn,an index of East Asia summer monsoon at a certain latitude along a certain longitude,<i>I</i><sub>SM</sub>is defined,and its relationship with summer precipitation and 500 hP a height in China was calculated.the results indicate that:(1) The mean pen-tads of establishment of East Asia summer monsoon at 20,25,30,35 and 40&#176;N along 117.5&#176;E are 27.26,28.54,34.43,37.12 and 37.65 respectively,and the mean pentads of its with drawal are 54.44,53.69,51.85,48 and 46.76 respectively.The determined pentad of establishment of East Asia summer monsoon in north of South China Sea(117.5&#176;E,20&#176;N),is coincident with the 4th pentad in Mayrecog nized by China scholar.(2) The mean date of East Asia summer monsoon establishment at the same latitude is not the same along 112.5,117.5 and 122.5&#176;E,early in east part and preceding 1-2 pentad every 5 longitude.But the mean date distribution of its withdrawal (30&#176;N and north of it) is opposite,first withdrawal in eastpart.

DOI

6
Liang H, Wang Y, Guo Z Q, 2009. The teleconnection relationship between the northeast cold vortex and the subtropical high, the Okhotsk high in summer.Scientia Meteorologica Sinica, 29(6): 793-796. (in Chinese)

7
Liu G, Lian Y, Yan P Cet al., 2015. The objective recognition and classification of northeast cold vortex and analyses of the Northern Hemisphere atmospheric circulation characters in May to August.Scientia Geographica Sinica, 35(8): 1042-1050. (in Chinese)Based on the NCEP/NCAR daily reanalysis data of 500 hPa geopotential height, objective identification method by computer is used to search the Northeast China cold vortex(NECV) activities ongoing process in summer(May to August) from 1948 to 2012 in this study. Results show that the NECV process occured 956 times in total, the average annual occurred about 14.7 times in May-August. And the NECV events of 4 129 days, wherein 14、18、18 and 14 days are occured in May to August, respectively, a total of 64 days 52% of the total number of days. The NECV process main sustained 3-6 days, maintaining position between the 121&#176;E-131&#176;E and 48&#176;N-53&#176;N. Simultaneously, the NECV occurrence frequency and active days significant increases. In July-August, the strong NECV year,Lake Baikal to the Sea of Okhotsk blocking high regularly simultaneoued with the NECV. On the contrary, in the weak NECV year, Lake Baikal to the Sea of Okhotsk blocking high was not prevailed,and in most year the NECV happenned after the blocking high.The Differences in geopotential height anomaly distribution between the strong NECV year and the weak NECV year appear anti-phase distributed, moreover this feature in the middle(500 hPa) and senior(200 hPa) convection showed a nearly hemispherical scale wave train distribution. However their composite differences in geopotential height were similarity, showed a significant meridional "+,-" wave train(exceed 99% confidence level), this wave train was located in the Pacific Northwest region and the Sea of Okhotsk to the Bering Sea region, corresponding to the senior convection cyclonic and anticyclonic circulation.

8
Liu X F, Zhu X F, Pan Y Zet al., 2014. The spatial-temporal changes of cold surge in Inner Mongolia during recent 53 years.Acta Geographica Sinica, 69(7): 1013-1024. (in Chinese)Using the daily minimum temperature data of 121 meteorological stations in Inner Mongolia and its surrounding areas, this paper analyzed the spatiotemporal variation of cold surge and its possible influencing factors in Inner Mongolia during 1960-2012, based on piecewise regression model, Sen+Mann-Kendall model, and correlation analysis. The results show that, (1) The occurrence frequency of single-station cold surge presented a decreasing trend in Inner Mongolia during recent 53 years, with a linear tendency of-0.5 times/10a (-2.4-1.2 times/10a), of which a significant decreasing trend was detected before 1991, being-1.1 times/10a (-3.3-2.5 times/10a), while an increasing trend of 0.45 times/10a (-4.4-4.2 times/ 10a) was found after 1991. On the seasonal scale, the trend of spring cold surge was consistent with that of the annual value, and the most obvious change of cold surge also occurred in spring. The frequency of monthly cold surge showed a bimodal structure, and November witnessed the highest incidence of cold surge. (2) Spatially, the high incidence of cold surge is mainly observed in the northern and central parts of Inner Mongolia, and higher in the northern than the central part. The inter-decadal characteristic also detected that high frequency and low frequency regions presented a decreasing trend and an increasing trend, respectively, during 1960-1990, while high frequency regions expanded after the 1990s, regions with high frequency of cold surge were mainly distributed in Tol Gol, Xiao' ergou, and Xi Ujimqin Banner. (3) On annual scale, the cold surge was dominated by AO, NAO, CA, APVII, and CQ, while the difference in driving forces among seasons was detected. Winter cold surge was significantly correlated with AO, NAO, SHI, CA, TPI, APVII, CW, and IZ, indicating that cold surge in winter was caused multifactor. Autumn cold surge was mainly affected by CA and IM, while spring cold surge was significantly correlated with CA and APVII.

DOI

9
Liu Y Y, Li W J, Ai M Xet al., 2012. Reconstruction and application of the monthly western pacific subtropical high indices.Journal of Applied Meteorological Science, 23(4): 414-423. (in Chinese)In order to solve the problems of the monthly Western Pacific Subtropical High(WPSH) indices used in National Climate Center(NCC) monitoring service,a series of the monthly WPSH indices,including the area index,intensity index,ridge line index and western boundary index,are redefined and reconstructed, on the basis of the monthly NCEP/NCAR reanalysis datasets from 1951 to 2010. The reconstructed area index is defined by the "real area" of the WPSH surrounded by the 588 dagpm contour over western Pacific,while the intensity index is the "volume" of the WPSH over 588 dagpm.The reconstructed western boundary index is defined as the minimal longitude degree of the 588 dagpm contour in the region between 90掳E and 180掳.When 588 dagpm contour disappears in some month,it is substituted by the maximum of this index in this month during 1951 to 2010.The definition of the reconstructed ridge line index has more adjustment.It is defined by the latitude position of the isoline where 500 hPa zonal wind u=0 and(?)u/(?)y0 surrounded by 588 dagpm contour.When there is no 588 dagpm contour,the 584 dagpm contour is just considered in the definition.If even no 584 dagpm contour exists in some month,it is substituted by the minimum of this index in this month during 1951 to 2010.Both the 500 hPa geopotential height and 500 hPa zonal wind shear line are considered in the reconstructed ridge line index,and no more restricted by 588 dagpm contour,which takes full consideration of the impact of the WPSH system on the summer precipitation in East China. The reconstructed WPSH indices have enabled describing objectively characteristics of the WPSH's monthly change,and overcoming the defect of the excessive dependence of the WPSH indices using in NCC service on the data resolution.The significant correlation of the reconstructed ridge line index and the summer precipitation over the Yangtze River also confirms its rationality and objectivity.Finally,two kinds of relatively independent WPSH indices,the ridge line index and western ridge point index,are selected to combine nine classifications of WPSH,which correspond with all kinds of distributions of summer precipitation anomaly in East China at large.It provides a scientific basis to further understand the relation of the position anomaly of the WPSH and the summer main rainfall belt in East China.

DOI

10
Meng X J, Zhang S F, Zhang Y Y, 2012. The temporal and spatial change of temperature and precipitation in Hexi Corridor in recent 57 years.Acta Geographica Sinica, 67(11): 1482-1492. (in Chinese)In this study, monthly temperature and precipitation time series from 1955 to 2011 of 12 meteorological stations were collected and means of linear regression, moving average, Mann-Kendall test, accumulated variance analysis and Pettitt were used to diagnose the behavior of temperature and precipitation so as to reveal the regional climate change facts and its trends. The results showed that the average annual temperature in the Hexi Corridor increased significantly in recent 57 years, and its increasing rate was 0.27℃/10a which was twice the level of the IPCC Fourth Assessment Report announced, and its abrupt changes were mainly detected in 1986. The seasonal average temperature in this region had an evident uptrend and the trend was most significant in winter. The annual average precipitation change trend rate was 3.95 mm/10a which had a significant rising trend at statistical significance level, but it was insignificant in its three basins. The rainy season precipitation which had the same fluctuation change as the annual precipitation presented no significant uptrend. There were no consistent abrupt changes observed of the precipitation in this study area, but the rainy season precipitation abrupt changes were mainly observed in 1968. With the increase of temperature and precipitation, warming and wetting is evident in this study area.

11
Sun L, 1997. A study of the persistence activity of northeast cold vortex in China.Scientia Atmospherica Sinica, 21(3): 297-307. (in Chinese)In this paper, by using the daily wind data from June 1 to August 30, 1986 at the level of 500 hPa, features of 10~20 day oscillation over East Asia and its relations with Northeast cold vortex in China have been studied first. The results show that this oscillation is very active over Northeast China. From the time-continuous 10~20 day low-frequency (LF) Weather maps, it is found that there exists a good relationship between the LF cyclones and the activity of northeast cold vortex. The propagation of this oscillation is rather regular. Based on the E-Vector analysis and time-mean quasigeostrophic potential vorticity (PV) budget methed, we also studied the influence of the transient eddy on the formation of the time-average northeast cold vortex. It is shown that a large portion of the eddy enerrgy is transformed to the time-averaged flow in the vicinity of a dipole of the time-average cold vortex and East Asian bloking. There exists also an obviously E-vector divergence here in the meantime. The PV transfer by transient eddy is advantageous to maintenance of the dipole system.

12
Sun L, An G, Gao Z Tet al., 2002. A composite dianostic study of heavy rain caused by the northeast cold vortex over Songhuajiang-Nenjing river basin in summer of 1998.Journal of Applied Meteorological Science, 13(2): 156-162. (in Chinese)

13
Sun L, An G, Lian Yet al., 2000. A study of the persistent activity of northeast cold vortex in summer and its general circulation anomoly characteristics.Acta Meteorologica Sinica, 58(6): 704-714. (in Chinese)In this paper,by using the NCEP/NCAR reanalysis monthly mean data from 1958 to 1997 and summer precipit ation and temperature from 69 observation stations of northeast area in China,the persist entactivity of northeast cold vortex and its general circulation anomaly charact eristics have been studied.The results show that the persistent activity of northeast cold vortex is notonly a very important factor to the summer temperature and rainfal of northeast area in China,but also have impact to the precipit ation in some other areas in China,especialy in middle and lower reaches of Yangze River.

DOI

14
Sun L, Zheng X Y, Wang Q, 1994. The climatological characteristics of northeast cold vortex in China.Quarterly Journal of Applied Meteorological Science, 5(3): 297-303. (in Chinese)A climatological andlysis of spatial and temporal distfribution of the nortHeast coldvortex in China during the period 1956-1990 and their relationship with the generalcirculation over East Asia is presented based on Beijing Meteorological Center鈥檚historical weather map. The results show: The frequency of northeast cold vortex hassignificant continuity , interannual variability, inter-monthly change and the low-frequency variation. And they trend to appear in the regions of low-lying landgenerally, such as Northeast Plain and Three-River Plain,especially the developingnortheast cold vortex also relates to the contrast of ocean-land distribution. Thevariations of the frequency and location of the northeast cold vortex are characterized byateleconnection structure at 500 hPa in East Asia. The effective factors are mainlyconcerned with the location and intensity of the blocking over East Asia and subtropicalhigh.

15
Tao S Y, 1998. Rainstorm of China. Beijing: Science Press. (in Chinese)

16
Wang D H, Zhong S X, Liu Yinget al., 2007. Advances in the study of rainstorm in Northeast China.Advances in Earth Science, 22(6): 549-560. (in Chinese)<p>A Systemic study of the rainstorm in Northeast China will improve the understanding of severe weather in Northeast China, and will also enhance the entire research on the rainstorm in China. A summary of recent achievements of the rainstorm research is briefly depicted. A basic review of several major weather systems which cause the rainstorm in Northeast China such as cyclone, typhoon, cold vortex is made. In particular, the cold vortex and the associated rainstorm are mainly reviewed. Some problems remaining to be resolved are pointed out as follows: the intensity, distribution and movement of the typhoon which causes the rainstorm in Northeast China; the inside structure, the physical mechanisms of occurrence and development of the Northeast China cold vortex in China; and the structure features of mesoscale convective systems associated to the Northeast China cold vortex and their relationship with rainstorm and the vapor sources causing heavy rainstorm. To solve the above-mentioned&nbsp; problems, it is necessary to conduct more and more observational analysis and modeling studies by using long-term high-resolution observational data and long-term remote sensing data (e.g., satellite and radar data) in the future. </p>

17
Xie Z W, Cholaw Bueh, 2015. Different types of cold vortex circulations over Northeast China and their weather impacts. Monthly Weather Review, 143: 845-863.Abstract A deep and cold vortex circulation often occurs over the Northeast China. Known as Northeast China cold vortex (NCCV), the phenomenon is most active from May to mid-June and can lead to extremely cold local temperatures. This study used rotated principle component analysis to categorize NCCV events into four types, which were characterized by ridges (or blocks) over Lake Baikal (BKL), the Yenisei River valley (YNS), the Ural Mountains (UR) and the Yakutsk/Okhotsk region (YO), respectively. On the intra-seasonal time scale, it was found that BKL- and YNS-type NCCVs formed when the wave-train height anomalies originating from North Atlantic and Europe propagated to East Asia. In contrast, YO- and UR-type NCCVs formed in conjunction with the development of a meridional dipole pattern over Northeast Asia. The existence of a blocking-type circulation over the Yakutsk/Okhotsk region favored maintenance of the NCCV circulation for the long-lived (more than five days) NCCV events of the four types. The typical circulation over Northeast Asia for the long-lived NCCV event was closely associated with wave breaking, whereas the short-lived (three to five days) event shows only wave propagation. The YNS-type NCCV caused cold surface air temperatures (SAT) not only over Northeast China but also over Central and South China, whereas the other three types led only to regional cold SAT anomalies over Northeast China. All four types of NCCVs caused a precipitation increase over Northeast China, and this effect was broader for the UR- and YO-type NCCVs than that for BKL- and YNS-type NCCVs.

DOI

18
Yang H W, Feng G L, Shen B Zet al., 2012. The quantitative research on cold vortex in summer over Northeast China.Chinese Journal of Atmospheric Sciences, 36(3): 487-494. (in Chinese)Using daily reanalysis data, released by NCEP/NCAR, about geopotential height from 1981 to 2010 (30 years in total) to retrieve and analyze the cold vortex over Northeast China (CVONC), to extract and analyze the average state of CVONC, the authors define a deviation index on CVONC and discuss its rationality to depict the intensity of CVONC. It shows that: (1) the probability distribution of CVONC's geopotential height of occlusive center at 500 hPa is similar to the Gaussian normal distribution, and the average state of CVONC extracted by the expected value of Gaussian normal distribution hold general characters of CVONC; (2) the definition of deviation index on CVONC based on its average state could represent not only the deflected degree from the average state of CVONC, but also some information about the areas of low pressure, which means that it could indicate the intensity characteristics of CVONC directly.

DOI

19
Ye T S, Rong Z, Zhao J Het al., 2014. The two annual northward jumps of the West Pacific subtropical high and their relationship with summer rainfall in eastern China under global warming.Chinese Physics Bulletin, 23(6): 69-203. (in Chinese)

DOI

20
Zhao A F, Zhang M J, Sun M Pet al., 2013. Changes in 0ºC isotherm height of Southwest China during 1960-2010.Acta Geographica Sinica, 68(7): 994-1006. (in Chinese)Based on the aerological meteorological data at 14 sounding stations in Southwest China from 1960 to 2010, as well as the corresponding 5 temperature and 2 precipitation factors measured at ground, Mann-Kendall test, linear trend estimate, correlation analysis and R/S analysis were applied. The changes in spatial and temporal distribution of 0 ℃ isotherm height and their relationships to temperature, precipitation and altitude were analyzed, and the future trends and constancy were predicted. The results indicated that the 0 ℃ isotherm height increased after a sudden decrease in the 1970s, and the patterns of different seasons varied. An increasing trend can be found in the annual, autumn and winter series, and only the trend in winter is statistically significant. A latitude gradient is generally shown from south to north with a decreasing pattern, and the distribution in summer is relatively even. The diversity of annual and seasonal series can also be detected at a spatial view. Significant spatial diversity for temperature and precipitation can be found, and the 0 ℃ isotherm height correlated well with temperature, instead of precipitation. The correlation between isotherm height in summer and altitude is more significant than in other seasonal and annual series. The changing trends in annual and seasonal series can be maintained in future, and evidenced constancies can be found at most of the stations.

21
Zhou S W, Wu P, Wang C Het al., 2011. Spatial distribution of atmospheric water vapor and its relationship with precipitation in summer over the Tibetan Plateau.Acta Geographica Sinica, 66(11): 1466-1478. (in Chinese)By using the observed temperature and humidity dataset of the 14 radiosonde stations and monthly mean precipitation data of 83 ground stations from 1979 to 2008 over the Tibetan Plateau (TP), the relationship between the atmospheric water vapor (WV) and precipitation in summer as well as the precipitation conversion efficiency (PEC) over the TP is analyzed. The statistic results are obtained as follows. (1) The summer WV decreases with increasing altitude, with the largest value area observed in the northeastern part of the TP and the second largest value area in the southeastern part of the TP, while the northwestern part is the lowest value area. The summer precipitation decreases from southeast to northwest. (2) The summer WV presents two main patterns based on the EOF analysis: the whole region consistent-type and the north-south opposite-type. The north-south opposite-type of the summer WV is similar to the first EOF mode of the summer precipitation and both of their zero lines are located to the north of Tanggula Mountains. (3) The summer precipitation is more (less) in the southern (northern) TP in the years with the distribution of north lack of the summer WV while south abundant, and vice versa. (4) The PEC over the TP is between 3% and 38% and it has significant spatial difference in summer, which is obviously bigger in the southern TP than that in the northern TP.

Outlines

/