Orginal Article

Relational pattern of urbanization and economic development: Parameter re-evaluation of the Chenery model

  • CHEN Mingxing , 1 ,
  • TANG Zhipeng 1 ,
  • BAI Yongping 2 ,
  • ZHANG Xiaoping , 3, *
Expand
  • 1. Key Laboratory of Regional Sustainable Development Modeling, Institute of Geographic Sciences and Natural Resources Research, CAS, Beijing 100101, China
  • 2. College of Geography and Environment Science, Northwest Normal University, Lanzhou 730000, China
  • 3. College of Resources and Environment, University of Chinese Academy of Sciences, Beijing 100049, China

*Corresponding author: Zhang Xiaoping (1972-), PhD and Associate Professor, E-mail:

Author: Chen Mingxing (1982-), PhD and Associate Professor, specialized in urbanization and regional development. E-mail:

Received date: 2014-07-01

  Accepted date: 2014-11-02

  Online published: 2015-07-17

Supported by

National Natural Science Foundation of China, No.41001080;No.41271184;No.40971075;No.40771054

Copyright

Journal of Geographical Sciences, All Rights Reserved

Abstract

Research has shown that there has been a significant change in the quantitative relationship between urbanization and economic development over the past 50 years. As a result of this change, the Chenery model is no longer capable of performing a comparative analysis of these parameters. We carried out a regression analysis of the normal form of the relation between urbanization and economic development on the basis of the Chenery model. We used empirical data from 149 countries and regions from 1990 to 2009 and adopted the double logarithmic model, introducing a time series variable for urbanization. From 1990 to 2009, with a per capita gross national income remaining between USD 1000 and 10,000, the urbanization rate changed from 17.78 to 60.36% and the relational matching data changed accordingly, although the upper limit of the rate of urbanization remained at about 75%. Urbanization in countries with a smaller population size was more affected by economic development than urbanization in countries with large and medium sized populations.

Cite this article

CHEN Mingxing , TANG Zhipeng , BAI Yongping , ZHANG Xiaoping . Relational pattern of urbanization and economic development: Parameter re-evaluation of the Chenery model[J]. Journal of Geographical Sciences, 2015 , 25(8) : 991 -1002 . DOI: 10.1007/s11442-015-1215-6

1 Introduction

Since the implementation of economic reforms and a policy of opening up to the outside world, China’s economy and the level of urbanization have made great progress. In 2010, China’s GDP and per capita GDP were 40120.2 billion yuan and 29.99 thousand yuan, respectively, increasing from 364.5 billion yuan and 381 yuan in 1978, representing an annual increase of 11% in China’s GDP and a 79 times growth in per capita GDP as well. Over the same time period, the rate of urbanization has increased dramatically from 17.92% in 1978 to 49.95% in 2010 and the urban population has increased from 0.17 billion to 0.67 billion. Both urbanization and economic growth are highly developed, but the relationship between urbanization and economic growth is unclear. It has been proposed that urbanization lags behind the level of economic development because of the restrictions on urbanization in the special historical stage,and that the fast rate of economic growth since China’s ‘open door’ policy began has increased this difference further. The rate of urbanization in 1949 was 20% and the slow increase in urbanization means that the urbanization rate has only increased by 26% over the past 60 years (Li, 2011).
Urbanization in China has the potential to nurture new opportunities and is set to become the main theme in China’s long-term future growth and economic restructuring. Urbanization in a country with a population of 1.3 billion will determine not only the future of the Chinese economy, but will also have a profound impact on the global economy (Ba et al., 2010). However, there are a number of different views on the relationship between urbanization and economic development. After a period of reform and opening up of the economy, China is currently in a period of rapid economic growth and it is therefore necessary to improve the rate of urbanization in a controlled manner. However, after 30 years of continuously accelerating growth in urbanization, the current rate of urbanization is still high and some local governments appear to be engaging in a race to increase the rate of urbanization further (Zhou, 2006), which has resulted in aggressive trends in urbanization (Lu et al., 2007). Compared with other developed countries, China’s rate of urbanization is low, but the relationship between urbanization and economic development is accordingly coordinated despite its low level. Therefore it is wise for central and local governments to set reasonable targets for urbanization and to reconsider its effects, taking into account the quality of urbanization and taking the road of healthy urbanization (Chen et al., 2009a, 2009b, 2010, 2013, 2014; Fang and Wang, 2011; Yao et al., 2011).
These two divergent views raise an important question: Is there an objective scientific basis on which to judge the relationship between urbanization and economic development of a country? Most scholars referred Chenery’s model as the norm. The Chenery model is a widely cited classical study of the relationship between urbanization and economic development. It is well recognized that urbanization and economic development are related to one another (Liang, 1999; Henderson, 2003) and the double logarithmic model between them has been studied previously for China (Zhou, 1982). Transnational economic empirical analyses using panel data, the impact of urbanization in world models and a quantitative analysis of the economic factors causing the lag in urbanization in China have found that the effects of secondary and tertiary industries and higher education at the level of urbanization in China is only 50% of the world average, causing urbanization in China to lag behind economic growth (Li, 2005). Compared with the logarithmic functions, exponential functions, and model-based logistic function, scholars have made theoretical analysis on the single, double logarithmic and sub-logarithmic relationship portrayed by different functions, and the variation of model parameters can determine the evolution direction (Chen, 2011). There are large differences in the economic performance of urbanization between developed and developing countries and Yuki (2007) found that developed countries are dependent on the development of the formal sector, whereas developing countries are dependent on the development of the informal sector. Since the 1990s, the patterns of development and levels of urbanization and economic growth have changed and some new factors, such as technology flow in the knowledge economy (Xu et al., 2002) and spatial spillover of the knowledge economy (Wang et al., 2003), have begun to play important roles. Information technology has had a great influence on the exchange of economic and cultural ideas and in consumption on a global scale, resulting in a large impact on regional economic and social spatial structures and patterns of urbanization (Liu and Zhen, 2004). The significant association between the producer services industry (Shen et al., 2007) and tourism has become a new type of urbanization (Lu and Ge, 2006).
Many studies have deepened our understanding of urbanization and economic development. However, in terms of the quantitative relations between urbanization and economic development, it is easy to misinterpret the available information when the general parameters of the Chenery model are applied as a rule of direct control. The Chenery model itself has not been substantially improved and developed over time. However, as a result of the current rapid changes in economic development and urbanization, the quantitative relationship will inevitably be in flux. Some researchers have recognized that the direct application of the Chenery model is no longer suitable. Taking Japan and the USA as examples, the relationship between urbanization and the level of economic development in most of the studied regions does not fit the Chenery model at the regional scale. The Chenery model has had a huge impact on urban policy in China. It is easy to recognize predictions of an unrealistic level of urbanization and urban size in urban planning in China (Wang and Peng, 2004, 2005).
A dollar conversion method has been designed to re-estimate the relationship between urbanization and economic development in China (Zhang and Zhao, 2003). Based on international data using the GDP per capita in 1999 prices, the relevant quantitative form of the Chenery model has been re-estimated and revised (Zhao and Zhang, 2009). On the basis of existing research, we have interpreted the content of the Chenery model and re-evaluated the standard Chenery model of the multinational economic structure associated with the rate of urbanization with updated international data. The original Chenery model was based on multi-country data from the period 1950-1970; in the work reported here we used multi-country data from the period 1990-2010. We have also improved the research methods. The Chenery regression model did not consider the impact of the population size of the country; this paper introduces the population size of the sample countries in an attempt to examine its impact.

2 Chenery model and debates

2.1 Key points of the Chenery model

Chenery and co-workers collected international data from more than one hundred countries from 1950 to 1970 and carried out regression simulations to calculate the standard structure of various economic variables in particular economic phases for different countries. The model consists of an estimation of general standard values for population urbanization at certain levels of economic development, which unfold in three stages (Chenery et al., 1988).
The conceptual framework is first set out. Defining the pattern of development means determining when systematic changes in the socioeconomic structure occurred when incomes and other indices of development increased. The original international comparative study was based on the work of Kuznets, which plays an important part in understanding the process of socioeconomic development and in identifying the consistency of the rules and characteristics of development. Ten basic processes, including 27 variables, were then selected to represent the essential characteristics of the economic development of these countries.
The quantitative model is then set. Taking nonlinearity and time series changes in cross-national relationships into consideration, a specific model suited to different kinds of countries was built.
Equations (1) and (2) are a basic cross-national regression model and Equation (2) takes external resources export into consideration. Equation (3) compares the results of the time series and cross-sectional data. X is an independent variable (27 variables) and Y represents the per capita GDP (in USD), N represents the population (million), F represents the net resources export of GDP, and Tj = time (j = 1, 2, 3, 4) and αi is the constant value of nation i.
The regression results are then calculated (Table 1). Based on 20,000 observed data items for over one hundred countries from 1950 to 1970, a consistency cross-sectional parameter estimation of structural change was calculated. These regression results were based on the definition of a medium sized country (N = 10).
Table 1 Differences in levels of urbanization at different income levels
Per capita income (USD) <100 100 200 300 400 500 800 1000 >1000
Urbanization rate (%) 12.8 22.0 36.2 43.9 49.0 52.7 60.1 63.4 65.8

Note: The median value of nations with a per capita income below USD 100 is USD 70 and for nations with a per capita income above USD 1000, USD 1500 is taken.

2.2 Debates about the Chenery model

Hollis B. Chenery is a world-renowned economist who teaches at Harvard University. He also served as Assistant Director of the US Agency for International Development and as the Vice President and Economic Advisor for the World Bank. He has a strong background in economic theory, but also has a wealth of experience in the real world economy and is therefore able to carry out the complex task of data collection and analysis. His work, Pattern of Development, 1950-1970, has been cited more than a thousand times and translated into a number of foreign languages. He divided complex economic process into ten kinds of structural change: investment, government revenue, education, domestic demand structure, production structure, trade structure, labor allocation, urbanization, demographic transition and income allocation. On the basis of the experimental data, a trajectory curve and relationship parameter can be plotted for each structural variable as the per capita income evolves to show a standard pattern of development; this can be used to investigate the characteristics of structural changes in economic growth.
Chenery’s model was groundbreaking and the Pattern of Development is a classic work in economic development for the following reasons: (1) systematic international comparisons take multi-country experiences as the rule and this has become an important method of study; (2) the use of an abstract deduction method and structural analysis of economic processes have become a basic method in economic analysis; and (3) the standard development pattern of multi-country economic growth has become a valuable reference system with which to study the economic problems of different countries.
Although the standard development pattern of the Chenery model is important, it has a number of drawbacks that mean that it is unable to compare, explain and interpret the relationship between urbanization and economic development in some countries.
(1) Time lag. The data in Chenery model were based on a time series for 1950-1970 and the regression parameter is no longer time valid.
(2) Chenery places the most importance on economic structure rather than urbanization. Twenty-seven variables were selected to analyze ten kinds of economic process. These are the proportions of domestic savings, investment, imported resources, government revenue, tax revenue, education expenditure, private consumption, public consumption, food consumption, primary production, industrial production, public services, service industry, exports, primary production exports, manufactured goods exports, labor export, export, primary industry labor, industries labor, service industries, and also the enrollment rate in primary school, urbanization rate, birth rate, death rate, 20% of top income allocation and 20% of bottom income allocation. The urbanization rate is only one of 27 variables; this needs further investigation.
(3) Two methods were used for population size in the Chenery model regression: the removal of data for countries with a population less than 1 million in 1960 and the use of data for ten medium sized countries, with an assumed population of 10 million. The former method neglects the development pattern of relatively small countries and the hypothesis of the latter method is very different from the real world.
(4) The data used in the Chenery model were derived from the World Bank and the per capita GDP is estimated in USD in 1964. As a result of price conversion and changes in the exchange rate, the per capita GDP in 2010 is different from that in 1964, so it would be wise to set a standard rule in studying the relationship between urbanization and economic development.
This paper tries to extend the results of the Chenery model. The Chenery model used international data (1950-1970) to investigate the quantitative relationship between urbanization and economic development. This study uses more recent international data (1990-2009) to re-estimate the parameters used in the Chenery model and compare the relationships for 1950-1970 with those for 1990-2009. The research data imply that there is a large time lag between the development of economic growth and the level of urbanization. The new relationship pattern is an evolution of the classic Chenery model over the past 40 years, a period of rapid development and inflation, and therefore this comparison is both valuable and meaningful.

3 Data and methods

3.1 Data

We have attempted to re-evaluate the quantitative parameters of the relationship between urbanization and economic development. We obtained research data from the World Bank’s online database and the level of urbanization is represented by the urbanization level, which was obtained from the World Bank and United Nations World Urbanization Prospects. Economic development is represented by the per capita gross national income (GNI) on purchasing power parity, i.e. the conversion on purchasing power parity exchange rate in dollar terms based on 2009 price data in US dollars. Our sample consisted of data from 226 countries and regions over a 20-year time period from 1990 to 2009. After removing samples with missing data for urbanization or economic development, 149 countries and regions remained, giving a total of 5960 sample points, which are ALB, DZA, AGO, ATG, ARG, ARM, AUS, AUT, BGD, BLR, BEL, BEN, BTN, BOL, BWA, BRA, BGR, BFA, BDI, CMR, CAN, CPV, CAF, TCD, CHL, CHN, COL, COD, COG, CRI, CIV, HRV, CYP, DNK, DMA, DOM, ECU, EGY, SLV, GNQ, EST, ETH, FJI, FIN, FRA, GAB, GMB, GEO, DEU, GHA, GRC, GRD, GTM, GIN, GNB, GUY, HND, HKG, HUN, ISL, IND, IDN, IRN, IRL, ISR, ITA, JAM, JPN, JOR, KEN, KIR, KOR, KGZ, LAO, LVA, LBN, LSO, LTU, LUX, MAC, MKD, MDG, MWI, MYS, MLI, MLT, MRT, MUS, MEX, MDA, MNG, MAR, MOZ, NAM, NPL, NLD, NZL, NIC, NER, NGA, NOR, PAK, PAN, PNG, PRY, PER, PHL, POL, PRT, ROU, RUS, RWA, WSM, SAU, SEN, SYC, SLE, SGP, SVK, SLB, ZAF, ESP, LKA, KNA, LCA, VCT, SDN, SWZ, SWE, CHE, SYR, TJK, TZA, THA, TGO, TON, TTO, TUN, TUR, UGA, UKR, GBR, USA, URY, VUT, VEN, VNM, YEM, ZMB.

3.2 Methods

The re-evaluation of the parameters in the relationship between urbanization and economic development is based on the Chenery model and other studies and uses rich data from multiple countries to examine the standard type of development. However, we also aimed to innovate and deepen the work of Chenery in three areas. First, the relationship pattern resulting from the regression analysis using updated data from the period 1990 to 2009 is more helpful in judging the relationship between urbanization and economic development in a single country. Second, Chenery used a single logarithmic model, which is a generic model that mainly accounts for the universality of 27 variables. We made two amendments to this model: we used a double logarithmic model and introduced urbanization as a time series variable. Third, we used different criteria to process the size of the national populations. The 149 countries were divided into three categories based on the size of the population in the countries or regions in 2009, as follows:
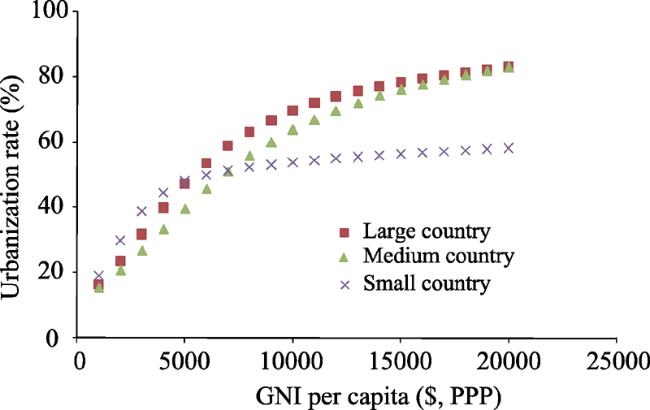
Large country - a total of 11 countries with a population >100 million (China, India, the USA, Indonesia, Brazil, Pakistan, Bangladesh, Nigeria, Russia, Japan and Mexico), giving a total population of 4.08 billion and accounting for 63.4% of the total population in the whole sample;
Medium country - a total of 60 countries or regions with a national population <100 million but >10 million, with a total population of 2.07 billion and accounting for 32.2% of the total population in the whole sample;
Small country - a total of 78 countries or regions with a national population is <10 million, with a total population of 280 million and accounting for 4.4% of the total population in the whole sample.
This categorical analysis of population size helps our understanding of the impact of population size on the relationship between urbanization and economic development. We used panel data to analyze the spatial and temporal urbanization characteristics of 149 countries worldwide. Table 2 gives the level of urbanization and economic characteristics of the data in the time period 1990-2009.
Table 2 Characteristics of the empirical data of the 149 countries in 1990-2009
No. of countries by size of population Index Sample Min. Max. Median Average Standard
Total (149) Urbanization 2980 5.4 100 53.5 52.1 23.6
Economic level 2980 200 67,200 4540 8832.6 10,443.6
Large country (11) Urbanization 220 19.8 86.0 46.5 52.3 21.4
Economic level 220 500 47,100 3230 8877.8 11,284.2
Medium country (60) Urbanization 1200 8.9 97.4 53.9 51.4 23.7
Economic level 1200 200 41,720 4115 7932.5 9380.3
Small country (78) Urbanization 1560 5.4 100 53.2 52.7 23.8
Economic level 1560 290 67,200 4960 9518.6 11,034.6
A logarithmic form was used to avoid the impact of heteroskedasticity in the model and the variable intercept panel data model for the fixed effects was used after applying the Hausman test and the F test for historical data. The urbanization level is not only affected by the current level of economic development, but also by the effects of the constraints of its previous urbanization level. The regression model is as follows:
In this model, yi,t is urbanization level of nation i in year t, yi,t-1, yi,t-2, ..., yi,t-s represents urbanization level of the year t-1, year t-2, ..., year t-s, xi,t represents the national (regional) economic level, C represents the intercept, α, β, ρ, γ represent coefficient terms, εi,t represents the random error term, and the lag period year s is determined in accordance with minimum criteria of AIC and SC.

4 Results

4.1 Parameter re-estimation

Table 3 gives the results of the parameter estimation. The heteroskedasticity test of longitu- dinal section in panel data was used to ensure the homogeneity assumption of the panel data. The results of the regression’s residuals imply that Durbin-Watson test statistic does not have first-order autocorrelation ensuring that there is no spurious regression problem. Table 3 also shows that the model coefficient estimates and the estimated overall effects are preferable and that the DW value is about 2; there was no residual autocorrelation. In the different kinds of large-, medium- and small-sized countries, the level of urbanization is positively correlated with the level of economic development in the current period and is also positively correlated with the level of urbanization in the former period.
Table 3 Parameter estimates and test of the regression model
Type
(lag period)
C α β γ R2 adjR2 DW F
Total (2) 0.0246***
(10.476)
1.8131***
(166.307)
-0.8215***
(-77.645)
0.0011***
(6.607)
0.9999 0.9999 2.13 1359778***
Large
country (2)
0.0153***
(3.799)
1.8299***
(41.603)
-0.8349***
(-19.259)
0.0007**
(2.586)
0.9999 0.9999 2.12 5134722***
Medium country (2) 0.0088***
(3.786)
1.8628***
(127.176)
-0.8661***
(-60.529)
0.0006***
(3.215)
0.9999 0.9999 2.15 4437116***
Small
country (2)
0.0347***
(8.584)
1.7940***
(115.203)
-0.8052***
(-53.523)
0.0011***
(4.298)
0.9999 0.9999 2.13 831196***

Note: *** and ** represents the significance level in 1% and 5%, and t statistics of each parameter is in the blocks.

4.2 Relation between pattern of urbanization and economic development, 1990-2009

Based on the results of the parameter re-estimation, the initial value of the level of urbanization should be determined to investigate the pattern of the relationship between urbanization and the level of economic development. This method is based on the sample data from 1990 and 1991, taking the economic level as USD 100 and using a double logarithm regression model. The values are 10.9860% and 11.3495%, respectively.
MATLAB software was coded to run the model, which consists of the calculation and iteration of large amounts of data. Figure 1 shows the pattern of the relation between urbanization and the level of economic development in 1990-2009. The figure shows the curves for the relationship between the proportion of the population that is urban and the per capita GNI, and the proportion of the population that is rural and the per capita GNI. Two conclusions can be drawn: (1) the point of intersection of the two curves is about 50%, which implies that when the per capita GNI is larger than USD 5100, the urban population accounts for more than half of the total population; and (2) when the urbanization rate reaches 70%-75%, the proportion of the urban population will remain stable. In the Chenery model, the urban population rate reached 50% when the per capita GNI exceeded USD 500 in 1950-1970 data set. The parameters of the new quantitative relationship are ten times larger than those of the Chenery model. It is worth noting that the upper limit (75%) of the proportion of the urban population is the same as the value in the Chenery model.
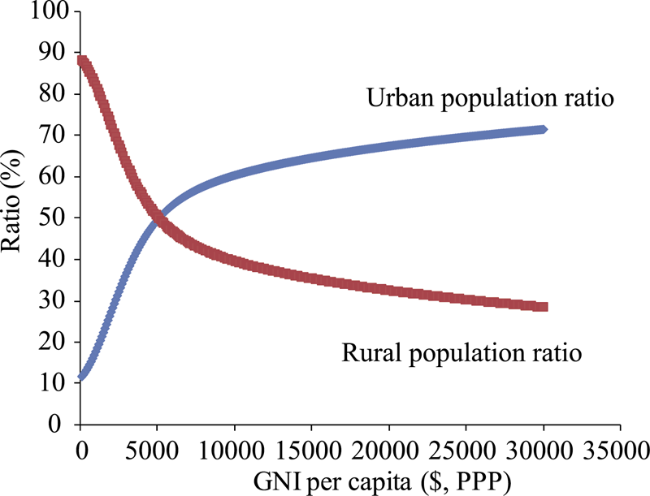
Figure 1 Urbanization and economic development in 1990-2009
In comparison of the new relationship pattern with that of the Chenery model (Table 4), it can be seen that the per capita GNI of the majority of the countries reached USD 100-1000 in 1950-1970, but the urbanization rate varied: USD 100 for 12.8% urbanization and USD 1000 for 63.4% urbanization. Based on the international data for 1990-2009, only the very poorest countries had a per capita GNI of USD 100-1000 and the rate of urbanization in this period did not change significantly, only increasing from 11.8 to 17.8%. It is easy to make mistakes when applying the Chenery model directly to make comparisons between urbanization and economic development at the current time and thus it is hard to judge and predict the development of urbanization.
Table 4 Comparison of the new model for 1990-2009 data and the Chenery model
Similar per capita GNI
Per capita GNI($) <100 100 200 300 400 500 800 1000 >1000
Chenery Urbanization rate (%) 12.8 22.0 36.2 43.9 49.0 52.7 60.1 63.4 65.8
New relationship pattern - 11.8 12.2 12.8 13.3 14.0 16.1 17.8 -
Similar urbanization rate
Urbanization rate (%) 12.8 22.0 36.2 43.9 49.0 52.7 60.1 63.4 65.8
Chenery Per capita
GNI ($)
<100 100 200 300 400 500 800 1000 >1000
New relationship
pattern
300 1500 2900 3900 4900 5800 9800 13,400 17,000
These differences in the rate of urbanization in countries with similar per capita GNIs cannot reveal the overall change in the characteristics of urbanization as a result of the economic development over the past 50 years. We therefore need to compare the Chenery model and new relationship pattern for similar rates of urbanization. The level of urbanization in the majority of countries reached 12.8%-63.4%. For countries with a level of urbanization of 12.8%, the per capita GNI in the Chenery model was USD 70 in 1950-1970 and reached USD 300 in 1990-2009. For a level of urbanization of 49.0%, the Chenery model’s per capita GNI increased from USD 400 to 4900 and for a level of urbanization of 65.8%, the Chenery model’s per capita GNI increased from USD 1500 to 17,000.
Obvious changes in the quantitative pattern of urbanization and level of economic development can be detected over this 50-year period. Table 5 shows the new pattern of urbanization and level of economic development, which is more suitable for this relationship in the current period. When the per capita GNI increased from USD 1000 to 10,000, the rate of urbanization increased from 17.78 to 60.36%. When the per capita GNI increased from USD 10,000 to 20,000, the rate of urbanization increased from 60.36% to 67.42%. When the per capita GNI increased from USD 20,000 to 30,000, the urbanization of rate increased from 67.42% to 71.46%. This implies that, as the promotion of the level of economic development, the driving force of per capita economic growth on urbanization decreases; when economic development reaches a certain level, then the level of urbanization will remain stable.
Table 5 New pattern of level of urbanization and economic development in 1990-2009
Per capita GNI (USD) 1000 2000 3000 4000 5000 6000 7000 8000 9000 10000
Urbanization rate (%) 17.78 27.36 36.82 44.30 49.60 53.24 44.20 57.68 59.15 60.36
Per capita GNI (USD) 12,000 14,000 16,000 18,000 20,000 22,000 24,000 26,000 28,000 30,000
Urbanization rate (%) 62.31 63.87 65.21 66.38 67.42 68.37 69.23 70.03 70.77 71.46

4.3 Disparity analysis of nations with different population sizes

Previous studies have found that national population size is an important influencing factor in the process of urbanization, although this influence is not linear. Different types of country have different patterns of development and a population of 25 million is usually used to divide a sample into large and small countries (Zhang and Zhao, 2003). In general, the size and proportion of the rural population is large in large countries to ensure food security and national security. This demonstrates that the potential rate of urbanization of a large country is relatively low (Chen et al., 2011).
The sample countries were divided into three types (large, medium and small) to explore the impact of the population size on the relationship between urbanization and economic development. The regression parameters (Table 3) showed that the coefficients were 0.0007, 0.0006 and 0.0011, respectively, which implies the urbanization of a small country is more likely to be influenced by the level of economic development than that of large and medium countries. This is because large countries have better conditions under which to develop agriculture and have a long history of cultivation, so the process of urbanization is relatively stable and reliable. However, as a result of their relatively small population size, changes in urbanization in small countries are greatly influenced by changes in economic development; the path dependency and stability of large and medium sized countries smooth these impacts.
Based on the regression parameters for various scenarios, different patterns of urbanization can be identified (Figure 2). When the per capita GNI is below USD 5200, the rates of urbanization of large and small countries are similar. When the per capita GNI is between USD 5200 and 7000, the rates of urbanization of medium and small countries are similar. Therefore different characteristics can be detected at different stages. When the per capita GNI is less than USD 5200, the urbanization of small countries is greater than that of large countries and medium countries have the lowest rate of urbanization. When the per capita GNI is between USD 5200 and 7000, the level of urbanization of large countries is greater than that of small countries and medium countries again have the lowest rate of urbanization. When the per capita GNI is more than USD 7000, the level of urbanization of large countries is similar to that of medium countries and small countries have a relatively low rate of urbanization.
Figure 2 may lead to the conclusion that small countries cannot reach a level of saturation in urbanization, which runs contrary to our thinking. Figure 2 shows the relationship between the level of urbanization and the level of economic development, in which the horizontal axis represents the per capita GNI, not time. If we take Singapore as an example, the rate of urbanization has reached 100% in the post-industrialization period, which cannot be reached by large countries. In samples with high levels of urbanization, the level of economic development of small countries is relatively high. Figure 3 shows the distribution of urbanization in three sizes of countries. When the per capita GNI exceeds USD 40,000, there are six countries with large population, two countries with a medium population and 33 countries with a small population. When the per capita GNI is larger than USD 50,000, there is no country with a large or medium population and 15 countries with a small population.
Figure 2 Impact of national population size and economic development on level of urbanization
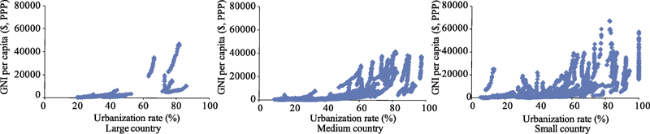
Figure 3 Distribution rate of urbanization in countries with different sizes of population

5 Conclusions and discussion

The Chenery model is based on international data and uses quantitative regression analysis to investigate the standard pattern of changes in economic structure as the economy grows. The groundbreaking research method and logics of analysis made this a classic method of analysis. However, the relationship between urbanization and the pattern of economic development is not the key point of the Chenery model and, as a result of deficiencies in historical data, this relationship requires further investigation. We took data from 149 countries in the time period 1990-2009 and used quantitative regression methods to identify new standard patterns of urbanization and economic development in the current era. We drew the following conclusions:
(1) As a result of the dependency of the sample data on time, the Chenery model for a standard development pattern has obvious limits that makes it unable to compare, explain and demonstrate the relationship between urbanization and economic development in different countries.
(2) The quantitative relationship between urbanization and patterns of economic development has changed significantly in the past 50 years. The per capita GNI for most countries was USD 100-1000 in 1950-1970, whereas the per capita GNI had increased to USD 1000-10,000 in 1990-2009. The rate of urbanization has increased from 17.78 to 60.36%. However, the urbanization saturation rate is still stable at about 75%.
(3) Population size affects the relationship between urbanization and the pattern of economic development and the impact of urbanization on a small country is much greater than in large and medium sized countries.
Combining this classic theory with the situation in China to generate policy implications is a path worth following. The work reported here tries to deepen our understanding of the Chenery model by applying quantitative analysis to define a standard pattern of urbanization and economic development in the new era. The standard pattern of the Chenery model is a reliable perspective from which to consider this question, but it needs to consider a combination of the general characteristics of global urbanization and of China’s situation in particular to develop a better way of developing the model scientifically. This paper provides a preliminary study of the effect of the population size on the relationship between urbanization and economic development. A sound conclusion should be that there are differences in both the peak and average levels of urbanization and economic development in countries with different sizes of population and that these differences have an impact on urbanization and patterns of economic development for different types of nation, which remain to be further explored.

The authors have declared that no competing interests exist.

1
Ba Shusong, Xing Yujing, Yang Xianling, 2010. Urbanization and economic growth: A long-run view.Reformation & Strategy, 26(2):16-19. (in Chinese)

2
Chen Mingxing, Lu Dadao, Zha Liangsong, 2009a. Urbanization and economic development in China: An international comparison based on quadrant map approach.Geographical Research, 28(2): 464-474. (in Chinese)

3
Chen Mingxing, Lu Dadao, Zhang Hua, 2009b. Comprehensive evaluation and the driving factors of China’s urbanization.Acta Geographica Sinica, 64(4): 387-398. (in Chinese)

4
Chen Mingxing, Lu Dadao, Zha Liangsong, 2010. The comprehensive evaluation of China’s urbanization and effects on resources and environment.Journal of Geographical Sciences, 20(1): 17-30.

5
Chen Mingxing, Ye Chao, Zhou Yi, 2011. Urbanization rate and its policy implications: discussion and development of Northam’s curve.Geographical Research, 30(8): 1499-1507. (in Chinese)

6
Chen Mingxing, Liu Weidong, Tao Xiaoli, 2013. Evolution and assessment on China’s urbanization 1960-2010: Under-urbanization or over-urbanization?Habitat International, 38(2): 25-33.

7
Chen Mingxing, Huang Yongbin, Tang Zhipenget al., 2014. The provincial pattern of the relationship between China’s urbanization and economic development.Journal of Geographical Sciences, 24(1): 33-45.

8
Chen Yanguang, 2011. Modelling the relationships between urbanization and economic development levels with three functions.Scientia Geographica Sinica, 31(1): 1-6. (in Chinese)

9
Chenery H, Moises Syrquin, Li Xinhua, et al., 1988. The Development Style: 1950-1970. Beijing: Economic Science Press. (in Chinese)

10
Fang Chuanglin, Wang Deli, 2011. Comprehensive measures and improvement of Chinese urbanization development quality.Geographical Research, 30(11): 1931-1946. (in Chinese)

11
Henderson JV, 2003. The urbanization process and economic growth: The so-what question.Journal of Economic Growth, 8(1): 47-71.

12
Li Xun, 2005. The effects of economic growth on Chinese urbanization: Panel data approach.Geographical Research, 24(3): 421-431. (in Chinese)

13
Li Yining, 2011. Views on China’s urbanization.Contemporary Finance & Economics, 314(1): 5-6. (in Chinese)

14
Liang Jinshe, 1999. A theoretical analysis of statistical relationship between urbanization and economic development.Journal of Natural Resources, 14(4): 351-354. (in Chinese)

15
Liu Weidong, Zhen Feng, 2004. Spatial implications of new information and communication technologies.Acta Geographica Sinica, 59(Suppl.): 67-76. (in Chinese)

16
Lu Dadao, Yao Shimou, Liu Hui, et al., 2007. China Regional Development Report 2006: Urbanization and Spatial Sprawl. Beijing: The Commercial Press. (in Chinese)

17
Lu Lin, Ge Jingbing, 2006. Reflection on the research progress of tourism urbanization.Geographical Research, 25(4): 741-750. (in Chinese)

18
Shen Yuming, Qiu Ling, Wang Maojunet al., 2007. Industry relevancy analysis of producer services in China.Acta Geographica Sinica, 62(8): 821-830. (in Chinese)

19
Wang De, Peng Xuehui, 2004. Research on local urbanization process within Japan.Urban Planning, 28(11): 29-34. (in Chinese)

20
Wang De, Peng Xuehui, 2005. Local urbanization and the relation with economy.Urban Planning Overseas, 20(6): 38-43. (in Chinese)

21
Wang Zheng, Ma Cuifang, Wang Yinget al., 2003. A geographical investigation into knowledge spillovers between regions.Acta Geographica Sinica, 58(5): 773-780. (in Chinese)

22
Xu Xueqiang, Wang Xin, Yan Xiaopei, 2002. Technology flow in the Pearl River Delta: Dynamism, channels and models.Acta Geographica Sinica, 57(4): 489-496. (in Chinese)

23
Yao Shimou, Lu Dadao, Wang Conget al., 2011. Urbanization in China needs comprehensive scientific thinking: Exploration of the urbanization mode adapted to the special situation of China.Geographical Research, 30(11): 1947-1955. (in Chinese)

24
Yuki K, 2007. Urbanization, informal sector and development.Journal of Development Economics, 84(1): 76-103.

25
Zhang Ying, Zhao Min, 2003. Urbanization and economic development: review and extension of Hollis Chenery’s study.Urban Planning Forum, 146(4): 10-18. (in Chinese)

26
Zhao Min, Zhang Ying, 2009. Development and urbanization: A revisit of Chenery-Syrquin’s patterns of development.Annals of Regional Science, 43(4): 907-924.

27
Zhou Yixing, 1982. The laws of the relationship between urbanization and GDP.Population and Economics, (1): 28-33. (in Chinese)

28
Zhou Yixing, 2006. Thoughts on the speed of China’s urbanization.Urban Planning, 30(Suppl.1): 32-40. (in Chinese)

Outlines

/