Orginal Article

Variations in net primary productivity and its relationships with warming climate in the permafrost zone of the Tibetan Plateau

  • MAO Dehua , 1 ,
  • LUO Ling 1 ,
  • WANG Zongming , 1, * ,
  • ZHANG Chunhua 2 ,
  • REN Chunying 1
Expand
  • 1. Key Laboratory of Wetland Ecology and Environment, Northeast Institute of Geography and Agroecology, CAS, Changchun 130102, China
  • 2. International Institute for Earth System Sciences, Nanjing University, Nanjing 210093, China

*Corresponding author: Wang Zongming, PhD and Professor, specialized in wetland remote sensing and regional responses to global change. E-mail:

Author: Mao Dehua, PhD, specialized in modeling vegetation NPP and responses of vegetation to climate change. E-mail:

Received date: 2014-08-06

  Accepted date: 2014-12-05

  Online published: 2015-07-17

Supported by

The Key Program of Chinese Academy of Sciences, No.KZZD-EW-08-02

The CAS/SAFEA International Partnership Program for Creative Research Teams

The Research Fund from NEGAE, CAS, No.Y2H1071001

The National Natural Science Foundation of China, No.41371403

Copyright

Journal of Geographical Sciences, All Rights Reserved

Abstract

Permafrost degradation triggered by a warming climate induces significant changes in soil conditions, and further contributes to apparent impacts on vegetation. However, much less is known regarding the difference in net primary productivity (NPP) and the relationships between NPP and warming temperature among different vegetation types and various types of permafrost zone on the Tibetan Plateau. Consequently, remotely sensed land surface temperature (LST) and NPP from the MODIS platform were used to investigate the response of vegetation NPP to warming climate, and the correlations were scaled up for the study region. Our results indicated a notable increase of NPP from west to east, and significantly increased annual NPP along with the increased LST from 2000 to 2010 in the permafrost zone of the Tibetan Plateau. Meanwhile, the increased NPP for various vegetation types and in different types of permafrost zone with relation to warming temperature was revealed. NPP in the continuous permafrost zone had the greatest sensitivity to the changing LST, and forest NPP presented the most obvious response. Positive correlations between NPP and LST at various scales indicated the enhanced effects of warming LST on vegetation carbon sequestration in the permafrost zone of the Tibetan Plateau. In view of the notable response of NPP to warming temperature on this plateau, remote sensing needs to be further employed to reveal the status of permafrost degradation and its related effects on vegetation.

Cite this article

MAO Dehua , LUO Ling , WANG Zongming , ZHANG Chunhua , REN Chunying . Variations in net primary productivity and its relationships with warming climate in the permafrost zone of the Tibetan Plateau[J]. Journal of Geographical Sciences, 2015 , 25(8) : 967 -977 . DOI: 10.1007/s11442-015-1213-8

1 Introduction

In the middle-high latitude of the Northern Hemisphere, degradation of permafrost triggered by climate warming has significantly impacted terrestrial ecosystems (Groisman and Soja, 2007; Yang et al., 2010; Bockheim et al., 2013). Changes in environmental conditions associated with permafrost thawing, such as variations in soil thermal properties, hydrological regime, nutrient availability (O’Donnell et al., 2011; Necsoiu et al., 2013), and notable global climate change feedbacks (Zimov et al., 2006), have been directly linked to changes in vegetation characteristics (Camill et al., 2001).
The impact of permafrost degradation on vegetation is a topic of ongoing research. Warming temperature in the permafrost zone induced significant effects on different vegetation types (Lioyd et al., 2003; Yi et al., 2011). For example, Jorgenson et al. (2001) determined that widespread and rapid permafrost degradation caused large shifts in ecosystems, changing birch forests to fens and bogs on the Tanana flats in central Alaska. Changes in the hydrothermal status of the soil active layer directly altered soil water-heat transmission and soil moisture storage conditions, therefore played a significant role in shrub expansion in northern ecosystems (Tape et al., 2006; Blok et al., 2010; Loranty and Goetz, 2012). Meanwhile, Jin et al. (2009) concluded that permafrost degradation accelerated the degeneration, desertification and salinization of grasslands by reducing soil moisture in thawed permafrost regions. Focusing on the Qinghai-Tibet Plateau, Wang et al. (2012) reported that vegetation will degenerate to different degrees due to increasing permafrost depth as a result of climate warming. In summary, all of these changes in environmental conditions induced by permafrost degradation exhibited remarkable and complicated effects on vegetation due to different extents of permafrost thawing. It is therefore necessary to investigate vegetation dynamics and their relationships to warming permafrost for various vegetation types and in different permafrost zones.
Vegetation in permafrost zone, as a vital component of the terrestrial carbon circle, plays an important role in carbon accumulation (Schaphoff et al., 2013). Net primary productivity (NPP), the net amount of carbon assimilated by vegetation in a given period, is an effective proxy for characterizing vegetation dynamics and carbon sequestration capacity (Nayak et al., 2010; Zhang et al., 2014). A large number of studies reported that changes in vegetation cover, growth conditions and growing season induced by thawing permafrost resulted in variations in vegetation NPP, further affecting global carbon dynamics (Euskirchen et al., 2006). For example, permafrost thawing affected vegetation community characteristics, such as plant species composition and productivity, accompanied by alterations to soil hydrological pattern and nutrient availability (Schuur et al., 2007; Chen et al., 2013). Natali et al. (2012) revealed that warming-induced permafrost thawing extended the growing season through earlier bud break and delayed senescence, which potentially led to increased plant productivity. However, we concluded that the previous studies were primarily conducted on the plot scale due to difficulties in field sampling. Only a limited number of studies projected the relationship between permafrost degradation and vegetation NPP up to regional scale or larger areas.
The Tibetan Plateau is the highest and largest plateau on the planet. This plateau has the largest permafrost area in China and is an important area for permafrost distribution in the Northern Hemisphere (Ran et al., 2012). Significant warming temperature and environmental changes on the Tibetan Plateau were observed (Wu and Zhang, 2008; Yao et al., 2006; Sheng et al., 2009). Permafrost degradation is characterized by a reduction in extent from continuous or discontinuous to sporadic or patch permafrost, permafrost thinning and an expansion of taliks. Permafrost extent is shrinking, and active layer thickness is increasing (Sheng et al., 2009). As a typical permafrost zone, although the plateau’s permafrost thawing and related ecosystem impacts have been discussed in previous studies (Wang et al., 2006; Yang et al., 2010), the influence of warming temperature in the permafrost zone on vegetation has mostly been investigated on the plots or small areas. For example, Chen et al. (2012) examined the response of vegetation characteristics to permafrost degradation in the upstream regions of the Shule River basin. Fang et al. (2011) revealed the impacts of permafrost change on NPP in the source regions of the Yangtze and Yellow Rivers. However, much less was focused on the spatial heterogeneity of NPP and its association with warming climate among different vegetation types and various types of permafrost zone on this plateau.
Because most permafrost areas are in remote locations, such as the Tibetan Plateau, continuous and wide field monitoring has been limited, and this limitation has made it difficult to assess the effects of permafrost degradation on vegetation comprehensively. Temperature was frequently selected as the indicator for characterizing permafrost degradation (Anisimov et al., 1997; Bockheim et al., 2013). The remote sensing approach allowed for the monitoring of surface temperature and vegetation productivity with a persistent profile at a large scale, which overcame the deficiency of having limited field observations (Epstein et al., 2012; Yao and Zhang, 2013). Therefore, Land surface temperature (LST), the factor used for characterizing permafrost condition (Westermann et al., 2011), was often selected to study the impacts of permafrost degradation on vegetation.
Remotely sensed LST allowed the relationship between warming temperature and vegetation NPP to be scaled up for spatial and dynamic analyses. And as a typical permafrost region of the Northern Hemisphere, vegetation on the Tibetan Plateau is sensitive to a warming climate and other environmental changes. It seems imperative to study the correlation between variability in NPP and warming temperature to understand the potential carbon sequestration capability of vegetation in permafrost zones and to promote ecological protection. Consequently, in this study, we aimed to (1) investigate the patterns and dynamics of vegetation NPP in the permafrost zone of the Tibetan Plateau; (2) examine the responses of NPP for various vegetation types and in different types of permafrost zone to warming climate; (3) reveal the correlations between NPP and LST in permafrost zone for discussing the association of vegetation NPP with permafrost degradation on the Tibetan Plateau.

2 Data sources and method

2.1 Study area

The permafrost zone of the Tibetan Plateau was selected as study area. The Tibetan Plateau has experienced a unique climate due to the complex topography and the influence of the Asian monsoon. Mean annual air temperature is below 0℃. Alpine grassland is the dominant vegetation type, while forest, wetland and crop in the eastern part occupied less area of the permafrost zone (Figure 1). Land cover data used in this study was reclassified from the Chinese land cover in 2005 (Liu et al., 2005) which was provided by Data Center for Resources and Environmental Sciences, Chinese Academy of Sciences (RESDC, http://www.resdc.cn). Internationally, permafrost was classified into different zones based on its permafrost extent estimated in percent area, including continuous permafrost (90%-100%), discontinuous permafrost (50%-90%), sporadic permafrost (10%-50%), and isolated patches of permafrost (0%-10%). According to this classification system, continuous permafrost zone on the plateau is only 300.01 km2, 1.83% of total permafrost area. The distribution of the various types of permafrost zone was mapped in Figure 1. The digital data for permafrost boundaries were obtained from the American National Snow and Ice Data Center (NSIDC, http://nsidc.org/data/docs/fgdc/ggd318_map_circumarctic).
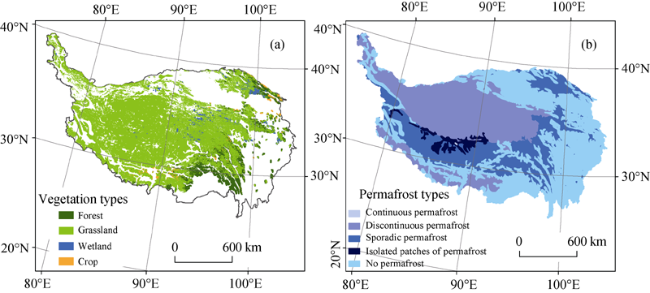
Figure 1 Spatial distribution of vegetation types (a) and permafrost types (b)

2.2 MODIS products

Long-term records of satellite-derived LST are currently accessible through a number of remote sensing platforms (Westermann et al., 2011). LST from the Moderate Resolution Imaging Spectroradiometer (MODIS) platform was most widely used. In this study, the LST product (MOD11A2) from 2000 to 2010 was extracted from the MODIS datasets of the Land Processes Distributed Active Archive Center (LP DAAC, https://lpdaac.usgs.gov/ products/modis_products_table/mod11a2). This dataset covering the study area is composed of daily 1-km LST values that are stored on a 1-km sinusoidal grid as the average of clear-sky LST values over an 8-day period. Accuracy of the product has been assessed over a widely distributed set of locations and time periods via several ground-truth and validation efforts. We calculated the mean value of LST for days and nights and then derived the mean annual values.
The NPP product (MOD17A3) from 2000 to 2010, produced by the Numerical Terra dynamic Simulation Group (NTSG)/University of Montana, was downloaded from LP DAAC and processed by MRT software to convert the format and the projection system. The accuracy of the NPP product at the spatial resolution of 1 km was assessed, and uncertainties in the product were established via independent measurements made in a systematic and statistically robust way that represents global conditions (Zhao et al., 2005). These data have been evaluated and used in studies from around the world (Zhao and Running, 2010). For a further instruction of the MODIS NPP on the Tibetan Plateau, a comparison was developed between observed NPP transformed from biomass (Ma et al., 2010) and MODIS NPP for grassland (Figure 2). The regressive coefficient (0.74) indicated a good modelling result for the MODIS products on this Plateau.
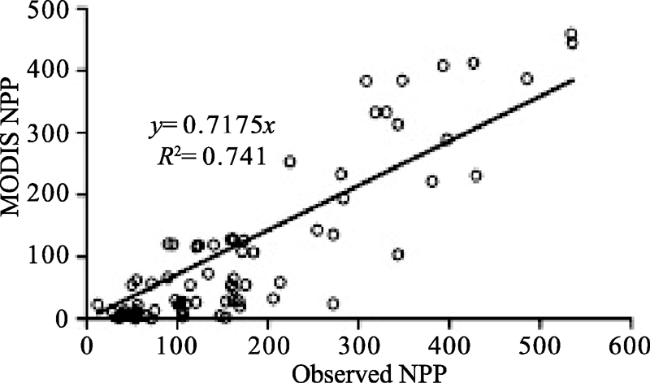
Figure 2 Comparison between observed NPP and MODIS NPP of grassland on the Tibetan Plateau

2.3 Correlation of vegetation NPP to LST

The correlation coefficient at the pixel scale was calculated using equation 1. The spatial pattern of the diverse correlation coefficients represents the different influences of LST on NPP; xi and yi represent the values of the two variables in the ith year, respectively.

3 Results and discussion

3.1 Annual NPP changes with relation to LST at the scale of the whole Tibetan Plateau

From 2000 to 2010, annual NPP increased significantly (p < 0.01) with increasing LST (Figure 3), and the increase of annual LST accounts for 25% of the increase in NPP (R2 = 0.25), with a correlation coefficient of 0.50. The positive correlation between NPP and surface temperature is consistent with that found by Mao et al. (2012) in the permafrost zone of Northeast China. Warming terrestrial surface temperatures accelerated permafrost thawing associated with more soil moisture and more mineralization and decomposition of nutrients, which increased vegetation productivity over a given period (Schuur et al., 2007). Meanwhile, the warming temperature may result in increasing growing season and thus improving the annual vegetation productivity (Zhuang et al., 2003). On the Qinghai-Tibet Plateau, Chen et al. (2013) also confirmed that warming climate enhanced NPP significantly. However, previous studies have mostly discussed the negative role of permafrost degradation in China (e.g., Wang et al., 2000). Our results revealed that warming temperature in the permafrost zone of the Tibetan Plateau played a positive role in vegetation growth and carbon sequestration from 2000 to 2010.
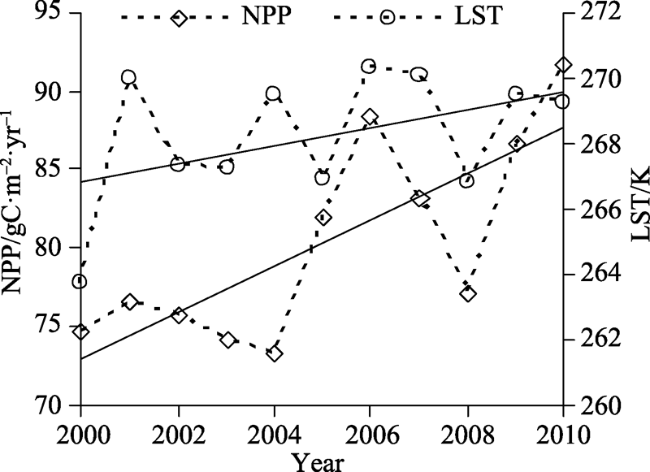
Figure 3 Response of annual NPP to the changing LST during 2000-2010

3.2 Spatial pattern of NPP and its dynamic correlations to LST at the scale of pixel

The map of mean annual NPP from 2000 to 2010 (Figure 4) showed a clear increase in NPP from the west to east that explained spatial gradient of NPP in the permafrost zone of the Tibetan Plateau. This result is consistent with estimation using the Terrestrial Ecosystem Model (TEM) (Zhuang et al., 2010), which attributed the west to east increase of NPP to the parallel increase in air temperature and precipitation. The alpine climate limited the growing environment of vegetation, further leading to lower NPP with a mean value of 80.5 gC·m-2·yr-1. As a result of differences in growth condition, mean annual NPP from 2000 to 2010 exhibited great variation among all 1 km × 1 km pixels with the largest value of 1398.4 gC·m-2·yr-1 and a standard deviation of 97.6 gC·m-2·yr-1. Several regions in the discontinuous permafrost zone, such as the area in the western part of the study region (Jin et al., 2009), where land degeneration is evident or the active layer is thin, exhibited low NPP values or had no vegetation. Larger NPP values were observed on the eastern side of the plateau where sporadic permafrost is the dominant type and is likely correlated with relatively high temperatures and soil moisture for alpine meadow and forest (Yang et al., 2008; Fan et al., 2010). Literature revealed that vegetation cover and biomass on the Tibetan Plateau were well correlated with permafrost depth (Wang et al., 2012). Owing to the various extents of permafrost thaw, different hydrothermal conditions contributed to the variations in NPP among various types of permafrost zone.
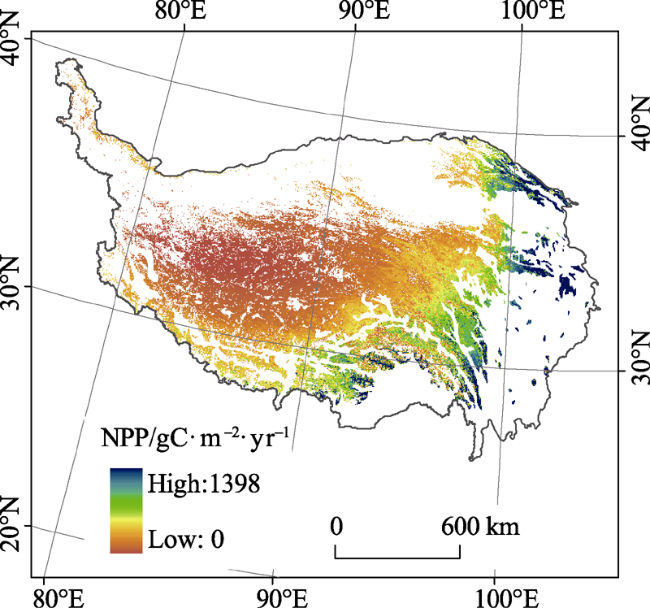
Figure 4 Spatial pattern of mean annual NPP from 2000 to 2010
In an attempt to explicitly understand the correlation between NPP and LST at the scale of 1 km × 1 km, correlations between dynamic NPP and LST from 2000-2010 were detected for all pixels (Figure 5). A positive correlation between NPP and LST was primarily found for the permafrost zone of the Tibetan Plateau. Although positive correlations were found for most of the pixels, 28.84% of the pixels showed negative correlations between NPP and LST. In these cases, the degraded permafrost induced by warming temperature not only accelerated the degeneration, desertification and salinization of the grassland, but also enhanced moisture evapotranspiration and reduced soil moisture by removing the impermeable layer (Yang et al., 2004). Jin et al. (2009) hypothesized that the degradation of permafrost lowers groundwater table and dries the surface soil, which degrades the alpine grassland. The negative correlations of NPP to LST can be attributed to limited moisture availability for vegetation growth induced by permafrost degradation.
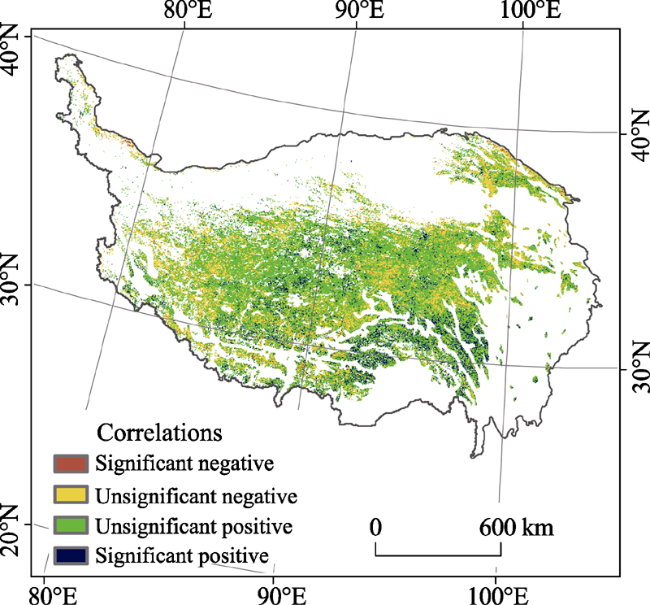
Figure 5 Correlations of annual NPP to LST from 2000 to 2010

3.3 NPP change and its association with LST for various vegetation types

Annual mean NPP for different vegetation types from 2000 to 2010 were calculated (Figure 6). Mean annual NPP values were observed as 272.7 gC·m-2·yr-1 for forest, 220.1 gC·m-2·yr-1 for crop, 149.3 gC·m-2·yr-1 for wetland, and 68.6 gC·m-2·yr-1 for grassland, respectively. Meanwhile, significant increases (P < 0.05) in NPP were observed for each vegetation type, which can be attributed to more soil moisture, longer growth season and increase in the thickness of active layer induced by warming permafrost (Camill et al., 2001). Along with the warming temperature, forest showed the largest increase in NPP from 2000 to 2010, while grassland showed the smallest.
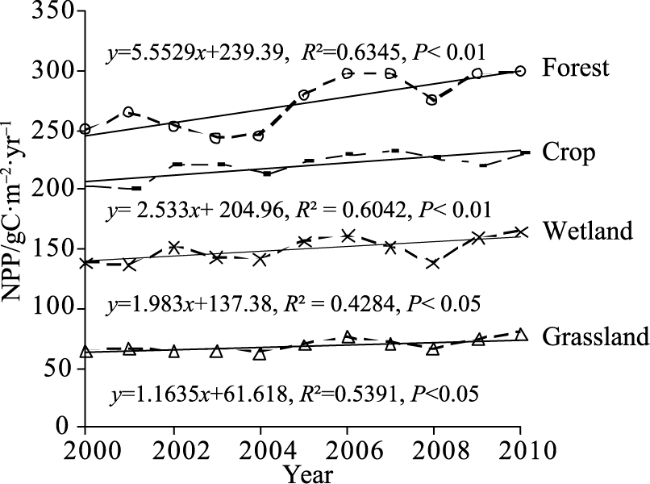
Figure 6 Annual changes of NPP for different vegetation types from 2000 to 2010
Correlations between NPP and LST during 2000-2010 were investigated to analyze the impacts of warming temperature on different vegetation types. NPP of the four vegetation types exhibited positive correlations with increasing LST, with a coefficient of 0.70 for forest, 0.50 for grassland, 0.38 for crop, and 0.33 for wetland. Based on the annual variations in NPP and its dependence on LST, we can conclude that forest NPP presented the most obvious response to warming temperature in the permafrost zone. Warming temperature in permafrost zone and induced rising CO2 concentration contributed to the improvement in forest NPP (Zhou et al., 2013). Widespread permafrost degradation caused by warming climate on the Tibetan Plateau affected the soil moisture content and nutrient supply, thereby affecting ecosystem structure and function. And moisture content of the surface layer decreased with increasing thaw depth (Yang et al., 2013). Alpine vegetation showed notable and complicated responses to warming permafrost in different regions. Therefore, the NPP changes depending on LST in different types of permafrost zones classified with various thawing extents need to be investigated.

3.4 NPP change depended on LST in different types of permafrost zone

Obvious annual variations and differences in NPP were observed among different types of permafrost zone (Figure 7). Mean NPP in the continuous and discontinuous permafrost zones had similar values, which might be correlated with the same low temperatures and low extents of thawing. Vegetation in the sporadic permafrost zone had the largest mean NPP value (114 gC·m-2·yr-1), while the zone with isolated patches of permafrost had the smallest value (14 gC·m-2·yr-1). Additionally, the sporadic permafrost zone and the isolated patches of permafrost zone had the largest and smallest standard deviations of NPP over the 11-year period, respectively. An optimal combination of water and energy is necessary for vegetation growth. Therefore, the differences in mean NPP in various permafrost zones can be interrelated with different factors limiting vegetation growth. Low temperature was the most likely factor explaining low NPP in continuous and discontinuous permafrost zones, while low moisture availability was the likely factor limiting vegetation growth in the isolated patches of permafrost zone.
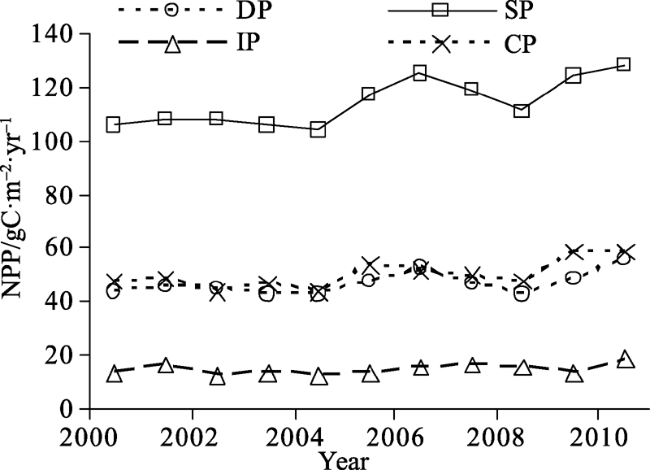
Figure 7 Annual changes in mean NPP in different types of permafrost zone on the Tibetan Plateau from 2000 to 2010 (CP: continuous permafrost zone; DP: discontinuous permafrost zone; SP: sporadic permafrost zone; IP: isolated patches of permafrost zone)
A slight increase in NPP for all types of permafrost zone was observed from 2000 to 2010. This increasing trend was primarily caused by warming temperatures and an associated increase in soil moisture and growing season length (Beck and Goetz, 2011). Various patterns and dynamics of NPP demonstrated the different response extents of vegetation to warming climate in the various permafrost zones on the Tibetan Plateau.
At the different types of permafrost zone scale, the relationship between NPP and LST changed from significantly positive in the continuous permafrost zone to relatively weakly positive in the discontinuous, sporadic and isolated patches of permafrost zones, with a correlation coefficient of 0.62, 0.51, 0.52 and 0.41 respectively. NPP in the continuous permafrost zone indicated that it has the greatest sensitivity to the changing LST, while NPP in isolated patches of permafrost zone suggested the least. Similar to the result from Yi et al. (2011), which was based on LST and fractional vegetation cover, various correlation coefficients in our study revealed the different responses and sensitivity of NPP to warming temperature in different types of permafrost zone. This result again demonstrated the positive effect of permafrost degradation on NPP. Increasing temperature, as well as the associated changes to the hydrological regime, directly and indirectly affected the NPP (Natali et al., 2012). This finding also illustrated the conclusion that permafrost degradation played a vital role in NPP variability that was also complicated with factors limiting vegetation growth in different permafrost zones. Consequently, the correlations between LST and NPP in the discontinuous, sporadic, and isolated patches of permafrost zones were not significant.

3.5 Some implications

Permafrost degradation induced by varied energy balance and changed permafrost temperature is an indisputable fact along with the warming climate. Obvious changes in hydrologic condition, soil composition, and microbial activity were further observed with the degradation of permafrost. These changes imposed significant influences on vegetation and ecosystem. However, the effects of permafrost degradation on vegetation had different reports. On the one hand, negative effects of permafrost degradation were detected on the vegetation. It was mainly attributed to loss of soil moisture and nutrient in a way of declining water level, increasing surface runoff due to thawed permafrost (Jin et al., 2009). On the other hand, positive impacts of permafrost degradation on vegetation have been observed in many literatures. Prolonged growing season, increased active soil layer and soil water, raised decomposition velocity of organic substances and increased carbon dioxide levels could be related to the improvement of vegetation growth (Euskirchen et al., 2006; Chen et al., 2012). The varied response of NPP to the warming LST throughout the permafrost zone of the Tibetan Plateau demonstrated this difference. The influences of permafrost degradation on vegetation productivity have been related to topography, vegetation type, soil texture, as well as the time. Therefore, it is essential to develop a long term field monitoring to further detect the responses of vegetation characteristics to altered environment resulted from permafrost degradation in the future. In addition, more data and products, such as the land surface water index (LSWI) from remote sensing will contribute to the related study.

4 Conclusions

A major consequence of global warming, permafrost degradation and its associated effects on regional vegetation and ecosystems have received increasing attentions. Remote sensing has been widely used as a data source in previous studies because of advantages due to its persistent profile and large scale. In this study, NPP and LST estimates based on remote sensing were used to investigate the responses of vegetation to warming climate on the Tibetan Plateau. Major findings were concluded as follows:
(1) NPP increased apparently from the west to east of the Tibetan Plateau, and significant NPP increases with increasing LST from 2000 to 2010 were observed. The alpine climate limited the growing environment of vegetation, further leading to lower NPP with a mean value of 80.5 gC·m-2·yr-1.
(2) Additionally, mean NPP for various vegetation types and mean NPP in different permafrost zones showed a clear increasing trend with relation to warming temperature. Results also revealed that NPP in the continuous permafrost zone had the greatest sensitivity to changing LST (r = 0.62), and forest NPP presented the most obvious response (r = 0.62).
(3) Positive correlations at various scales between NPP and LST from 2000 to 2010 indicated enhanced effects of permafrost degradation on carbon sequestration by vegetation.
Our study examined the different response characteristics of NPP to warming LST, but several points warrant further discussion. For example, the permafrost boundary is expected to retreat to the north as the warming climate. Thus, an updated permafrost distribution map is needed. An integrated study of the carbon exchange capacity of terrestrial ecosystems, which includes soil and vegetation, also needs to be developed in the next studies. Meanwhile, for the prediction of the impacts of climate change and human activities, integrating field observations with ecosystem models driven by remote sensing data at various temporal and spatial scales is essential.

The authors have declared that no competing interests exist.

1
Anisimov O A, Shiklomanov N I, Nelson F E, 1997. Global warming and active-layer thickness: Results from transient general circulation models.Global and Planetary Change, 15: 61-77.

2
Beck P S A, Goetz S J, 2011. Satellite observations of high northern latitude vegetation productivity changes between 1982 and 2008: Ecological variability and regional differences.Environmental Research Letters, 6: 045501.

3
Blok D, Heijmans M M P D, Schaepman-Strub Get al., 2010. Shrub expansion may reduce summer permafrost thaw in Siberian tundra.Global Change Biology, 16: 1296-1305.

4
Bockheim J, Vieira G, Ramos Met al., 2013. Climate warming and permafrost dynamics in the Antarctic Peninsula region.Global and Planetary Change, 100: 215-223.

5
Camill P, Lynch J A, Clark J Set al., 2001. Changes in biomass, aboveground net primary production, and peat accumulation following permafrost thaw in the Boreal peatlands of Manitoba, Canada.Ecosystems, 4: 461-478.

6
Chen H, Zhu Q, Peng Cet al., 2013. The impacts of climate change and human activities on biogeochemical cycles on the Qinghai-Tibetan Plateau.Global Change Biology, 19: 2940-2955.

7
Chen S, Liu W, Qin Xet al., 2012. Response characteristics of vegetation and soil environment to permafrost degradation in the upstream regions of the Shule River Basin.Environmental Research Letters, 7: 045406.

8
Epstein H E, Raynolds M K, Walker D Aet al., 2012. Dynamics of aboveground phytomass of the circumpolar Arctic tundra during the past three decades.Environmental Research Letters, 7: 015506.

9
Euskirchen E S, McGuire A D, Kicklighter D Wet al., 2006. Importance of recent shifts in soil thermal dynamics on growing season length, productivity, and carbon sequestration in terrestrial high-latitude ecosystems.Global Change Biology, 12: 731-750.

10
Fan J, Shao Q, Liu Jet al., 2010. Assessment of effects of climate change and grazing activity on grassland yield in the Three Rivers Headwaters Region of Qinghai-Tibet Plateau, China.Environmental Monitoring and Assessment, 170: 571-584.

11
Fang Y, Qin D, Ding Yet al., 2011. The impacts of permafrost change on NPP and implications: A case of the source regions of Yangtze and Yellow rivers.Journal of Mountain Science, 8: 437-447.

12
Groisman P, Soja A, 2007. Northern Hemisphere high latitude climate and environment change.Environmental Research Letters, 2: 045008.

13
Jin H, He R, Cheng Get al., 2009. Changes in frozen ground in the source area of the Yellow River on the Qinghai-Tibet Plateau, China, and their eco-environmental impacts.Environmental Research Letters, 4: 045206.

14
Jorgenson M T, Racine C H, Walters J Cet al., 2001. Permafrost degradation and ecological changes associated with a warming climate in central Alaska.Climatic Change, 48: 551-579.

15
Lioyd A H, Yoshikawa K, Fastie C Let al., 2003. Effects of permafrost degradation on woody vegetation at arctic treeline on the Seward Peninsula, Alaska.Permafrost and Periglacial Process, 14: 93-101.

16
Liu J, Zhang Z, Xu Xet al., 2010. Spatial patterns and driving forces of land use change in China during the early 21st century.Journal of Geographical Sciences, 20(4): 483-494.

17
Loranty M M, Goetz S J, 2012. Shrub expansion and climate feedbacks in Arctic tundra.Environmental Research Letters, 7: 011005.

18
Ma W, Fang J, Yang Yet al., 2010. Biomass carbon stocks and their changes in northern China’s grasslands during 1982-2006. Science China:Life Science, 53: 841-850.

19
Mao D, Wang Z, Luo Let al., 2012. Dynamic changes of vegetation net primary productivity in permafrost zone of Northeast China in 1982-2009 in responses to global change.Chinese Journal of Applied Ecology, 23: 1511-1519. (in Chinese)

20
Natali S M, Schuur E A G, Rubin R L, 2012. Increased plant productivity in Alaskan tundra as a result of experimental warming of soil and permafrost.Journal of Ecology, 100: 488-498.

21
Nayak R K, Patel N R, Dadhwal V K, 2010. Estimation and analysis of terrestrial net primary productivity over India by remote-sensing-driven terrestrial biosphere model.Environmental Monitoring and Assessment, 170: 195-213.

22
Necsoiu M, Dinwiddie C L, Walter G Ret al., 2013. Multi-temporal image analysis of historical aerial photographs and recent satellite imagery reveals evolution of water body surface area and polygonal terrain morphology in Kobuk Valley National Park, Alaska.Environmental Research Letters, 8: 025007.

23
O’Donnell J A, Jorgenson M T, Harden J Wet al., 2012. The effects of permafrost thaw on soil hydrologic, thermal, and carbon dynamics in an Alaskan peatland.Ecosystems, 15: 213-229.

24
Ran Y, Li X, Cheng Get al., 2012. Distribution of permafrost in China: An overview of existing permafrost maps.Permafrost and Periglacial Process, 23: 322-333.

25
Schaphoff S, Heyder U, Ostberg Set al., 2013. Contribution of permafrost soils to the global carbon budget.Environmental Research Letters, 8: 014026.

26
Schuur E A G, Grummer K G, Vogel J Get al., 2007. Plant species composition and productivity following permafrost thaw and thermokarst in Alaskan tundra.Ecosystems, 10: 280-292.

27
Sheng Y, Yao T, 2009. Integrated assessments of environmental change on the Tibetan Plateau. Environmental Research Letters, 4: 045201.

28
Tape K, Sturm M, Racine C, 2006. The evidence for shrub expansion in the Northern Alaska and the Pan-Arctic.Global Change Biology, 12: 686-702.

29
Wang G, Li Y, Wu Qet al., 2006. Impacts of permafrost changes on alpine ecosystem in Qinghai-Tibet Plateau. Science in China Series D: Earth Sciences, 49(11): 1156-1169.

30
Wang S, Jin H, Li Set al., 2000. Permafrost degradation on the Qinghai-Tibet Plateau and its environmental impacts. Permafrost and Periglacial Process, 11: 43-53.

31
Wang Z, Yang G, Yi Set al., 2012. Different response of vegetation to permafrost change in semi-arid and semi-humid regions in Qinghai-Tibetan Plateau.Environmental Earth Sciences, 66(3): 985-991.

32
Westermann S, Langer M, Boike J, 2011. Spatial and temporal variations of summer surface temperatures of high-arctic tundra on Svalbard: Implications for MODIS LST based permafrost monitoring.Remote Sensing of Environment, 115: 908-922.

33
Wu Q B, Zhang T J, 2008. Recent permafrost warming on the Qinghai-Tibetan Plateau.Journal of Geophysical Research, 113: D13108.

34
Yang M, Wang S, Yao Tet al., 2004. Desertification and its relationship with permafrost degradation in Qinghai-Xizang (Tibet) Plateau.Cold Regions Science and Technology, 39: 47-53.

35
Yang M, Nelson F E, Shiklomanov N Iet al., 2010. Permafrost degradation and its environmental effects on the Tibetan Plateau: A review of recent research.Earth-Science Reviews, 103: 31-44.

36
Yang Y, Fang J, Ji Cet al., 2008. Above- and belowground biomass allocation in Tibetan grasslands.Journal of Vegetation Science, 20: 177-184.

37
Yang Z, Gao J, Zhao Let al., 2013. Linking thaw depth with soil moisture and plant community composition: effects of permafrost degradation on alpine ecosystems on the Qinghai-Tibet Plateau.Plant and Soil, 367: 687-700.

38
Yao T, Zhu L, 2006. The response of environmental changes on Tibetan Plateau to global changes and adaption strategy.Advance in Earth Sciences, 21(5): 459-464. (in Chinese)

39
Yao Y. Zhang B, 2013. MODIS-based estimation of air temperature of the Tibetan Plateau.Journal of Geographical Sciences, 23(4): 627-640.

40
Yi S, Zhou Z, Ren Set al., 2011. Effects of permafrost degradation on alpine grassland in a semi-arid basin on the Qinghai-Tibetan Plateau.Environmental Research Letters, 6: 045403.

41
Zhao M, Heinsch F A, Nemani R Ret al., 2005. Improvements of the MODIS terrestrial gross and net primary production global data set.Remote Sensing of Environment, 95(2): 164-178.

42
Zhao M, Running S W, 2010. Drought-induced reduction in global terrestrial net primary production from 2000 through 2009.Science, 329: 940-943.

43
Zhang Y, Qi W, Zhou C, 2014. Spatial and temporal variability in the net primary production of alpine grassland on the Tibetan Plateau since 1982.Journal of Geographical Sciences, 24(2): 269-287.

44
Zhou L, Wang S, Kindermann Get al., 2013. Carbon dynamics in woody biomass of forest ecosystem in China with forest management practices under future climate change and rising CO2 concentration.Chinese Geographical Science, 23(5): 519-536.

45
Zhuang Q, He J, Lu Yet al., 2010. Carbon dynamics of terrestrial ecosystems on the Tibetan Plateau during the 20th century: An analysis with a process-based biogeochemical model.Global Ecology and Biogeography, 19: 649-662.

46
Zhuang Q, Mcguire A D, Melillo J M, 2003. Carbon cycling in extratropical ecosystems of the northern hemisphere during the 20th century: A modeling analysis of the influences of soil thermal dynamic.Tellus, 55: 751-776.

47
Zimov S A, Schuur E A G, Chapin Ⅲ F S, 2006. Permafrost and the global carbon budget.Science, 312: 1612-1613.

48
Zhou W, Sun Z G, Li J Let al., 2013. Desertification dynamic and the relative roles of climate change and human activities in desertification in the Heihe River Basin based on NPP.Journal of Arid Land, 5(4): 465-479. doi: 10.1007/s40333-013-0181-z.

Outlines

/