
Journal of Geographical Sciences >
Comparison of channel geometry changes in Inner Mongolian reach of the Yellow River before and after joint operation of large upstream reservoirs
*Corresponding author: Wang Suiji, PhD and Associate Professor, specialized in fluvial sedimentology, geomorphology and land surface process. E-mail:wangsj@igsnrr.ac.cn
Author: Su Teng, Master Candidate, specialized in fluvial geomorphology. E-mail:sut.12s@igsnrr.ac.cn
Received date: 2015-01-15
Accepted date: 2015-03-05
Online published: 2015-07-17
Supported by
National Natural Science Foundation of China, Grant No.41271027
National Basic Research Program of China (973 Program), No.2011CB403305
fund from the Ministry of Science and Technology of China, No.2013DFA91700
Copyright
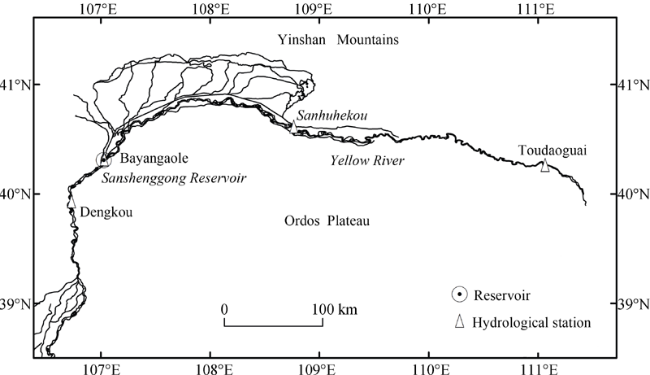
The impact of reservoirs on downstream river channel change has been a scientific issue in fluvial geomorphology during the last few decades. However, it is still a difficult issue as to how to express quantitatively the channel adjustment in the Inner Mongolian reach of the Yellow River induced by the joint operation of upstream reservoirs. Based on the shape parameters of channel cross-sections at four gauging stations in this river reach over a flooding season in two periods, 1978-1982 and 2008-2012, the present work investigated the channel changes in terms of shape parameter change rate under the same controlling water level in each flooding season at the channel cross-sections. Results showed that most of the change rates of the parameters evidently increased over a flooding season in both periods. However, the change rate of each parameter at the cross-sections decreased evidently in the latter period, compared with the former period. At the same time, the distribution pattern of the change rate of the shape parameters along the cross-sections thus changed from a convex curve in the former period to an S-shaped curve in the latter period. The obvious decrease of the change rates is related to the joint operation of the Liujiaxia and Longyangxia reservoirs. The reservoirs stored a large volume of water and decreased the peak discharge and maximum velocity in the flooding season; as a result, the erosion ability of the flood decreased accordingly. With the joint operation of the large reservoirs, the Inner Mongolian channel shrunk markedly. Therefore, the channel will present the possibility of an extreme flood in the future. Consequently, it is reasonable to adjust the function of the reservoirs in future. The total water and sediment discharges and the peak discharge in flooding seasons should be effectively controlled. Continuous shrinkage of the channel can thus be avoided and it can be ready for a potential extreme flood.
Key words: channel cross-section; shape parameters; change rate; reservoir; joint operation; Yellow River
SU Teng , WANG Suiji , MEI Yanguo , SHAO Wenwei . Comparison of channel geometry changes in Inner Mongolian reach of the Yellow River before and after joint operation of large upstream reservoirs[J]. Journal of Geographical Sciences, 2015 , 25(8) : 930 -942 . DOI: 10.1007/s11442-015-1211-x
Figure 1 Sketch of the Inner Mongolian reach of the Yellow River |
Table 1 Channel shape parameters under a given water level before and after a flooding season at Dengkou and Bayangaole cross-sections |
| Dengkou | Bayangaole | ||||||||||||
|---|---|---|---|---|---|---|---|---|---|---|---|---|---|
| Year | Date | S/m | A/m2 | B/m | H/m | B/H | Year | Date | S/m | A/m2 | B/m | H/m | B/H |
| 1976 | 6-10 | 1060.12 | 648 | 260 | 2.5 | 104.3 | 1978 | 5-2 | 1050.41 | 622 | 449 | 1.4 | 324.1 |
| 9-19 | 1060.69 | 1347 | 268 | 5.0 | 53.3 | 11-2 | 1050.16 | 1325 | 481 | 2.8 | 174.6 | ||
| 9-19 | 1060.12* | 1199 | 256 | 4.7 | 54.7 | 5-2 | 1050.16* | 512 | 426 | 1.2 | 354.4 | ||
| 1977 | 4-21 | 1060.00 | 594 | 258 | 2.3 | 112.1 | 1979 | 4-25 | 1050.24 | 617 | 439 | 1.4 | 312.4 |
| 10-20 | 1060.24 | 684 | 270 | 2.5 | 106.6 | 11-16 | 1049.66 | 598 | 468 | 1.3 | 366.3 | ||
| 10-20 | 1060.00* | 620 | 255 | 2.4 | 104.9 | 4-25 | 1049.66* | 367 | 258 | 1.4 | 181.4 | ||
| 1978 | 3-17 | 1060.14 | 520 | 208 | 2.5 | 83.2 | 1980 | 5-10 | 1049.42 | 245 | 291 | 0.8 | 345.6 |
| 9-19 | 1061.39 | 1655 | 288 | 5.7 | 50.1 | 11-20 | 1049.97 | 508 | 384 | 1.3 | 290.3 | ||
| 9-19 | 1060.14* | 1314 | 264 | 5.0 | 53.0 | 11-20 | 1049.42* | 393 | 356 | 1.1 | 322.5 | ||
| 1980 | 5-2 | 1059.71 | 481 | 204 | 2.4 | 86.5 | 1981 | 4-13 | 1050.36 | 481 | 393 | 1.2 | 321.1 |
| 10-26 | 1060.32 | 838 | 274 | 3.1 | 89.6 | 11-23 | 1049.47 | 1046 | 426 | 2.5 | 173.5 | ||
| 10-26 | 1059.71* | 682 | 247 | 2.8 | 89.5 | 4-13 | 1049.47* | 225 | 250 | 0.9 | 277.8 | ||
| 1982 | 4-21 | 1059.84 | 646 | 278 | 2.3 | 119.6 | 1982 | 4-26 | 1049.63 | 621 | 373 | 1.7 | 224.0 |
| 10-19 | 1060.48 | 1143 | 281 | 4.1 | 69.1 | 11-20 | 1049.71 | 603 | 400 | 1.5 | 265.3 | ||
| 10-19 | 1059.84* | 968 | 267 | 3.6 | 73.6 | 11-20 | 1049.63* | 551 | 394 | 1.4 | 281.7 | ||
| 2008 | 4-30 | 1060.62 | 374 | 135 | 2.8 | 48.7 | 2008 | 4-7 | 1051.22 | 484 | 322 | 1.5 | 214.2 |
| 11-1 | 1060.89 | 492 | 148 | 3.3 | 44.5 | 11-11 | 1050.6 | 416 | 361 | 1.2 | 313.3 | ||
| 11-1 | 1060.62* | 453 | 141 | 3.2 | 43.9 | 4-7 | 1050.6* | 288 | 310 | 0.9 | 333.7 | ||
| 2009 | 5-16 | 1060.80 | 476 | 166 | 2.9 | 57.9 | 2009 | 4-1 | 1051.73 | 757 | 434 | 1.7 | 248.8 |
| 10-18 | 1061.24 | 743 | 173 | 4.3 | 40.3 | 9-21 | 1051.2 | 1264 | 402 | 3.1 | 127.9 | ||
| 10-18 | 1060.80* | 668 | 176 | 3.8 | 46.4 | 4-1 | 1051.2* | 533 | 407 | 1.3 | 310.8 | ||
| 2010 | 6-9 | 1061.30 | 620 | 181 | 3.4 | 52.8 | 2010 | 4-13 | 1051.54 | 739 | 418 | 1.8 | 236.4 |
| 10-19 | 1060.96 | 565 | 197 | 2.9 | 68.7 | 8-11 | 1051.03 | 574 | 421 | 1.4 | 308.8 | ||
| 6-9 | 1060.96* | 558 | 180 | 3.1 | 58.0 | 4-13 | 1051.03* | 527 | 413 | 1.3 | 323.7 | ||
| 2011 | 4-24 | 1060.77 | 465 | 172 | 2.7 | 63.6 | 2011 | 4-12 | 1050.93 | 482 | 321 | 1.5 | 213.8 |
| 10-20 | 1061.19 | 767 | 199 | 3.9 | 51.6 | 9-21 | 1050.85 | 1036 | 348 | 3.0 | 116.9 | ||
| 10-20 | 1060.77* | 690 | 178 | 3.9 | 45.9 | 4-12 | 1050.85* | 537 | 338 | 1.6 | 212.7 | ||
| 2012 | 4-22 | 1060.52 | 510 | 169 | 3.0 | 56.0 | 2012 | 3-24 | 1050.48 | 573 | 255 | 2.2 | 113.5 |
| 10-24 | 1060.89 | 794 | 189 | 4.2 | 45.0 | 10-3 | 1051.12 | 1352 | 340 | 4.0 | 85.5 | ||
| 10-24 | 1060.52* | 725 | 184 | 3.9 | 46.7 | 10-3 | 1050.48* | 1137 | 333 | 3.4 | 97.5 | ||
Note: *, controlling water level; S, water level; B, water width; H, mean water depth; B/H, width to depth rate. |
Table 2 Channel shape parameters under a given water level before and after a flooding season at Sanhuhekou and Toudaoguai cross-sections |
| Sanhuhekou | Toudaoguai | ||||||||||||
|---|---|---|---|---|---|---|---|---|---|---|---|---|---|
| Year | Date | S/m | A/m2 | B/m | H/m | B/H | Year | Date | S/m | A/m2 | B/m | H/m | B/H |
| 1978 | 5-14 | 1018.27 | 597 | 279 | 2.1 | 130.4 | 1978 | 6-11 | 985.06 | 300 | 185 | 1.6 | 114.1 |
| 11-8 | 1017.61 | 883 | 328 | 2.7 | 121.8 | 10-9 | 988.03 | 1278 | 520 | 2.5 | 211.6 | ||
| 5-14 | 1017.61* | 401 | 255 | 1.6 | 162.2 | 10-9 | 985.06* | 115 | 247 | 0.5 | 530.5 | ||
| 1979 | 5-19 | 1016.66 | 209 | 213 | 1.0 | 217.1 | 1979 | 7-17 | 984.78 | 224 | 185 | 1.2 | 152.8 |
| 10-20 | 1017.63 | 800 | 203 | 3.9 | 51.5 | 11-26 | 987.13 | 738 | 362 | 2.0 | 177.6 | ||
| 10-20 | 1016.66* | 607 | 194 | 3.1 | 62.0 | 11-26 | 984.78* | 198 | 146 | 1.4 | 107.7 | ||
| 1980 | 5-21 | 1016.57 | 275 | 211 | 1.3 | 161.9 | 1980 | 5-8 | 986.5 | 602 | 353 | 1.7 | 207.0 |
| 10-27 | 1017.79 | 889 | 207 | 4.3 | 48.2 | 11-10 | 985.54 | 352 | 254 | 1.4 | 183.3 | ||
| 10-27 | 1016.57* | 655 | 172 | 3.8 | 45.2 | 5-8 | 985.54* | 345 | 192 | 1.8 | 106.9 | ||
| 1981 | 5-14 | 1016.41 | 290 | 75 | 3.9 | 19.4 | 1981 | 5-9 | 986.03 | 467 | 314 | 1.5 | 211.1 |
| 12-28 | 1018.34 | 1060 | 353 | 3.0 | 117.6 | 9-28 | 990.29 | 3064 | 727 | 4.2 | 172.5 | ||
| 12-28 | 1016.41* | 492 | 202 | 2.4 | 82.9 | 9-28 | 986.03* | 1072 | 300 | 3.6 | 84.0 | ||
| 1982 | 5-7 | 1016.86 | 421 | 268 | 1.6 | 170.6 | 1982 | 5-19 | 985.56 | 370 | 243 | 1.5 | 159.6 |
| 10-16 | 1018.42 | 1353 | 385 | 3.5 | 109.6 | 10-3 | 988.06 | 1091 | 537 | 2.0 | 264.3 | ||
| 10-16 | 1016.86* | 784 | 315 | 2.5 | 126.6 | 10-3 | 985.56* | 119 | 245 | 0.5 | 504.4 | ||
| 2008 | 4-4 | 1019.33 | 615 | 224 | 2.7 | 81.6 | 2008 | 4-6 | 987.53 | 900 | 360 | 2.5 | 144.0 |
| 11-10 | 1018.97 | 473 | 212 | 2.2 | 95.1 | 11-3 | 987.16 | 637 | 283 | 2.3 | 125.7 | ||
| 4-4 | 1018.97* | 527 | 211 | 2.5 | 84.5 | 4-6 | 987.16* | 771 | 347 | 2.2 | 156.2 | ||
| 2009 | 4-4 | 1019.75 | 965 | 250 | 3.9 | 64.8 | 2009 | 4-7 | 987.62 | 744 | 335 | 2.2 | 150.8 |
| 9-30 | 1019.04 | 585 | 211 | 2.8 | 76.1 | 11-1 | 986.89 | 572 | 306 | 1.9 | 163.7 | ||
| 4-4 | 1019.04* | 810 | 245 | 3.3 | 74.1 | 4-7 | 986.89* | 515 | 309 | 1.7 | 185.4 | ||
| 2010 | 4-7 | 1019.57 | 796 | 269 | 3.0 | 90.9 | 2010 | 4-14 | 987.62 | 784 | 340 | 2.3 | 147.4 |
| 10-15 | 1019.21 | 601 | 209 | 2.9 | 72.7 | 10-26 | 986.68 | 577 | 287 | 2.0 | 142.7 | ||
| 4-7 | 1019.21* | 718 | 264 | 2.7 | 97.1 | 4-14 | 986.68* | 502 | 271 | 1.9 | 146.3 | ||
| 2011 | 4-8 | 1019.17 | 618 | 205 | 3.0 | 68.0 | 2011 | 4-5 | 987.37 | 635 | 297 | 2.1 | 138.9 |
| 10-16 | 1019.02 | 528 | 210 | 2.5 | 83.5 | 10-23 | 987.14 | 737 | 290 | 2.5 | 114.1 | ||
| 4-8 | 1019.02* | 587 | 203 | 2.9 | 70.2 | 4-5 | 987.14* | 562 | 295 | 1.9 | 154.8 | ||
| 2012 | 3-21 | 1020.46 | 888 | 320 | 2.8 | 115.3 | 2012 | 4-5 | 987.5 | 699 | 300 | 2.3 | 128.8 |
| 10-17 | 1018.83 | 642 | 296 | 2.2 | 136.5 | 10-9 | 987.68 | 970 | 324 | 3.0 | 108.2 | ||
| 3-21 | 1018.83* | 442 | 187 | 2.4 | 79.1 | 10-9 | 987.5* | 300 | 185 | 1.6 | 114.1 | ||
Note: *, controlling water level; S, water level; B, water width; H, mean water depth; B/H, width-to-depth rate. |
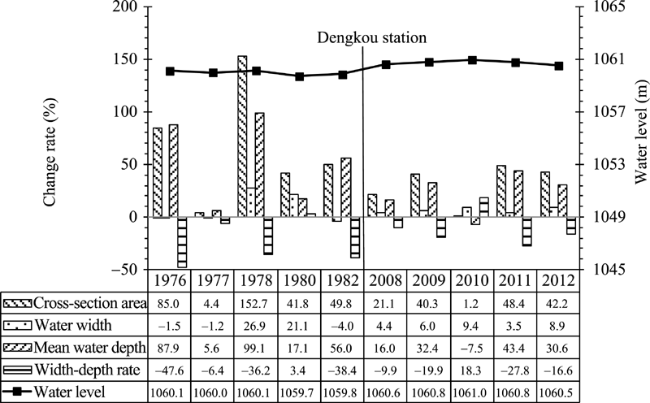
Figure 2 Change rates of channel shape parameters at Dengkou cross-section after a flooding season |
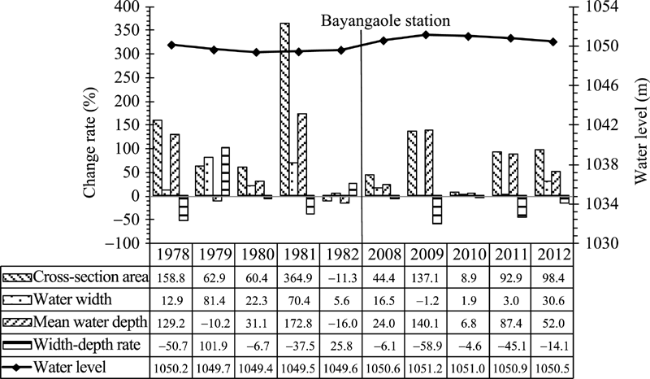
Figure 3 Change rates of channel shape parameters at Bayangaole cross-section after a flooding season |
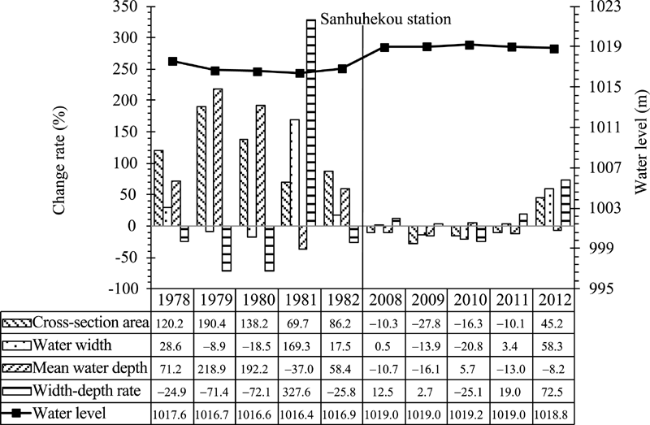
Figure 4 Change rates of channel shape parameters at Sanhuhekou cross-section after a flooding season |
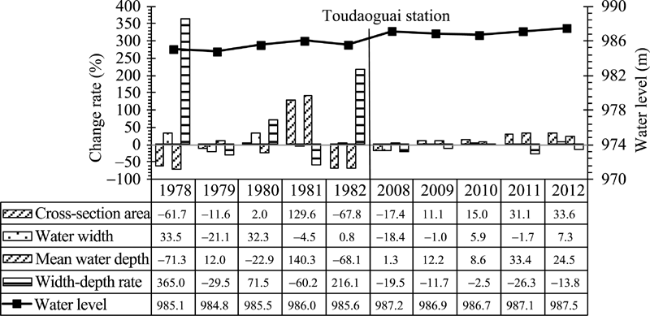
Figure 5 Change rates of channel shape parameters at Toudaoguai cross-section after a flooding season |
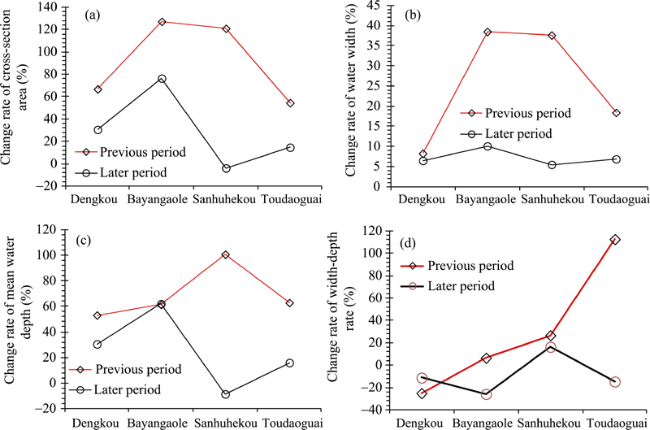
Figure 6 Spatial variation of the change rates of channel shape parameters during the periods 1978-1982 and 2008-2012 |
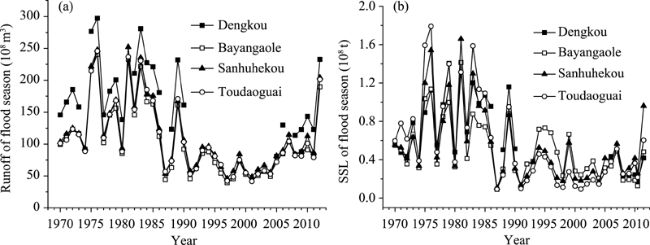
Figure 7 Variations of runoff (a) and SSL (b) in the flooding seasons in the period 1970-2012 |
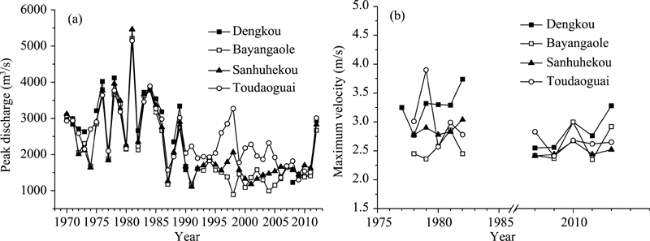
Figure 8 Variations of peak discharge (a) and maximum flow velocity (b) in flooding seasons |
The authors have declared that no competing interests exist.
| 1 |
|
| 2 |
|
| 3 |
|
| 4 |
|
| 5 |
|
| 6 |
|
| 7 |
|
| 8 |
|
| 9 |
|
| 10 |
|
| 11 |
|
| 12 |
|
| 13 |
|
| 14 |
|
| 15 |
|
| 16 |
|
| 17 |
|
| 18 |
|
| 19 |
|
| 20 |
|
| 21 |
|
| 22 |
|
| 23 |
|
| 24 |
Yellow River Conservancy Commission (YRCC), 1976-1982, 2008-2012. The hydrological data in the Yellow River Basin. (in Chinese)
|
| 25 |
|
| 26 |
|
| 27 |
|
| 28 |
|
/
| 〈 |
|
〉 |