
Journal of Geographical Sciences >
Spatio-temporal characteristics and causes of changes in erosion-accretion in the Yangtze (Changjiang) submerged delta from 1982 to 2010
*Corresponding author: Wang Jun (1975-), PhD and Professor, specialized in urban physical geography research and assessment of coastal disaster risk. E-mail:jwang@geo.ecnu.edu.cn
Author: Song Chengcheng (1991-), specialized in assessment of coastal disaster risk. E-mail:songchengcheng2008@163.com
Received date: 2014-12-20
Accepted date: 2015-01-25
Online published: 2015-07-17
Supported by
National Natural Science Foundation of China, No.71373084
Global Change Scientific Research Program of China, No.2010CB951204
Innovation Program of Shanghai Municipal Education Commission, No.13ZZ035
Copyright
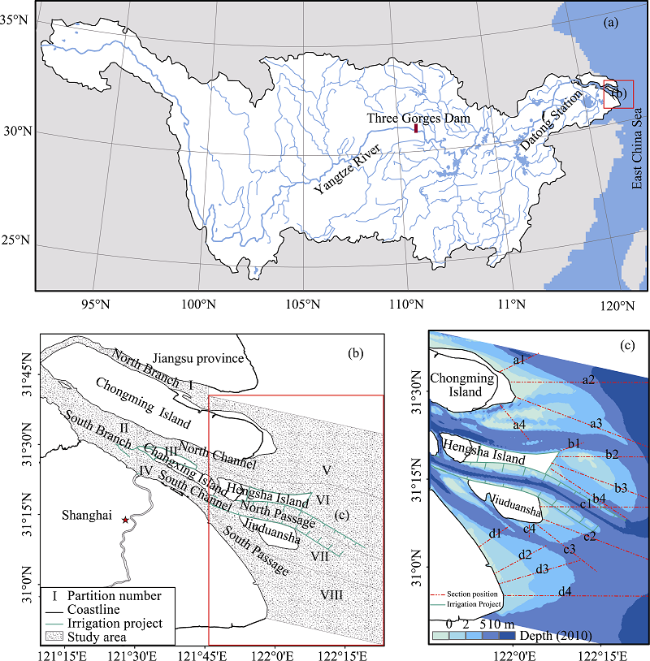
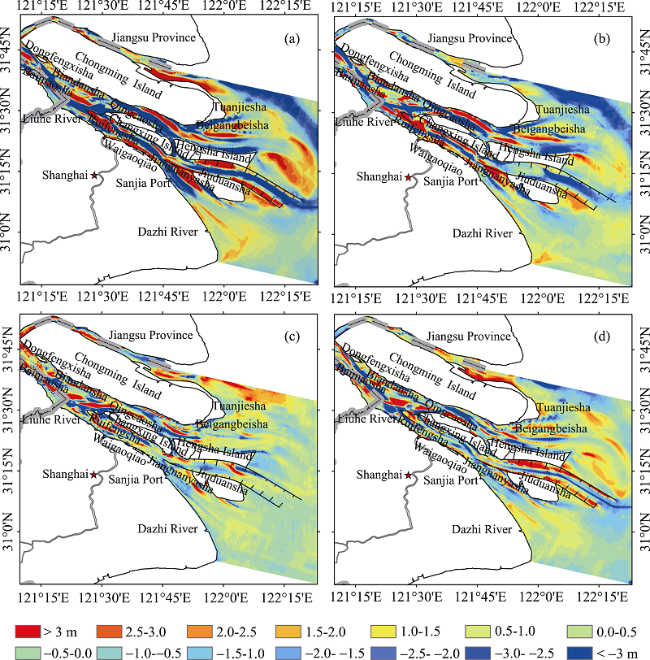
The Yangtze delta’s response to accelerating river damming and irrigation is a topic of global concern. This research analyzed the general erosion-accretion of the submerged delta front, the spatio-temporal changing pattern in different sub-regions, the geomorphological changes in typical cross-sections, and the geomorphological causes of the four main sub-regions (the eastern tidal wetland of Chongming-CM, the Hengsha shoal-HS, the Jiuduansha wetland-JDS, and the eastern tidal wetland of Nanhui-NH). Data sources include topographic data measured at high-resolution, sediment load at Datong Station, and the corresponding estuary construction information. Major findings are: (1) in general, the study area had slightly eroded (the erosion area ratio was 51.83% and the accretion area ratio was 48.17%) from 1982 to 2010, and it had experienced a shift of “erosion-accretion- erosion”. The spatio-temporal change of geomorphology was also significant in the eight sub-regions, excluding constant erosion in the North Channel; (2) evolution in eastern and northern CM and HS, northern JDS, and the region within the 5 m isobath of NH was dominated by vertical deposition, which was the opposite of that in southern CM and HS, and the region within the 5 m isobath of eastern and southern JDS; (3) on the whole, the encompassed surface areas (ESAs) of the 2 m and 5 m isobaths kept increasing, and the annual growth rates reached 10.42 km2/yr and 7.99 km2/yr respectively during 1982-2010 (however, four sub-regions exhibited disagreements), and in the whole region and all sub-regions, the ESA of the 10 m isobath decreased, while the ESA of the 15 m isobath changed slightly during the period and remained stable; (4) being less influenced by the estuarine engineering, CM was the only sub-region where the ESA of the isobath decreased in accordance with the decline of the sediment load. Major conclusions are that estuarine engineering projects play an increasingly important role in affecting the submerged delta against the macro-background of the reduction of sediment load, the change of ESA and the distribution of isobaths. Along with the accelerating construction of the Shanghai International Shipping Centre and reclamation project, the geomorphological evolution of the submerged delta will become more complex and thus deserves frequent monitoring in the future.
SONG Chengcheng , SUN Xiaojing , WANG Jun , LI Mengya , ZHENG Lu . Spatio-temporal characteristics and causes of changes in erosion-accretion in the Yangtze (Changjiang) submerged delta from 1982 to 2010[J]. Journal of Geographical Sciences, 2015 , 25(8) : 899 -916 . DOI: 10.1007/s11442-015-1209-4
Figure 1 Yangtze River watershed, showing locations of the Three Gorges Dam (TGD) and Datong hydrological station (a); Map of the Yangtze Estuary and the eight study sub-regions (b); The distribution of the submerged delta and the 16 typical sections (c) described in this study |
Table 1 Analysis of erosion-accretion for the different study periods |
| Indicators/periods | 1982-2010 | 1982-1997 | 1997-2002 | 2002-2010 |
|---|---|---|---|---|
| Area ratio of accretion and erosion zones | 0.92 | 0.90 | 1.14 | 1.05 |
| Net erosion-accretion quantity (108 m3/yr) | -0.54 | -1.26 | 0.74 | -0.01 |
| Net erosion-accretion rate (cm/yr) | -1.11 | -2.56 | 1.50 | -0.02 |
| Accretion area (108 m2) | 23.66 | 23.32 | 26.21 | 25.18 |
| Accretion volume (108 m3) | 41.98 | 31.02 | 28.01 | 30.96 |
| Erosion area (108 m2) | 25.46 | 25.80 | 22.92 | 23.96 |
| Erosion volume (108 m3) | 57.25 | 49.93 | 24.32 | 31.02 |
Note: Negative values indicate erosion and positive values accretion. |
Figure 2 Accretion and erosion in the Yangtze Estuary during 1982-2010 (a), 1982-1997 (b), 1997-2002 (c), and 2002-2010 (d)(Note: Negative values indicate erosion and positive values accretion. Elevation in meters.) |
Table 2 District statistics of erosion-accretion change in different periods in the Yangtze Estuary |
| Indicators Areas/periods | Net erosion-accretion quantity (108 m3) | Net erosion-accretion rate (cm/yr) | ||||||
|---|---|---|---|---|---|---|---|---|
| 1982-2010 | 1982-1997 | 1997-2002 | 2002-2010 | 1982-2010 | 1982-1997 | 1997-2002 | 2002-2010 | |
| ① NB | 1.91 | -0.76 | 1.35 | 1.32 | 3.11 | -2.32 | 12.31 | 7.52 |
| ② SB | -6.40 | -4.87 | 0.65 | -2.18 | -4.63 | -6.57 | 2.60 | -5.46 |
| ③ NC | -4.70 | -2.99 | -0.76 | -0.94 | -10.57 | -12.57 | -9.41 | -7.27 |
| ④ SC | -1.36 | 0.79 | -0.83 | -1.32 | -2.52 | 2.72 | -8.47 | -8.42 |
| ⑤ CM | -4.53 | -11.28 | 5.85 | 0.89 | -1.31 | -6.07 | 9.45 | 0.90 |
| ⑥ HS | -0.52 | -2.91 | -1.71 | 4.10 | -0.22 | -2.36 | -4.13 | 6.19 |
| ⑦ JDS | -0.18 | 1.90 | -0.35 | -1.73 | -0.09 | 1.86 | -1.02 | -3.14 |
| ⑧ NH | 0.83 | 1.41 | -0.56 | -0.02 | 0.27 | 0.86 | -1.03 | -0.03 |
Note: Negative values indicate erosion, and positive values accretion. |
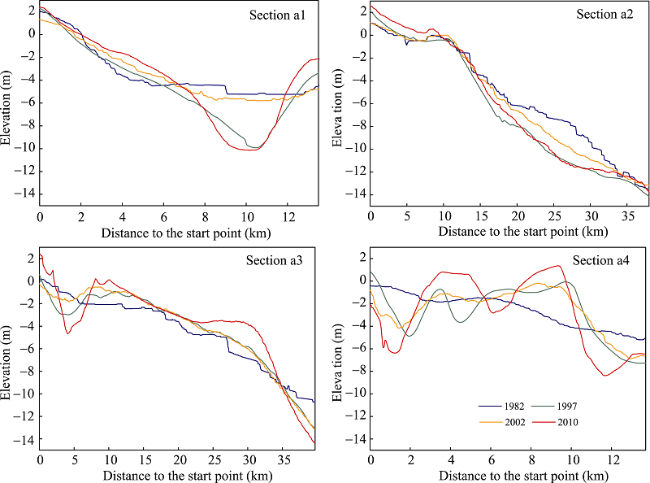
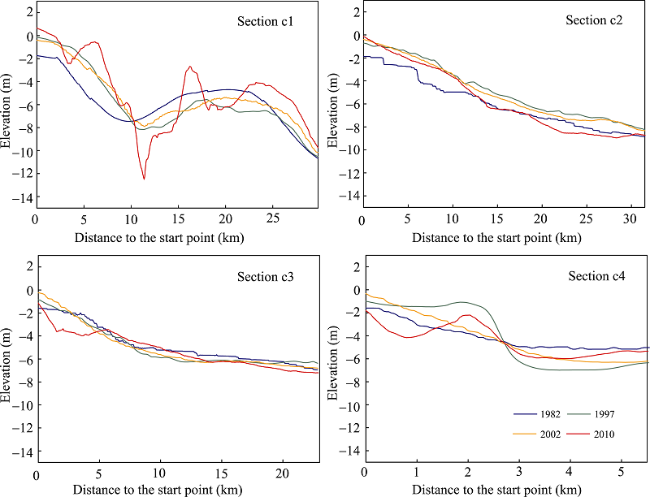
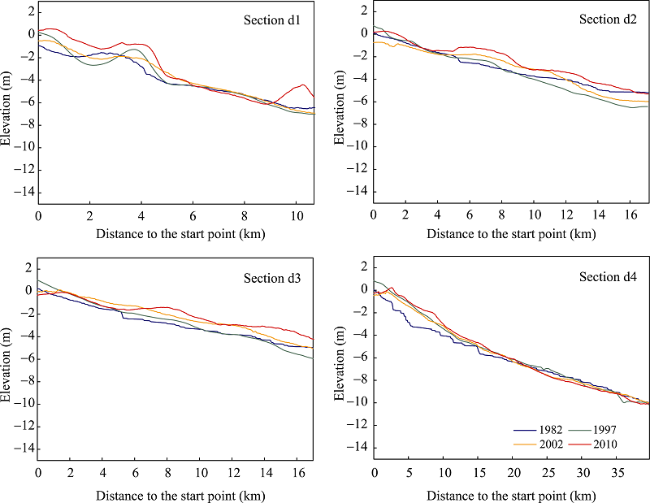
Figure 3 Cross-section variation for Chongming eastern wetland (CM) |
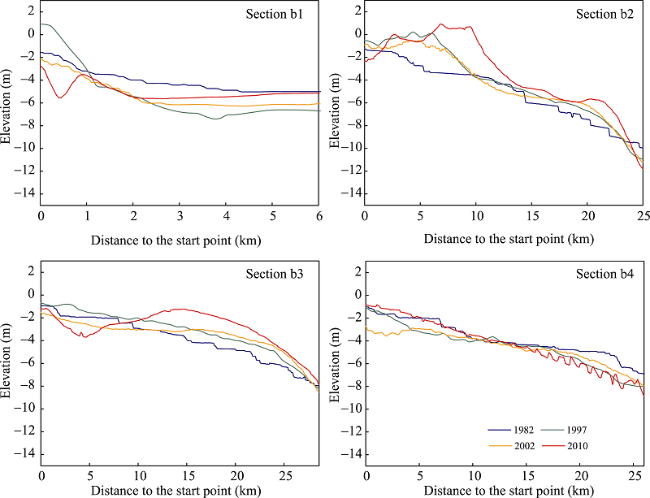
Figure 4 Cross-section variation for Hengsha shoal (HS) |
Figure 5 Cross-section variation for Jiuduansha wetland (JDS) |
Figure 6 Cross-sectional variation of the Nanhui eastern wetland (NH) |
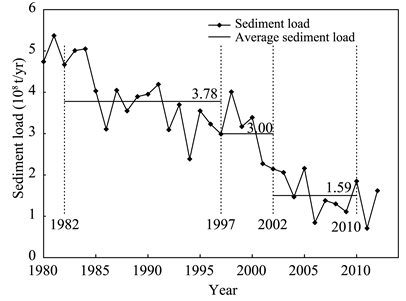
Figure 7 Records of annual sediment load from the Yangtze River at Datong (the farthest downstream station) during 1980-2012 |
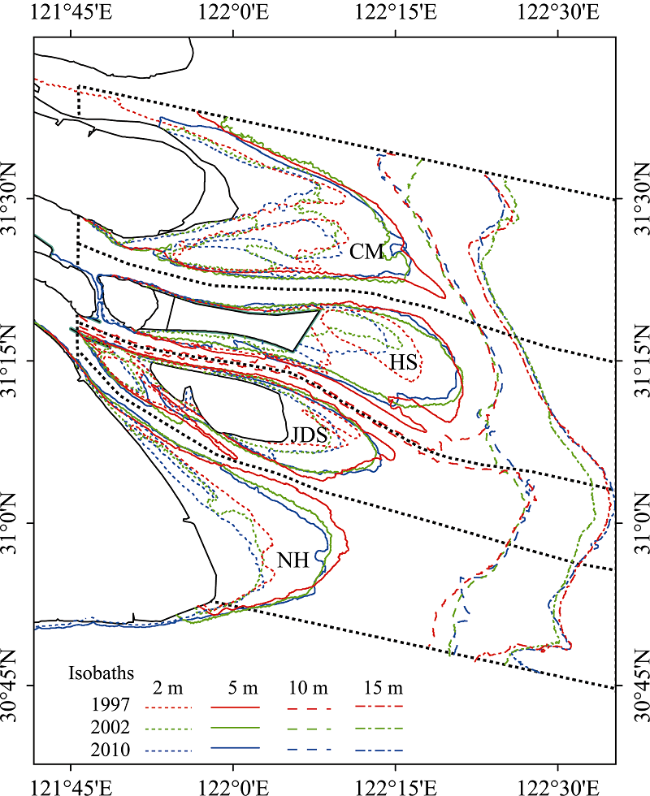
Figure 8 Zoning sketch of isobaths and the four important regions in the submerged delta |
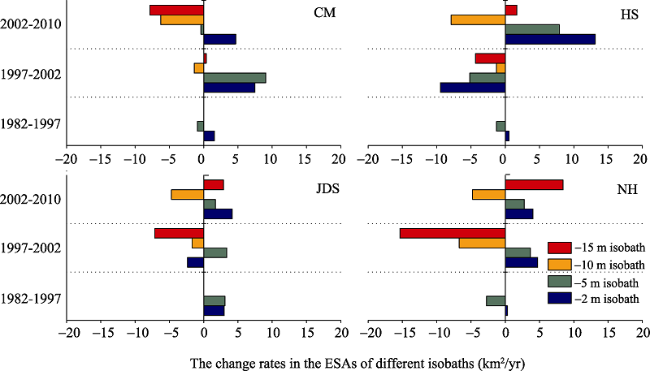
Figure 9 The change rates in the ESAs of different isobaths in different periods |
Table 3 Statistics for the ESA of different isobaths |
| Year | Total area (km2) | Change rate (km2/yr) | |||||
|---|---|---|---|---|---|---|---|
| 1982 | 1997 | 2002 | 2010 | 1982-1997 | 1997-2002 | 2002-2010 | |
| The area within 2 m isobath | 526.29 | 607.93 | 609.88 | 818.12 | 5.44 | 0.39 | 26.03 |
| The area within 5 m isobath | 1685.09 | 1657.73 | 1712.27 | 1808.22 | -1.82 | 10.91 | 11.99 |
| The area within 10 m isobath | / | 3938.22 | 3883.00 | 3693.94 | / | -11.04 | -23.63 |
| The area within 15 m isobath | / | 4856.77 | 4724.45 | 4765.91 | / | -26.46 | 5.18 |
The authors have declared that no competing interests exist.
| 1 |
|
| 2 |
|
| 3 |
|
| 4 |
|
| 5 |
|
| 6 |
|
| 7 |
|
| 8 |
|
| 9 |
|
| 10 |
|
| 11 |
|
| 12 |
|
| 13 |
|
| 14 |
|
| 15 |
|
| 16 |
|
| 17 |
|
| 18 |
|
| 19 |
|
| 20 |
|
| 21 |
|
| 22 |
|
| 23 |
|
| 24 |
|
| 25 |
|
| 26 |
|
| 27 |
|
| 28 |
|
| 29 |
|
| 30 |
|
| 31 |
|
| 32 |
|
| 33 |
|
| 34 |
|
| 35 |
|
| 36 |
|
| 37 |
|
/
| 〈 |
|
〉 |