Orginal Article

Spatial expansion and potential of construction land use in the Yangtze River Delta

  • WANG Zhenbo , 1, 2 ,
  • FANG Chuanglin , 1, 2, * ,
  • ZHANG Xiaorui 1, 3
Expand
  • 1. Institute of Geographic Sciences and Natural Resources Research, CAS, Beijing 100101, China
  • 2. Key Laboratory of Regional Sustainable Development Modeling, CAS, Beijing 100101, China
  • 3. Department of Urban Planning, Hefei University of Technology, Hefei 230009, China

*Corresponding author: Fang Chuanglin, Professor, E-mail:

Author: Wang Zhenbo (1980-), PhD, specialized in regional and urban planning. E-mail:

Received date: 2014-05-10

  Accepted date: 2014-09-30

  Online published: 2015-06-24

Supported by

National Natural Youth Science Foundation of China, No.41201168

Copyright

Journal of Geographical Sciences, All Rights Reserved

Abstract

Based on remote sensing data of the Yangtze River Delta (YRD) in the years of 1991, 2001 and 2008, the paper built an index system of land use potential restraint factors in YRD, according to geological condition, terrain condition, water area, natural reserve area and basic farmland, and evaluated construction land potential based on the platform of GIS spatial analysis model. The results showed that: (1) the construction land increased rapidly since 1991 and reached 24,951.21 km2 in 2008, or 21.27% of the total area. Among all the cities in the YRD, Shanghai took the greatest percentage, followed by Jiangsu and Zhejiang. Spatially, areas where government departments are located became the growth center of construction land. Prefecture-level cities were the fastest growth region and the changing trend showed circle layered characteristics and significant increase with Shanghai and Suzhou as the core. (2) The higher the quality of construction land potentials (CLP), the smaller the number of CLP units. High sensitive area accounted for the largest percentage (40.14%) among all types of constraint regions and this was followed by medium sensitive region (31.53%) of the whole region. (3) The comprehensive CLP in the YRD was 24,989.65 km2, or 21.76% of the total YRD. The land use potential showed spatial distribution imbalance. CLP of Zhejiang was obviously larger than that of Jiangsu. CLP was insufficient in regional central city. Moreover, CLP in the YRD formed a circle layered spatial pattern that increasingly expanded centered in prefecture-level cities. Low potential area expanded from north to south. High potential area was mainly located in south YRD. Areas with zero potential in the YRD formed a northwest-southeast “Y-shaped” spatial pattern in north Hangzhou Bay. (4) CLP per capita in YRD was 0.045 ha/person and also unevenly distributed. Some 25.57% of the study units at county level nearly had no construction land and 8.24% of the units had CLP per capita below the national average level. CLP per capita in less than 25% of the county-level units was larger than the YRD average level, which were mainly located in Zhejiang. Therefore, research on the construction potential area in YRD was favorable for analysis of the development status and potential space of this region under the background of rapid urbanization and industrialization.

Cite this article

WANG Zhenbo , FANG Chuanglin , ZHANG Xiaorui . Spatial expansion and potential of construction land use in the Yangtze River Delta[J]. Journal of Geographical Sciences, 2015 , 25(7) : 851 -864 . DOI: 10.1007/s11442-015-1206-7

1 Introduction

In view of the land use classification, the construction land use includes six subclasses which are land for urban construction, independent industrial and mining land, transportation land, rural residential area, land for water facilities, and specially designated land. Industrialization in China, which is unprecedented in history, will bring more than 720 million peasants to cities. Urbanization in China, which is considered as the greatest revolution in the 21st century, has significant value to sustainable development of the whole world.
However, rapid industrialization leads to tremendously growing demand and consumption of energy, it continuously occupies ecosystem such as the paddy field and rangeland, and also poses a threat to both food and ecological security in China. In China, there are abundant documentary sources recording land use change, the majority of existing studies focus on the following issues: the identification of the factors driving changes in construction land use (MacLeod et al., 2006; Rasul et al., 2004; Tzanopoulos et al., 2011), the temporo-spatial differentiation and patterns of urban land expansion based on GIS analysis system (Li et al., 2004; Wang et al., 2010; Su et al., 2011; Liu et al., 2007), urban construction land intensive use, land consolidation potential of rural residential area (Liang et al., 2002; Zong et al., 2007; Wu et al., 2007; Lin et al., 2007), and the productivity and efficiency of construction land use (Yeh et al., 1998; Lee et al., 2008). However, there are few studies on the issue of construction land potential and its spatial pattern at a relatively large scale from the perspective of regional sustainable development in China (Fan, 2007; Wang et al., 2012; Zhang et al., 2013). The majority of these studies are concentrated on the land use changes, although they have assessed the impact of these changes on the environment. Furthermore, most studies concentrate on land use change or on a specific land use type such as arable land in particular. With the initiation of the division of main-functional zones, the study on quantitative structure and spatial distribution characteristics of regional construction land has become a basic scholarly and policy issue. Xu et al. (2011) analyzed the potential of construction land in China at the macro level considering factors of geological condition, terrain condition, water area, natural reserve area, and farmland utilization status. This research has an important influence on academic study in this field. The Yangtze River Delta (YRD) is the fastest urbanization and industrialization region.
Since the 1980s, along with the realization of the economic goals and improvement of comprehensive strength, the construction lands expanded rapidly followed by a dramatic decrease of the potential construction lands (Deng et al., 2004). The intensity of the construction land use change is much higher than the average national level. Therefore several ecological problems have emerged, such as water area reduction, soil and water pollution, air pollution, and degradation of the biodiversity (Wang et al., 2013; Quan et al., 2007; Wu et al., 2006). On the basis of the research of Xu et al. (2011), and at the regional level, this paper concerns the CLP in the YRD, which is favorable to analysis of the development status and potential space of this region under the background of rapid urbanization and industrialization.

2 Methodology

2.1 Study area

The Yangtze River Delta (29°6′-34°22′N, 118°22′-122°7′E, 11.57×10⁴ km2), includes Shanghai, central-south Jiangsu Province and northern Zhejiang Province (Figure 1), one of China’s most developed, dynamic, densely populated and concentrated industrial regions, is growing into a world-class metropolitan area and playing an important role in China’s economic and social development. Meanwhile, the formation and the urbanization process of the YRD are closely related to LUCC, since the YRD is one of the most biologically diverse regions in the world being threatened by ongoing LUCC.
Figure 1 Land suitability zoning of the Yangtze River Delta

2.2 Data sources and remote-sensing data processing

This paper takes all the 90 counties (county level cities) and the downtown area of cities above-prefecture level as research units. The land-use data were derived from remote sensing images (Landsat TM, 30 m×30 m) processed by the Chinese Academy of Sciences. The dataset covered three periods from 1991 to 2008: October 1991, November 2001 and October 2008. The socio-economic data and urban planning data of research unit were derived from statistical yearbook and statistical communiqué. Radiometric correction, geometric correction, area estimation and other pre-processing should be conducted on remote sensing images for LUCC. Taking YRD topographic map (year 2001) as reference, the authors made geometric correction for the YRD remote sensing images in three different time points with the method of cubic polynomial, and reset check-point on the images to make the rectification error less than one pixel. Then, with the remote sensing images of year 2001 as reference basis and SCR (Scatter-gram Controlled Regression) as the processing method, they simplified the normalization of the YRD remote sensing images obtained in 1991 and 2008 in the form of linear regression. In accordance with National Land Classification (applicable for transitional area) and actual condition of research area, land uses in the YRD were classified into nine categories including grassland, woodland, garden land, swamp, dry land, urban land, paddy land, waters and others. After checking data of current actual land uses in the same period, we randomly selected several sample areas, calculated the samples’ classified error matrix and kappa coefficient for final accuracy test. It concluded that general classified accuracy degrees of the maps during three time phrases were 78.33%, 83.50% and 85.68% respectively, and kappa coefficient of each type of land use was higher than minimum discriminant criterion (70%). Classified precision may had uncertain effect on the calculation of related index, but it would have nothing to do with the expression of spatio-temporal differentiation feature (Tu et al., 2008). The research data for this study was then supplemented by the land use investigation data of Ministry of Land and Resources of China in 2000-2010. Maps needed for the calculation of construction land potential include digital topographic maps, land use maps, administrative maps at county level, geological maps, and protection zones maps. Map scale is determined 1:50,000 at county level. Digital raster graphics were obtained from the Digital Elevation Model (DEM) (30 m × 30 m). Both maps were converted to vector format using ArcGIS spatial analysis techniques.

2.3 Calculation process

2.3.1 Key factors
There are five main factors that affect the expansion of the land use for urban and rural areas: geological condition, topographic condition, water area, natural reserve and basic farmland.
(1) Geological condition. Construction land should steer clear of the plots where may cause potential geologic hazard, such as faults, potential source and debris flow, which could also cause fatal damage to surface buildings. Therefore, there should be a minimum of 1000-5000 m between new constructions sites and known faults.
(2) Topographic condition. The main factor that affects the location of construction land in YRD is slope of the region. The cost of engineering construction increases as the topographic gradient increases, and steep terrain is prone to landslides, mud-rock flows, and other geological phenomena. The division of topographic gradient is based on regional planning and architecture. Topographic gradient can be classified into five divisions: below 3° (flat) has no soil erosion and is suitable for urban construction; 3°-8° (slight slope) is relatively suitable for urban construction, but needs hybrid vertical design based on platforms and flatlands; 8°-15° (moderate slope) has moderate but not serious soil erosion; 15°-25° (abrupt slope) has relative serious soil erosion and is difficult to be used for urban construction; land above 25° (steep slope) cannot be used for urban construction, neither for transportation land and manufacturing plants. Moreover, land development in mountainous regions produces negative effect on local eco-environment (Fan, 2007).
(3) Water area. The main water area in YRD includes lake, reservoir and river. Water area has functions of flood discharging and healthy ecosystem maintaining, and this kind of area can be polluted due to urbanization and industrialization. Therefore, this paper divides the water area into major lakes, large reservoir, medium and small reservoir, first-order stream and the Grand Canal, second-order stream and the following. Moreover, this paper also sets the buffer of 150-4000 m.
(4) Protection zones. Protection zones include natural parks, scenic zones, forest parks and geological parks, among others. Each protection zone has explicit boundary, so construction land should be kept 1000 m away from these zones.
(5) Cultivated land. Among the current land use types, cultivated land is strictly controlled by the Chinese government and the conversion from cultivated land to construction land should comply with the policy of “cultivated land requisition-compensation balance.” Land policy for forestland and grassland tends to be more flexible and can be converted to construction land provided the strict process of policy permits is addressed. Most existing construction land types have the potential of increasing effective supply of construction land. The rural settlement land has the biggest potential, which is also the main source of land use intensification in the future (Xu et al., 2011).
2.3.2 Buffer and overlay analysis
Ar=Agr+Asr+Awr+Apr+Acr(1)
Agr=Afr+Ass+Adf (2)
Awr=Ala+Are+Ari(3)
Apr=Ana+Apr+Amu+Aco(4)
And:
Acr = Afs×β(5)
where Ar is the restricted area, including Agr, Asr, Awr, Apr, Acr, which could cause fatal damage to surface buildings, Agr is the geological restricted area, including fault risk zone, seismic source risk zone and debris flow risk zone; Asr is the slope restricted area; Awr is the area of water facilities land, including rivers, lakes and reservoirs; Apr is protection zones, including national nature reserve, provincial nature reserve, municipal-level nature reserve and county-level nature reserve; and Acr is the area of farmland in suitable construction region, ranges from 0.8 to 1. According to related research by Professor Xu Yong and given the ecosystem protection and food security status of YRD, this paper set the value of 0.85.
Table 1 The assessment index system of calculation of construction land potential
Factors Parameters and thresholds Statement of calculation
Geological condition Fault 1000 m away from the fault (d)
Seismic source 5000 m away from the seismic source (c)
Debris flow No (a), slight (b), moderately (c), severe (d),
extremely severe (e)
Topographic condition Slope <3° (a), 3°-8° (b), 10°-20° (c), 20°-25° (d), >25° (e)
Water area Important lake and large reservoir 1000 m (e), 2000 m (d), 4000 m (c)
Medium and small reservoir 200 m (d), 400 m (c), 800 m (b)
First class river and Grand Canal 200 m (e), 500 m (d), 1000 m (c)
Second class river 150 m (e), 300 m (d), 500 m (c)
The following river 150 m (c), 300 m (b)
Natural reserve National 1000 m (e)
Provincial 500 m (d)
Municipal 300 m (c)
County level 100 m (b)
Basic farmland Cultivated land area × 0.85(e)

Note: a is non-restricted area, b is low restricted area, c is medium restricted area, d is high restricted area, e is restricted area.

2.3.3 Calculation principle
Different types of restricted area have different construction potential. Non-restricted area is suitable for construction. Restricted area is not available for construction land use. The other three types of restricted areas could be used as construction land with different functions after transformed by various levels of engineering and protection measures. For example, low sensitive area could be transformed into land for public facilities. Medium sensitive area could be used as residential land after transformation. High sensitive area could be considered as ecological landscape land. Furthermore, different research units have different number and structure of each type of restricted areas. Therefore, the construction land should be defined as the total potential of each type of restricted area to become construction land except the current construction area. That is
Ac = Aka + Akb + Akc + Akd + Ake - Ae (6)
Acp=Ac/p(7)
where Ac is the construction land potential; Ae is the present area of construction land; k is the potential index of typical area, and ka=1, kb=0.8, kc=0.6, kd=0.4, and ke=0. The evaluating method is expert marking. Acp is the per capita construction land potential and P is the permanent resident population of the region.

3 Results and discussion

3.1 Changes of construction land

During 1991-2008 (abbr as 9108), great changes took place in construction land structure in YRD. In 1991, 2001 and 2008, the construction land in YRD was 4799.42 km2, 9332.92 km2, and 24,951.21 km2, respectively, which accounted for 4.18%, 8.13% and 21.72% of the total area. The construction land increased by 4533.5 km2 (3.92% of the total YRD) from 1991 to 2001, and 15,618.29 km2 (13.5% of the total YRD) between 2001 and 2008.
Then, after 10 years of development, the construction land in 2001 increased sharply to 9332.92 km2, which is 1.94 times of the area in 1991, accounting for 8.13% of the total YRD. The construction land area of the YRD took the proportion of 21.72% of the total area and reached 24,951.21 km2. This number is 2.67 times of the value in 1991 and 5.20 times of the value in 2001. The existing construction land intensity (the percentage of existing construction land in total land area) of China is 3.45%, which is calculated from the land use investigation data of Ministry of Land and Resources of China in 2008. This indicates that the proportion of construction land is much higher than the national average level. The increase of construction land in YRD has the following characteristics in space. (1)The construction area spread dramatically with the core of county seat and urban area. (2) Urban area of prefecture-level city is the most significant areas of construction land growth. (3) During the period of 1991 and 2001, the construction land area increased mainly in Shanghai and the area around the Taihu Lake. (4) In the period 0108 construction land expanded increasingly from Shanghai and the area around the Taihu Lake. In this period, the construction land extended northwestward to Nanjing, Zhenjiang and Yangzhou, and southward to Shaoxing and Ningbo. (5) The trend of construction land area change showed circle layered characteristics and significant increase of Shanghai and Suzhou in the period 9108 (Figure 2).
Figure 2 The construction land of YRD 1991, 2001 and 2008

3.2 Scenario analysis and spatial pattern of construction land potential

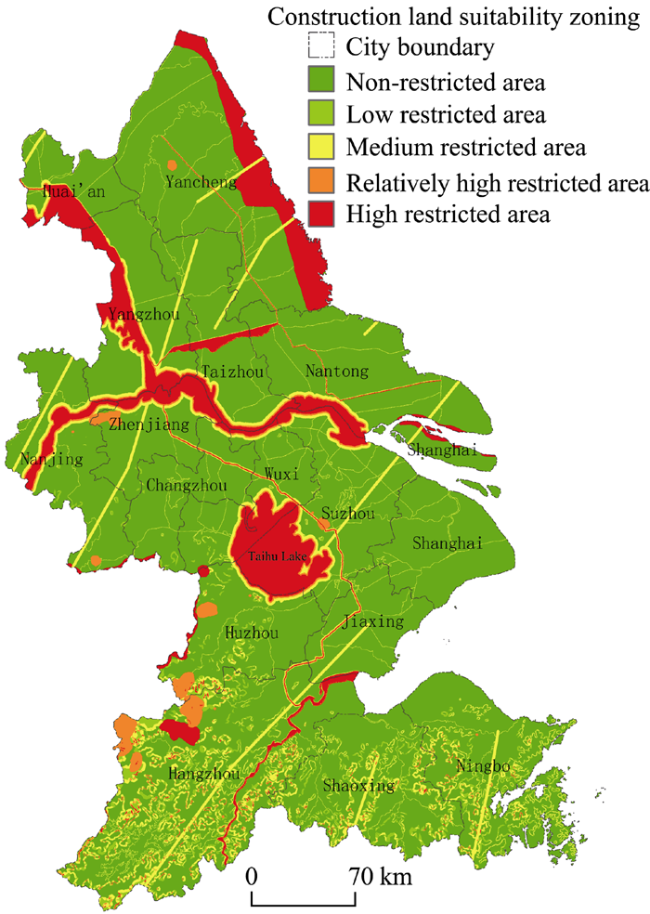
The suitable construction lands (SCL) in YRD were classified into six categories including grassland, woodland, gardenland, swamp, urban land and others. The area is 55,851.10 km2, accounting for 48.62% of the total area. Among which, the construction land area reached 24,951.21 km2 in 2008, accounting for 21.72% of the total YRD and 44.67% of the SCL.
3.2.1 Scenario analysis of construction land potential
The area of non-restricted area (a), low restricted area (b), medium restricted area (c), relatively high restricted area (d) and high restricted area (e) is 84,637.72 km2, 5280.31 km2, 9524.89 km2, 3278.84 km2 and 12,126.58 km2 respectively. The above types of lands account for about 73.68%, 4.60%, 8.29%, 2.85% and 10.56% of the YRD. Based on a, b, c, d and e restricted areas, this paper divided the potential of construction land in the YRD into four scenarios of CLP I, CLP II, CLP III and CLP IV. According to the size of CLP area of every county, they are all classified into seven criterions: 0, 0-100 km2, 100-200 km2, 200-300 km2, 300-400 km2, 400-500 km2, 500-1000 km2, and above 1000 km2. Meanwhile, measured by CLP percentage in county area, CLPI, CLPII, CLPIII and CLPIV are divided into seven criterions: 0, 0-10%, 10%-20%, 20%-30%, 30%-40%, 40%-50%, and 50%-100%. In terms of the number of counties in different criterions, the higher the quality of CLP is, the smaller the area of CLP and the percentage in county area are. The proportions show the area of CLP I and CLP III is larger than that of CLP IV and CLP II. And there exists significant regional imbalance in YRD CLP.
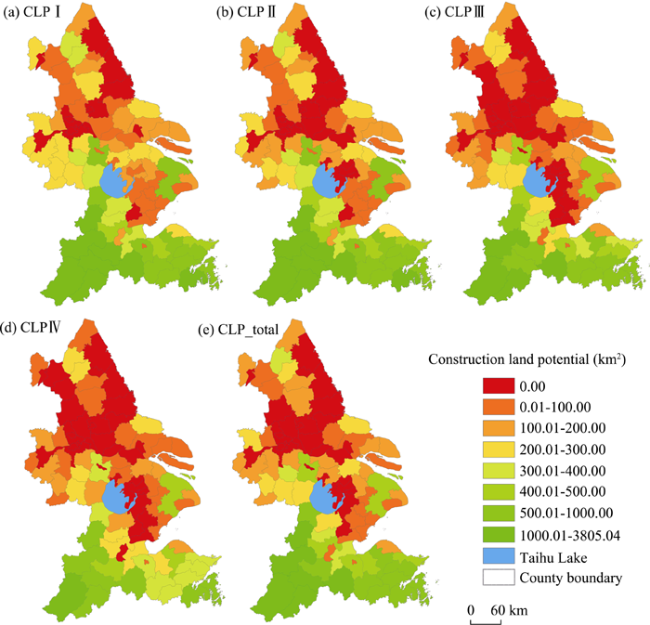
CLP I has the largest area and maximum size of potential construction lands and it is defined as the study area minus the high restricted area in this paper. The area of CLP I is 30,899.90 km2, which accounts for 26.90% and 55.33% of YRD and SCL respectively. The average CLP of county and city is 339.56 km2 and 1931.24 km2 respectively, but 14 counties have no CLP, which are distributed mainly in Nanjing, Yangzhou and coastal area of Jiangsu.
CLP II equals the total area minus high and relative high restricted area. The area reaches 28,089.24 km2 which takes 24.45% and 50.29% of the YRD and SCL respectively. The average CLP of counties is 308.67 km2, meanwhile the average CLP of cities is 1726.32 km2, all of which is less than that of CLP I. There are 20 counties without CLP, and distributed mainly in Yangtze riverside area, coastal area and the eastern plain to the Taihu Lake.
CLP III refers to the total area except the high, relatively high and medium restricted area. The area is 19,037.36 km2 which takes 16.57% and 34.09% of the YRD and SCL respectively. The average CLP of 91 study units at county level is 227.77 km2 which is 80.90 km2 smaller than CLP II, moreover which of the cities is 1189.84 km2 which is 546.39 km2 smaller than CLP II. The number of units without CLP increases too, and there are 4 cities of Suzhou, Taizhou, Zhenjiang and Yangzhou, and 29 counties without CLP, with a range being expanded to central Jiangsu and north of Zhejiang.
CLP IV only includes the non-restricted area and represents the least area and highest quality of potential construction lands. The area is 15,710.81 km2, which accounts for 13.68% and 28.13% of the YRD and SCL, respectively. The average CLP of counties is 227.77 km2 which is 110.89 km2 smaller than that of CLP III, and which of the cities is 879.28 km2 which is 310.56 km2 smaller than CLP III. Besides Suzhou, Taizhou, Zhenjiang and Yangzhou, two more cities (Huai’an and Jiaxing) and 31 counties have no CLP, and the range of the area without CLP have expanded to northern Jiangsu and Zhejiang. The city with largest CLP changing from Hangzhou to Ningbo represents that the CLP III takes great proportion of SCL (Table 3 and Figure 3).
3.2.2 Construction land potential of YRD
According to equation (6), the potential construction land in YRD is 24,989.65 km2 which accounts for 21.76% and 44.74% of the total YRD and SCL (Figure 3 and Table 3).
Based on the result of county level research, the average CLP is 274.61 km2, and there are 26 counties without CLP. The number of counties with CLP 0-300 km2, 300-500 km2, 500-1000 km2, and above 1000 km2 are 40, 10, 9, and 6 respectively. For each of the four CLP intervals above, the proportions to the YRD is 22.11%, 15.76%, 24.75%, and 38.43%. The average CLP proportion of the counties is 17.30%. Besides the 26 counties without CLP, the number of counties at 0-10%, 10%-20%, 20%-30%, 30%-40%, 40%-50% and >50% intervals is 14, 21, 10, 6, 5 and 9, respectively, and 43.96% of the counties have CLP proportion lower than 10%, meanwhile 67.03% of the counties lower than 20% and only 9.89% larger than 50%.
On the cities level, the average CLP of cities is 1561.85 km2. There are 5 cities with CLP less than 500 km2, 6 cities’ CLP between 500 and 1000 km2 and 5 cities’ CLP above1000 km2. Each interval accounts for 3.77%, 17.21%, 24.75%, and 79.02% of the YRD. Hangzhou, Ningbo and Shaoxing take up 65.75% of the CLP in the YRD. This shows great space unbalance. Sixteen cities’ average CLP proportion reaches 16.55% with Hangzhou shares the largest percentage of 48.61%. There are 4 cities’ proportions larger than 30%, 9 less than 10%, and 12 less than 20%. Cities which have less than 10% of CLP value account for 56.25% of the number of the YRD cities.
According to the research at the province level, 10 cities in Jiangsu take up about 21.25% of the CLP in the YRD, the average CLP proportion is 7.81%. There are 5 cities in Zhejiang that account for 67.26% of the CLP in the YRD and the average cities area proportion is 35.04%. Shanghai takes 11.22% of CLP and the average cities percentage is 11.64%. Based on the proportions above, most of the potential construction lands are located in Zhejiang.
Table 2 The characteristics of construction land potential in different scenarios
Figure 3 The construction land potential of various zonings of the Yangtze River Delta
3.2.3 Spatial pattern of construction land potential
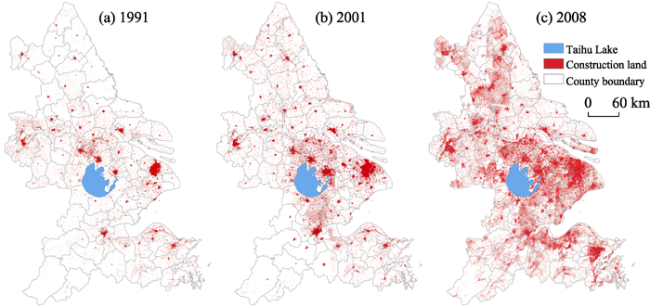
The spatial pattern of YRD’s existing construction land intensity has been formed by YRD’s physical geography and China’s long-term regional development policies. The spatial pattern of the CLP in the YRD has the following features: Firstly, there exists significant regional imbalance in the YRD’s CLP. On the one hand, the CLP space is unevenly distributed. Zhejiang and Jiangsu is the main body of south and north YRD respectively. According to the proportion of CLP, south YRD’s CLP is much larger than north YRD. On the other hand, the CLP space is also imbalance in the administrative level. Regional central cities are seriously lack of CLP. Based on the study result, taking regional center cities as the main body of the region, there are 66 counties with CLP less than 500 km2 and the area of CLP only accounting for 22.11% of YRD CLP. Secondly, CLP in all the prefecture-level cities and Shanghai only takes 15.05% of YRD CLP. Thirdly, the potential construction land in YRD presents circle layered spatial pattern that gradually increasing from the core of prefecture-level cities to outlying regions. Fourthly, based on CLP I-CLP II-CLP III-CLP IV, with the quality upgrade of CLP, low potential region expands from north to south while the high potential region narrowing down correspondingly to the south area. Fifthly, the region without CLP of YRD has formed a “Y-shaped” spatial distribution pattern.
The reasons for the forming of the spatial pattern is mainly due to the following:
First, the terrain of north YRD is more flat than south YRD and the north YRD is the fluvial plain of the Yellow River. Huaihe River and Yangtze River basins (especially the flatlands and coastal areas) are the most suitable regions for human residences. Second, since 1978 south Jiangsu (Sunan) has the foundation and tradition of engaging in collective economic development. This region has formed an endogenous growth model of “Sunan pattern” encouraging township enterprises development in order to stimulate industrialization. “Sunan pattern” promoted the expansion of local construction land. Third, the radiation of Shanghai and excellent transportation condition also accelerates the rapid development of south Jiangsu. Fourth, Wenzhou (Zhejiang) pattern in south YRD is completely different from “Sunan pattern”. Wenzhou pattern adopts exogenous growth model that relies on family industry and external professional market development and this kind of growth pattern makes little contribution to the increase of construction land.

3.3 Quantity and spatial pattern of construction land potential per capita

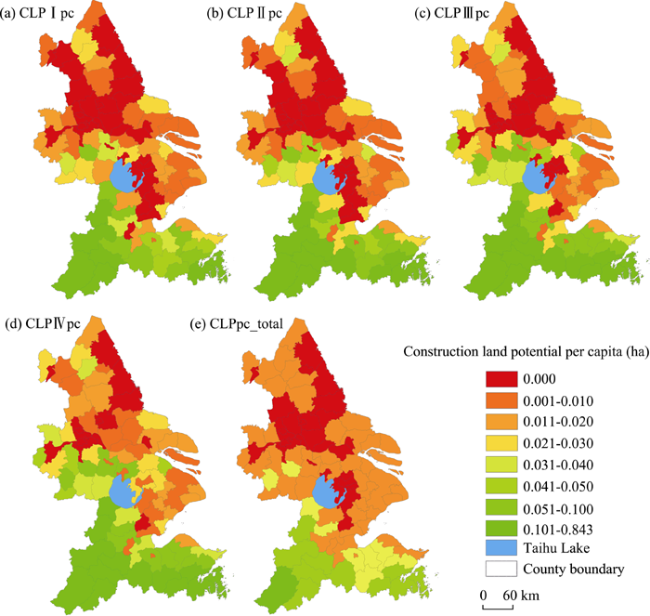
County-level research shows that the CLP per capita of YRD is 0.045 ha/person. This is 0.021 ha/person larger than national average construction potential (Xu et al. 2011). There are 26 counties with zero CLP in Jiangsu and most of them are located in south Jiangsu, including 10 districts directly under cities and 16 counties. There are 45 counties with average CLP less than 0.05 ha/person, 9 counties between 0.05 and 0.1 ha/person and 10 counties in Zhejiang between 0.1 and 0.3 ha/person. The largest average CLP is 1.71 ha/person in Chun’an county. From this point of view, 28.57% of the counties in YRD, which account for 23.04% of the YRD, already have zero CLP. Some 58.24% of the units’ average CLP is below the national average and these units take 50.27% of the total YRD. Furthermore, 75.82% of the counties’ average CLP is below the YRD average level and takes 67.13% of the YRD. Therefore, the average CLP of counties is unevenly distributed and there are less than 25% of the counties (mainly in Zhejiang, except Wujin, Lishui and Jintan city) reaching the average CLP in the YRD.
With regard to the prefecture city, the average CLP per capita of 16 prefecture cities is 0.043 ha/person and Hangzhou has the largest value of 0.25 ha/person, Taizhou has the smallest value of 0.002 ha/person. There are 12 cities with average CLP per capita values less than 0.05 ha/person, and the values of Taizhou, Yangzhou, Jiaxing, Nantong and Zhenjiang are less than 0.01 ha/person each. Seven cities’ (Shanghai, Suzhou, Yancheng, Huaian, Wuxi, Nanjing and Changzhou) CLP per capita values are between 0.01 and 0.03 ha/person. CLP per capita values are more than 0.05 ha/person in Shaoxing (0.08), Ningbo (0.09), Huzhou (1.11), and Hangzhou (0.25), and 80% of the cities in YRD have CLP per capita less than 0.03 ha/person and only 2 cities’ average CLP are more than 0.1 ha/person. The average CLP of 16 district cities is 1.37 times of current area per capita. Among the 16 cities, the average CLP of 9 cities (Taizhou, Yangzhou, Jiaxing, Suzhou, Zhenjiang, Shanghai, Yancheng, Wuxi and Huai’an) is less than 62% of current area per capita. Other 7 cities’ average CLP is more than twice as large as current area per capita value. Hangzhou has the largest CLP, which is 8.06 times of current area per capita value. CLP values of Ningbo, Shaoxing and Huzhou are between two and three times larger than current area per capita. Thus, the CLP per capita values vary a lot among different cities and are unevenly distributed in south and north area in YRD.
From the research of province level, 10 cities in Jiangsu have average CLP per capita of 0.014 ha/person which is less than the national and YRD average CLP value. Eight cities’ CLP per capita are below the national average level except Nanjing and Changzhou. CLP per capita in Shanghai is 0.01 ha/person which is smaller than Jiangsu. The average CLP per capita of 5 cities in Zhejiang is 0.106 ha/person and this is higher than both the national and YRD average CLP level. From the above number, Zhejiang has the highest potential construction land compared with Jiangsu plate and Shanghai (Figure 4).
Figure 4 The construction land potential per capita of various zonings of YRD

4 Discussion

By referring to methods of ecological sensitivity analysis, merge statistics, RS and GIS, this paper builds potential analysis model of construction land based on former studies. It analyzes the construction land potential in the forefront area (YRD) of urbanization and industrialization in China and provides constructive suggestions to the practical issues of the YRD development and protection.
(1) By using the construction land use potential as research subject, this paper constructs and perfects the construction land use potential assessment index system (including geological, landform, territorial waters, nature protected area, and basic farmland assessment index system) of drainage basins. This paper improves the dichotomy of construction land potential assessment index system and uses multiple types of land weighted assessment index method. The construction land potential in basin spatial development can be evaluated more precisely than conventional method.
(2) The construction land area in YRD has increased dramatically since 1991 and reached 24,951.21 km2 in 2008, which is 3.45% higher than national average level. The county-level construction land area has also increased sharply and reached 26.88% in 2008 compared with 20.07% in 1991. Shanghai has the highest CLP at the province level followed by Jiangsu and Zhejiang. In space, each level of government becomes the gathering center of construction land area and prefecture-level cities are the most significant growing area for construction land. Since 1991, Shanghai and the Taihu Lake Plain has become the core of rapid growing construction land area. The area expanded fast and formed circle layered structure taking Shanghai and Suzhou as the core center.
(3) The CLP of YRD can be divided into four scenarios of CLP I, CLP II, CLP III, and CLP IV based on diffident restricted areas of the study units. CLP I is the potential rating for the largest area and maximum size of construction lands potential. CLP IV is the potential rating for the minimum size and highest quality of construction lands. This study shows that the size of the CLP in study units decreased dramatically with the improvement of CLP quality. High restricted area takes the largest proportion (40.14%) in all types of restricted areas followed by the medium restricted area which accounts for 31.53%. This indicates that only 13.68% of the YRD can be constructed directly, and the rest of the land must be reclaimed in order to be utilized.
(4) The comprehensive CLP of YRD is 24,989.65 km2 which takes 21.76% of the YRD. The average county-level CLP is 274.6 km2 and 26 counties have no CLP. Meanwhile the cityl-level average CLP proportion is 16.55% with their geographical location of CLP in the YRD is mainly found in Zhejiang. The spatial pattern of the CLP in the YRD has the following features: first, there exists significant regional imbalance in the YRD’s CLP, reflected in uneven spatial distribution. Second, spatial distribution imbalance occurs at the administrative level. Regional central cities are seriously lack of CLP. Third, CLP in YRD forms a circle layered spatial pattern that expands increasingly from the prefecture-level cities as the core area to outlying regions. Fourth, low potential area expands from north to south with the improvement of CLP quality. High potential area is mainly located in the south YRD. Fifth, areas without CLP in the YRD have formed a northwest-southeast direction “Y-shaped” spatial pattern in north Hangzhou Bay.
(5) CLP per capita in the YRD is 0.045 ha/person and is also unevenly distributed spatially. Some 25.57% of counties have no CLP and 58.24% of the counties have CLP per capita below the national average level. Less than 25% of the counties have CLP per capita values larger than the YRD average level and these units are mainly located in Zhejiang.
(6) Last but not least, the limitation of this paper is that it uses farmland area × 0.85 to replace basic farmland preservation area data. Therefore, it cannot provide specific spatial orientation of potential construction land. Moreover, the mechanism and development of different types of lands (such as sensitive area or area that is forbidden to construct) in 1991, 2001 and 2008 will be the study center for further research.

The authors have declared that no competing interests exist.

1
Deng F F, Huang Y, 2004. Uneven land reform and urban sprawl in China: The case of Beijing.Progress in Planning, 61: 211-236.

2
Fan Jie, 2007. The scientific foundation of Major Function Oriented Zoning in China.Acta Geographica Sinica, 62(4): 515-531. (in Chinese)

3
Lee C L, Huang S L, Chan S L, 2008. Biophysical and system approaches for simulating land-use change.Landscape and Urban Planning, 86: 187-203.

4
Li Xia, Yeh A G O, 2004. Analyzing spatial restructuring of land use patterns in a fast growing region using remote sensing and GIS.Landscape and Urban Planning, 69: 335-354.

5
Liang Liuke, Chang Jiang, Wu Cifanget al., 2002. A study on land system innovations in the construction of small towns in China.Chinese Geographical Science, 12(1): 81-86.

6
Lin Jian, Li Yao, 2007. Study on land consolidation potential of rural residential area in Beijing.China Land Science, (1): 59-65.

7
Liu Yong, Lv Xiaojian, Qin Xiaoshenget al., 2007. An integrated GIS-based analysis system for land-use management of lake areas in urban fringe.Landscape and Urban Planning, 82: 233-246.

8
MacLeod C J, Moller H, 2006. Intensification and diversification of New Zealand agriculture since 1960: An evaluation of current indicators of land use change. Agriculture, Ecosystems and Environment, 115: 201-218.

9
Quan B, Zhu H, Romkens M J, 2007. Land suitability assessment and land use change in Fujian Province, China. Pedosphere, 17: 493-504.

10
Rasul G, Thapa G B, Zoebisch M A, 2004. Determinants of land-use changes in the Chittagong Hill tracts of Bangladesh.Applied Geography, 24: 217-240.

11
Su Changhong, Fu Bojie, Lu Yiheet al., 2011. Land use change and anthropogenic driving forces: A case study in Yanhe River Basin.Chinese Geographical Science, 21(5): 587-599. (in Chinese)

12
Tu Xiaosong, Pu Lijie, 2008. Spatio-temporal pattern of land use change and its eco-environmental response in Suzhou-Wuxi-Changzhou Region.Geographical Research, 27(3): 584-594. (in Chinese)

13
Tzanopoulos J, Vogiatzakis I N, 2011. Processes and patterns of landscape change on a small Aegean island: The case of Sifnos, Greece.Landscape and Urban Planning, 99: 58-64.

14
Wang Hongrui, Gao Yuanyuan, Liu Qionget al., 2010. Land use allocation based on interval multi-objective linear programming model: A case study of Pi County in Sichuan Province. Chinese Geographical Science, 20(2): 176-183.

15
Wang Zhenbo, Fang Chuanglin, Xu Jian’ganget al., 2012. Study on spatial development division of Huaihe River Basin.Geographical Research, 31(8): 1387-1398. (in Chinese)

16
Wang Zhenbo, Fang Chuanglin, Cheng Shaowenet al., 2013. Evolution of coordination degree of eco-economic system and early-warning in rapid urbanization region of Yangtze River Delta. Journal of Geographical Sciences, 23(1): 1-16.

17
Wu Yuling, Qu Futian, 2007. Mechanism of intensive urban land use in China: Theoretical and practical study.Resources Science, 29(6): 106-112. (in Chinese)

18
Wu Yingmei, Su Yufang, Zhang Lei, 2006. Economic structure transformation and land use change of the Changjiang River Basin.Chinese Geographical Science, 16(4): 289-293.

19
Xu Yong, Tang Qing, Fan Jieet al., 2011. Assessing construction land potential and its spatial pattern in China.Landscape and Urban Planning, 103(2): 207-216.

20
Yeh A G O, Li X, 1998. Sustainable land development model for rapid growth areas using GIS.International Journal of Geographical Information Science, 12: 169-189.

21
Zhang Xiaorui, Fang Chuanglin, Wang Zhenboet al., 2013. Urban construction land suitability evaluation based on improved multi-criteria evaluation based on GIS (MCE-GIS): Case of new Hefei City, China. Chinese Geographical Science, 23(6): 740‒753.

22
Zong Yueguang, Wang Rong, Wang Chengganget al., 2007. Ecological suitability assessment on land use based on potential-constrain approach: The case of urbanized areas in Dalian city, China. Geographical Research, 26(6): 1117‒1127. (in Chinese)

Outlines

/