Orginal Article

Does cultivated land function transition occur in China?

  • SONG Xiaoqing , 1 ,
  • HUANG Yuan 1 ,
  • WU Zhifeng , 1, * ,
  • OUYANG Zhu 2
Expand
  • 1. Institute of Land Resources and Urban-Rural Planning, College of Geographical Sciences, Guangzhou University, Guangzhou 510006, China
  • 2. Key Laboratory of Ecosystem Network Observation and Modeling, Institute of Geographic Sciences and Natural Resources Research, CAS, Beijing 100101, China

*Corresponding author: Wu Zhifeng, Professor, E-mail:

Author: Song Xiaoqing, PhD, specialized in land use change and multifunctional land management. E-mail:

Received date: 2015-02-12

  Accepted date: 2015-03-20

  Online published: 2015-06-24

Supported by

National Natural Science Foundation of China, No.41401191

Guangdong Natural Science Foundation, No.S2013010014526

The Ministry of Education, Humanities and Social Science Planning Project, No.13YJA790074

Guangzhou Municipal Collaborative Research Fund of Science and Technology, No.2012J5100044

Science Research Program of Universities and Colleges in Guangzhou, No.1201430923

Copyright

Journal of Geographical Sciences, All Rights Reserved

Abstract

Land function change has been the focus of scientific research and policy making worldwide. Agricultural development and land use demand at present in China shared common characteristics with the countries such as Japan, South Korea, USA, and European developed countries, which have undergone cultivated land function transition. Whether cultivated land function transition occurred is of significance for land change science and cultivated land protection in China. However, there has been no explicit methodology for cultivated land function change research. This paper firstly presents a methodology by integrating policy development analysis based on the normative connotation of cultivated land function or termed cultivated land function demand and quantitative assessment based on the positive connotation of cultivated land function or termed cultivated land function supply. Then, cultivated land function transition is diagnosed by analyzing cultivated land function change in 1949-2012. Results show that cultivated land function transition overall occurred in 2006. Specifically, the normative cultivated land function or cultivated land function demand fragmented into seven types in 1985 and upgraded in 2004. Total value of the positive cultivated land function or cultivated land function supply turned to rise with an increase from 2.40 to 2.45 as the coefficients of variability (CV) of the value of the seven functions decreased from 2.94 to 2.29 in 2006-2012. The two-year gap between these two aspects of transition mainly resulted from the time lag effects of policy implementation. In the process of the transition, co-ordination and malposition of supply and demand of cultivated land function coexisted with supply lag and function morphology distortion. Considering the transition experiences in the developed countries mentioned above, suggestions on multifunctional cultivated land management are proposed. Moreover, route of land use transition research is discussed.

Cite this article

SONG Xiaoqing , HUANG Yuan , WU Zhifeng , OUYANG Zhu . Does cultivated land function transition occur in China?[J]. Journal of Geographical Sciences, 2015 , 25(7) : 817 -835 . DOI: 10.1007/s11442-015-1204-9

1 Introduction

Land use transition referring to land use morphology change from one state to another one, has been a new paradigm for understanding human-environment relationship (Lambin and Meyfroidt, 2010). From the perspective of pattern analysis, forest transition (Bae et al., 2012; Grainger, 1995; Mather et al., 1999; Mather and Needle 1998; Meyfroidt and Lambin, 2009; Rudel et al., 2005; Yeo and Huang, 2013) and rural housing land transition (Long et al., 2007) have been discussed world widely. All of these studies confirmed that land use pattern transition could be regulated by land use policies, which are determined by perceptions of land function (Zube, 1987). Moreover, change in land use pattern interacts with land function change (GLP, 2005; Lambin and Meyfroidt, 2010). So far, however, few studies on land function transition, especially on cultivated land function transition have been made.
Cultivated land function originated from a land use individual or a social group varies with land use perception and market demand. To a social group, formation of cultivated land function is dominated by top-down system supply or bottom-up market demand. Cultivated land function originated from the former route is mandatory and unified, while which originated from the latter route is inductive and diversified. Accordingly, cultivated land function change from the former route to the latter route means cultivated land function transition. From this point of view, cultivated land function changes in Japan, South Korea, USA, and European developed countries shared a common experience of transition. Specifically, cultivated land function targeted on food production was dominated by top-down system supply in the early stage of urbanization. With the rapid development of urbanization, non-commodity production functions of cultivated land dominated by bottom-up market demand gradually became visible, such as ecological regulation functions and information functions involving aesthetic information, recreation, cultural information, spiritual and historic information, science and education (de Groot et al., 2002). Moreover, contributions of cultivated land function to ecosystem management, agricultural development and farmers’ income were incorporated into policy-making to encourage farmers to participate in multifunctional cultivated land management (Boody et al., 2005; Brouwer and Heide, 2009; Deelstra et al., 2001; Jongeneel et al., 2008; Matsuno et al., 2006).
Social and economic system development in China at first was shown as the top-down mandatory system supply. Since the reform and opening up, China has proposed a step-by-step transition from planned economy to market economic system. The early 21st century witnessed market economic system improvement and rapid urbanization. Farmers’ cultivated land use willingness led by the increasing market demands became the key influencing factors of cultivated land function change (Liu and Li, 2006; Tian et al., 2009; Song et al., 2012). In the meanwhile, a series of benefited farming policies was implemented to motivate farmers’ willingness. That is, agricultural development and land use demand at present in China shared common characteristics with the developed countries mentioned above which have undergone cultivated land function transition. Here comes the question: does cultivated land function transition occur in China?
Our study aims to provide a basis for policy-making of multifunctional cultivated land management in China and to present a new perspective of cultivated land function analysis. Firstly, analysis framework and measure methods of cultivated land function change will be established. Then, cultivated land function change since 1949 will be analyzed.

2 Methodology

2.1 Connotation of cultivated land function

From the perspective of human need, cultivated land is entrusted with fulfilling certain function in society. Cultivated land function could be interpreted as the role assigned to cultivated land by human’s perception or land use policies. This view can be termed the normative connotation of cultivated land function or cultivated land function demand. The second way of interpreting cultivated land function is in terms of the results or effects of cultivated land use. These results or effects are the outputs of agricultural production based on the ecological conditions and processes in cultivated ecosystem. This is the positive connotation of cultivated land function or cultivated land function supply, which could be regarded as a characteristic of land use activity (OECD, 2001). Moreover, these two aspects of connotation have an inherent relationship involving policy assessment and improvement towards cultivated land use regulation (Song and Ouyang, 2012a; Song and Ouyang, 2012b).

2.2 Research route of cultivated land function change

Based on the connotations above, two research routes of cultivated land function change could be deduced. One is first to assign multiple functions to cultivated land according to anticipated human need or land use policies. Then, change in these assigned cultivated land functions could be measured through scenario simulation using land use models such as the CLUE-s model, the cellular automata model and multi-agent model (Koomen et al., 2007). This research route aims at predicting cultivated land function change and cultivated land use policy orientation, thus it belongs to ex-ante impact assessment. The other route is first to deduce the evolving process of type, meaning and intensity of the normative cultivated land function or cultivated land function demand according to land use policy development. After establishing the measuring indices based on the deduced type and meaning, intensity change in the positive cultivated land function or cultivated land function supply could be assessed. Then, policy implications could be made by comparing the deduced and the assessment results of cultivated land function intensity. The key role of this research route is to evaluate the performance of previous land use policies. Thus, this research route belongs to ex-post impact assessment. In this study, the latter research route has been used to diagnose whether cultivated land function transition occurred in China.

2.3 Methods of cultivated land function change assessment

2.3.1 Analysis according to policy development
Policies involving rural development, agricultural economy, land use planning and management, and environmental protection are closely related to cultivated land use. We first collect and analyze these policies since 1949. Specifically, classification of cultivated land function could be deduced based on the backgrounds, contents and purposes of these policies. Cultivated land function types vary among cultivated land use stakeholders because of their different needs. Especially, the central government’s need on cultivated land is distinguished from that of farmers’. These two kinds of need have significant effects on cultivated land function change (Liu and Li, 2006; Tian et al., 2009; Song et al., 2012). That is, making a distinction between government and farmers is of essential importance for deducing classification of cultivated land function. Cultivated land function intensity could be deduced from the importance of these policies and their specific contents related to cultivated land use.
2.3.2 Quantitative assessment
Diversity of cultivated land function decides complexity of cultivated land function assessment. Moreover, cultivated land function intensity is sensitive to the weights of indices. We need to adopt a scientific and objective weighting method to reveal cultivated land function change. Entropy weight model is an effective tool to scientifically and objectively deal with complex system assessment, and has been extensively used in land evaluation (Liu et al., 2011; Song et al., 2007). We use this model to assess cultivated land function change:
where E is the value of cultivated land function; w is the entropy weight of an index; Xij is the standardized value of index j in the year i; gi is the differential coefficient of index j; ej is the entropy value of index j; n is the years of the study period.

3 Data

Time-series data was constructed based on cultivated land area, agricultural production inputs and socio-economic data. The time dimension covered is the 28-year period from 1985 to 2012.

3.1 Cultivated land area

Land use data in 1996 from the first detailed land survey reflected the real cultivated land area (Lin and Ho, 2003). The Ministry of Land and Resources released yearly land use change survey data based on the detailed survey data after 1996 using remote sensing monitoring. Thus, cultivated land area after 1996 are credible and could be taken from China Land and Resources Statistical Yearbook. However, cultivated land area in 1949-1995 released by the government was controversial. To reveal the real cultivated land use change, Bi and Zhen reconstructed cultivated land area between 1949 and the 1980s using historical report information, land use reconnaissance data and remote sensing monitoring results (Bi and Zheng, 2000). In addition, Feng et al reconstructed cultivated land area in 1949-1995 based on the actual statistical data released by the Ministry of Agriculture and the first detailed land survey data (Feng et al., 2005). These two reconstructed data were coincided and acknowledged for reflecting the real cultivated land use change (Song and Wu, 2013). Here, we use the reconstructed cultivated land area to assess cultivated land function before 1996.

3.2 Agricultural production inputs

Agricultural production inputs include chemical fertilizer (converted into purified), total power of agricultural machinery, total sown area of farm crops, sown area of each farm crop, grain output. These data are taken from China Agriculture Yearbook.

3.3 Socio-economic data

Added value of farming and of agriculture are taken from China Rural Statistics Yearbook. Population, GDP, per capita disposable income of urban households, per capita net income of rural households, the registered urban unemployment rate, per capita food expenditure of rural households, Engel coefficient of rural households, railway and highway mileages, grain consumption price index and cash expenditure of grain consumption per capita of rural households are taken from China Statistics Yearbook. Grain production price index is taken from China Yearbook of Agricultural Price Survey.

4 Results

4.1 Cultivated land function change according to policy development

The evolving cultivated land function conforming to the normative connotation or termed cultivated land function demand in 1949-2012 was deduced using the method in section 2.3.1 (Table 1). As shown in Figure 1, cultivated land function fragmented into 7 types including food security guarantee function, social harmony guarantee function, living insurance function, employment sheltered function, national economy contribution function, rural household economy contribution function and ecological safety maintenance function. Food quality and safety became visible in food security guarantee function after 1991. In the meanwhile, national economy contribution function shifted from achieving primitive accumulation of capital for industrialization to consolidate agricultural base for ensuring sustainable development. As employment sheltered function overtaking living insurance function, ecological safety maintenance function, social harmony guarantee function and rural household economy contribution function reinforced rapidly after 2000. Food quality and safety became the focus of food security guarantee function after 2004. In the meanwhile, human and environment harmony and landscape effects were emphasized in ecological safety maintenance function. Moreover, social harmony guarantee function overtook ecological safety maintenance function as rural household economy contribution function rapidly strengthened. It implies that cultivated land function upgraded in 2004 as cultivated land use deeply combined with socio-economic development and demands of urban and rural residents.

4.2 Cultivated land function change based on quantitative assessment

According to the connotation deduced in Table 1, assessment index system (Table 2) was established considering data availability and suggestion proposed by the experts from the fields involving land use, agricultural economics, landscape ecology, physical geography and regional development. Noteworthy is that fragmentation of cultivated land function ceased after 1985. Cultivated land function change in 1985-2012 was assessed using the method in section 2.3.2.
Table 1 Changes in cultivated land functions according to policy development in China, 1949-2012
Table 1 Continued
Table 1 Continued
Table 2 Index system of cultivated land function assessment in China
Table 2 Continued
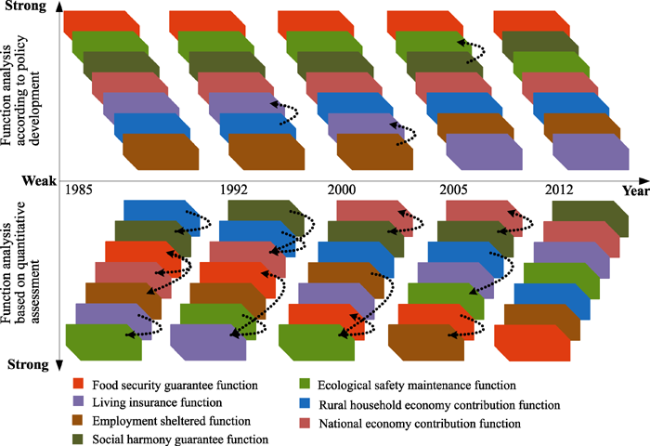
Figure 1 The evolving cultivated land functions based on policy development analysis in China, 1949-2012
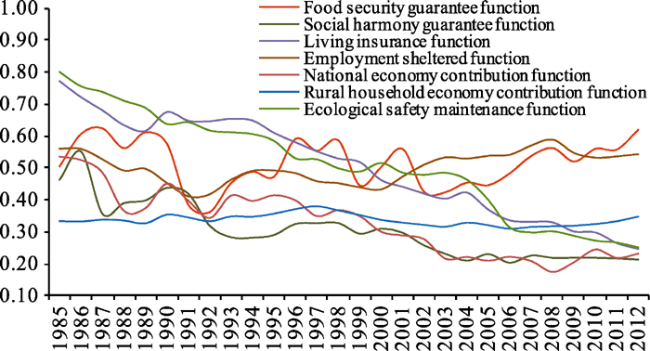
Figure 2 Change in cultivated land function based on quantitative assessment in China, 1985-2012
As shown in Figure 2, total value of the seven functions conforming to the positive connotation or cultivated land function supply, decreased markedly from 3.97 to 3.04 in 1985-1992. Meanwhile, coefficients of variability (CV) of the value of the seven functions fluctuated evidently. With the CV rising sharply from 3.36 to 5.41, the total value decreased slightly in 1992-1999. Both the total value and the CV decreased in 1999-2006. However, the total value turned to increase with slight fluctuation as the CV fell from 2.94 to 2.29 in 2006-2012. That is, cultivated land function strengthened as a whole with the balanced development of the seven functions after 2005.
Figure 3 shows that ecological safety maintenance function and living insurance function weakened remarkably as food security guarantee function and employment sheltered function fluctuated evidently but weakened slightly in 1985-2006. In the meanwhile, social harmony guarantee function and national economy contribution function weakened rapidly as rural household economy contribution function fluctuated slightly. However, ecological safety maintenance function and living insurance function weakened more slowly in 2006-2012. In the meanwhile, food security guarantee function and rural household economy contribution function turned to continue strengthening. Comparing with the changes in 1985-2006, changes in employment sheltered function, national economy contribution function and social harmony guarantee function showed much more smoothly in 2006-2012. It implies that a turning point appeared in 2006 in the process of cultivated land function change. Moreover, development of cultivated land function was in accordance with urban and rural residents’ needs after 2005.
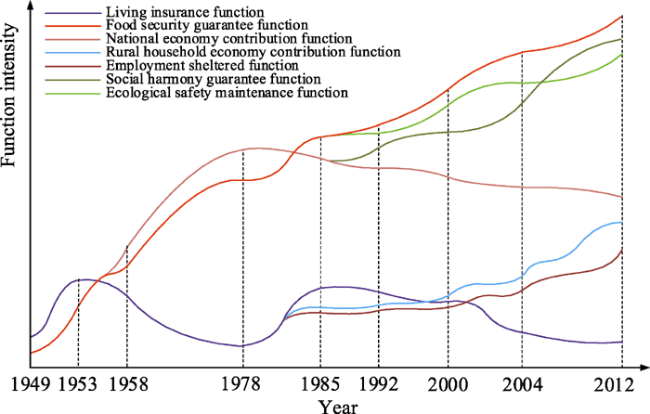
Figure 3 The evolving seven cultivated land functions based on quantitative assessment in China, 1985-2012

4.3 Cultivated land function transition analysis

To visualize change in cultivated land function morphology, Figures 1 and 3 were integrated into Figure 4. The evolving policies determined the normative cultivated land function or cultivated land function demand upgraded in 2004. Cultivated land use change resulted in fluctuation and catching-up with each other of the seven functions conforming to the positive connotation or termed cultivated land function supply. However, cultivated land function took an obvious turn in 2006 as the catching-up with each other phenomenon reduced after 2005. It clearly illustrated that cultivated land function transition occurred in 2006. Specifically, transition of the positive cultivated land function or cultivated land function supply occurred in 2006, which was two years later than the transition of the normative cultivated land function or cultivated land function demand. This mainly resulted from the time lag effects of policy implementation.
Figure 4 Changes in morphology of cultivated land function, 1985-2012
Co-ordination and malposition of supply and demand of cultivated land function coexisted with supply lag and function morphology distortion could be found by comparing Figure 1 with Figure 3. Generally speaking, contribution of cultivated land use to rural household living and to national economic growth decreased eventually and ultimately maintained at a certain level in the process of rapid urbanization. That is, changes in living insurance function and national economy contribution function have inherent economic law forced by market mechanisms such as the upgrading industrial structure. Cultivated land function transition in Japan, South Korea, USA, and European developed countries confirmed this viewpoint. As shown in Figures 1 and 3, changes in these two functions based on the normative and the positive connotation were in accord with the inherent economic law and the experiences in the developed countries. It implies that supply of these two functions was coordinated with their demand.
Malposition of supply and demand of cultivated land function was indicated by the changes in ecological safety maintenance function, social harmony guarantee function and employment sheltered function. To gain more agricultural products especially grain, ecological properties of cultivated land were insufficiently taken into consideration in land use activities. Moreover, chemical inputs and fragmentation of cultivated land were lack of supervision in land use management. These resulted in continuing degradation of ecological safety maintenance function supply, which was misplaced with the upgrading demand of this function. Noteworthy is that urban-rural income gap and the gap between operation income and wage and property income of rural household were widened in 1985-2012. Meanwhile, land-based finance and land expropriation increased social injustice. Inharmonious social factors related to cultivated land use change eventually accumulated. In consequence, supply of social harmony guarantee function continued degrading, which resulted in the misplacement with the increasing demand of this function. Noteworthy is that the widening income gaps mentioned above pulled large amount of rural labors into urban. However, employment opportunities for the transferred labors were shaky due to lag of urban-rural integrated labor market and undeveloped economy. Moreover, most of cultivated land was still fragmented into little parcels contracted by rural households. Cultivated land provided solid defense for unemployment of the transferred labors. Thus, supply of employment sheltered function remarkably exceeded by the demand.
Demand of food security guarantee function was prominent and continued increasing after 1985. However, deviation between the producer price and the consumer price of grain and fluctuation of grain growing willingness (Song et al., 2012) resulted in sharp fluctuation and slight increase of supply of this function in 1985-2002. Coordinated management of the two prices and farming-benefit policies promoted supply of this function turning to continue increasing after 2003. That is, supply of this function lagged behind the demand. The quantitative assessment results show that supply of rural household economy contribution function increased slightly from 0.34 to 0.35 in 1985-2012. It mainly resulted from the low profits of cultivated land use. Noteworthy is that supply of rural household economy contribution function exceeded supply of living insurance function in 2009. However, demand of rural household economy contribution function exceeded demand of living insurance function in the late 1990s and then strengthened rapidly.
As shown in Figure 4, compared with morphology of demand of cultivated land function, distortion of morphology of supply of cultivated land function was obvious. Malpositions of supply and demand of ecological safety maintenance function, social harmony guarantee function and employment sheltered function was the foremost causes for the distortion. It implies that implementation of multifunctional cultivated land management to rectify cultivated land function morphology is of significance for promoting cultivated land function transition.

5 Discussion

5.1 Suggestions on multifunctional cultivated land management

Analysis in section 4.3 shows that changes in living insurance function and national economy contribution function in 1985-2012 complied with inherent economic law forced by market mechanisms such as the upgrading industrial structure. Considering cultivated land function transition experiences in the developed countries, it is advisable to promote development of living insurance function and national economy contribution function through spontaneous regulation of the market rather than direct policy intervention.
In China, the amount of farmers is huge and the rural labor is surplus. Farmers’ behaviors have significant effects on social harmony. The central government entrusted cultivated land with providing substantial profits for farmers’ basic living and ensuring full employment in agricultural sector to guarantee social harmony and stability. However, inharmonious social factors related to low comparative profits of cultivated land use accumulated eventually. For example, the quantitative assessment results show that social harmony guarantee function decreased from 0.46 to 0.21 in 1985-2012. In the meanwhile, income justice decreased from 0.28 to 0.09. Contribution of the decreasing income justice to the decrease of this function amounted to 74.99%. Moreover, land-expropriated farmers were lack of security in basic living and income sources. Land expropriation conflicts sustaining existed and threatened social harmony and stability. It implies that raising comparative profits of cultivated land use and improving social security system are of significance for rectify malposition of supply and demand of social harmony guarantee function.
As analyzed in section 4.3, supply of employment sheltered function remarkably exceeded the demand mainly resulted from lag of urban-rural integrated labor market and cultivated land fragmentation. Lag of urban-rural integrated labor market was bound to increase unemployment probability of the transferred labors. In the meanwhile, cultivated land fragmentation promoted the supply of employment sheltered function. For example, according to the quantitative assessment results, although the supply of employment sheltered function decreased from 0.56 to 0.54 in 1985-2012, unemployment risk of the transferred labors and cultivated land fragmentation resulted in increase of 0.13 and 0.03 of the supply of employment sheltered function respectively. It implies that promotion of urban-rural integrated labor market improvement and surplus rural labor transfer are of significance for stripping the defense role of cultivated land for farmers.
The analysis above demonstrated that development of living insurance function and national economy contribution function should be accommodated to market mechanisms such as the upgrading industrial structure rather than direct policy intervention. Social harmony guarantee function should be substituted by social security system along with improvement of comparative profits of cultivated land use. In the meanwhile, employment sheltered function should be stripped by urban-rural integrated labor market and surplus rural labor transfer mechanism. That is, promoting coordinated development of rural household economy contribution function, food security guarantee function and ecological safety maintenance function is the main task for multifunctional cultivated land management in China.
The quantitative assessment results show that contribution of the decreasing index of cultivated land pressure and the increasing grain price equity to the increase of food security guarantee function were 154.21% and 98.16% respectively. In the meanwhile, contribution of the decreasing food quality security to the increase of this function was -152.37%. After cultivated land function transition occurred in 2006, food security guarantee function continued strengthening rapidly as cultivated land pressure decreased and grain price equity increased. However, food quality security deteriorated remarkably. In addition, contribution of the decreasing cultivated ecosystem diversity and the increasing chemical inputs intensity of cultivated land use to the decrease of ecological safety maintenance function amounted to 70.91%. Although ecological safety maintenance function weakened more slowly after 2006, contribution of changes in cultivated ecosystem diversity and chemical inputs intensity to change in this function still amounted to 82.74%. It implies that promotion of ecological management of cultivated land use is of significance for coordination of food security guarantee function and ecological safety maintenance function. Specifically, coordination of productivity, viability and resilience of cultivated land should be emphasized. Moreover, farmers’ enthusiasm for multifunctional cultivated land management is the key issue for the coordination. Noteworthy is that farmers’ enthusiasm is the focus of multifunctional cultivated land management polies in Japan, South Korea, USA, and European developed countries. The experiences in these countries show that farmers’ enthusiasm was motivated by strengthening rural household economy contribution function. Although cultivated land function transition has undergone since 2006, policies have not yet involved in motivating farmers’ enthusiasm for multifunctional cultivated land management in China. To promote multifunctional cultivated land management in China, the following experiences should be taken into consideration in policy making.
1) Promotion of large-scale management of cultivated land through legislation. Large-scale management of cultivated land is the effective way to raise comparative profits of cultivated land use and to optimize cultivated land use pattern, which is of significance for land-saving. This strategy is the common experiences in the developed countries mentioned above. For example, law of agriculture revitalization in Japan and new countryside campaign in South Korea have stimulated successfully cultivated land transfer to achieve large-scale management of cultivated land. According to the statistics from Statistics Japan, farm households in Hokkaido with operating cultivated land area less than 1 ha decreased 93.68% in 1947-2010. However, farm households in Hokkaido with operating cultivated land area more than 10 ha increased 136.36%. National institute of statistics and economic studies show that the farms with operating land area more than 200 ha increased 274.55% as the farms with operating land area less than 20 ha decreased 72.43% in 1979-2010 in France. According to the statistics from Eurostat, the farms with operating land area less than 5 ha decreased 61.77%, however, the farms with operating land area more than 50 ha increased 51.53% in 1981-2007 in German. The statistics from Statistics Sweden show that the farms with operating land area more than 100 ha increased 9.45% as the farms with operating land area between 2.10 ha and 5.10 ha decreased 70.73% in 1981-2007. According to the statistics from United States Census Bureau, the farms with operating land area between 0.40 ha and 72.44 ha decreased 13.40%, however, the farms with operating land area more than 404.70 ha increased 13.55% in 1974-2007 in the USA. In China, large-scale management of cultivated land has been promoted in recent years. For example, cultivated land turned to be out of use as the rural labors transferred to urban. The rural households with insufficient farming labors resulted from labor transfer rented their cultivated land to the farm hotshot or the farming enterprise. That is, this kind of large-scale management is spontaneous with high transaction cost and injustice due to the lack of unified planning and supervision. The legislation experiences in the developed countries are of significance for China to promote large-scale management with the guidance of cultivated land transfer planning.
2) Development of organic farms. As the outcomes of the upgrading consumption structure of urban and rural residents, organic farms are contributed to promoting environment-friendly land use and to raising agricultural profits. Development of organic farms is close related to cultivated land function transition. In the past decades, organic farms grew rapidly in the developed countries. For example, according to the statistics from Research Institute of Organic Agriculture FiBL, organic agricultural land area increased 17.78% with annual increase of 288.20 ha in 2005-2010 in Japan. In the meanwhile, statistics from Organic-World show that increase of organic agricultural land area amounted to 128.54%, 81.44% and 151.79% in France, German and Sweden respectively. According to the statistics from United States Census Bureau, certified organic farmland area increased 171.16% with annual increase of 153,840.38 ha in 2000-2008 in the USA. In the meanwhile, certified organic cropland area increased 287.78% with annual increase of 81,144.21 ha. It implies that development of organic farms is worthy for cultivated land function transition in China. Moreover, demand for organic farms has been visible in the market. For example, ecological farms, recreational and sightseeing farms grew rapidly around the developed cities such as Beijing, Tianjin, Shanghai, Guangzhou and Shenzhen in recent years. It is urgent for the governments to increase financial expenditure on promoting development of organic farms.
3) Establishment of cultivated ecosystem services market. Cultivated ecosystem services market is an effective platform for transferring ecological safety maintenance function to rural household income. Thus, establishment and development of this market is contributed to motivating farmers’ enthusiasm for multifunctional cultivated land management. The experiences in the USA provided reference for China to establish the markets such as, greenhouse gas markets, water quality markets and biodiversity markets (Stuart et al., 2010).
4) Implementation of subsidies for environment-friendly cultivated land use. In the common agricultural policy in European countries, subsidies for environment-friendly cultivated land use motivated effectively farmers’ enthusiasm for multifunctional cultivated land management. In China, the central government has implemented benefited farming policies such as direct subsidies to grain producers to raise farmers’ willingness to grow grain since 2003. However, these subsidies were on the basis of grain growing area and did not take environmental effects of cultivated land use and food quality safety into consideration (Song et al., 2012). It is urgent to increase finance and implement subsidies for environment friendly cultivated land use.

5.2 Implications for route of cultivated land transition research

The theory of land use transition was originated from forest transition hypothesis (Lambin and Meyfroidt, 2010; Mather, 1992). Land use pattern change especially forest cover change is the focus of land use transition research till now. It is no doubt that land consumption is resulted from the demand for land-based products or services. Noteworthy is that land use pattern is just one of the influencing factors of these products or services. Variety, amount and distribution of these products or services are also decided by land function. It is necessary to emphasize land function transition research.
Land function transition can be defined as the turn of long-term change in land function morphology. The key point of land function transition research is to measure long-term change in land function morphology based on definition of type and meaning of land function. Taking cultivated land as example, type and meaning of cultivated land function in current literatures were defined based on researchers’ preferences or comprehension on cultivated land use issues. Thus, measurement of cultivated land function change varies among case studies. Moreover, whether the type and meaning convey historic or future cultivated land use issues is not clear. As interpreted in section 2.2, there are two research routes of cultivated land function change. Both of the routes are oriented towards assessment and improvement of cultivated land use regulation policy as interpreted in section 2.1. That is, cultivated land function transition research should above all define type and meaning of cultivated land function following the proper and specific research route. Moreover, comparison of the normative and positive results of cultivated land function measurement is of significance for policy assessment and improvement.

6 Conclusions

In this paper, we diagnosed cultivated land function transition in China based on the methodology presented in section 2 using time-series data. Main results are concluded below:
1) Cultivated land function transition overall occurred in 2006. Specifically, the normative cultivated land function or cultivated land function demand fragmented into seven types in 1985 and upgraded in 2004. Total value of the positive cultivated land function or cultivated land function supply turned to rise with an increase from 2.40 to 2.45 as the coefficients of variability (CV) of the value of the seven functions decreased from 2.94 to 2.29 in 2006-2012. The two-year gap between this two aspects of transition mainly resulted from the time lag effects of policy implementation. In the process of the transition, co-ordination and malposition of supply and demand of cultivated land function coexisted with supply lag and function morphology distortion. Implementation of multifunctional cultivated land management is of significance and urgency in China.
2) The main task of multifunctional cultivated land management is to promote coordinated development of rural household economy contribution function, food security guarantee function and ecological safety maintenance function. The key point is to strengthen rural household economy contribution function to motivate farmers’ enthusiasm for multifunctional cultivated land management.
3) Land function change should be emphasized in land function transition research. The methodology presented in this paper clarifies that cultivated land function in essence has two aspects of connotation. The one is the normative connotation or termed cultivated land function demand, the other is the positive connotation or termed cultivated land function supply. Based on these two aspects of connotations, two research routes of cultivated land function change could be deduced which belong to ex-ante and ex-post impact assessment respectively. It is advisable for cultivated land function transition research to above all define type and meaning of cultivated land function following the proper and specific research route. Moreover, comparison of the normative and positive results of cultivated land function measurement is of significance.

The authors have declared that no competing interests exist.

1
Bae J S, Joo R W, Kim Y S, 2012. Forest transition in South Korea: Reality, path and drivers.Land Use Policy, 29(1): 198-207.

2
Bi Y Y, Zheng Z Y, 2000. The actual changes of cultivated area since the foundation of New China.Resources Science, 22(2): 8-12. (in Chinese)

3
Boody G, Vondracek B, Andow D Aet al., 2005. Multifunctional agriculture in the United States.BioScience, 55(1): 27-38.

4
Brouwer F, Heide C M.Multifunctional Rural Land Management: Economics and Policies. London: Earthscan, 2009.

5
Cai Y L, Fu Z Q, Dai E F, 2002. The minimum area per capita of cultivated land and its implication for the optimization of land resources allocation.Acta Geographica Sinica, 57(2): 127-134. (in Chinese)

6
de Groot R S, Wilson M A, Boumans R M J, 2002. A typology for the classification, description and valuation of ecosystem functions, goods and services.Ecological Economics, 41(3): 393-408.

7
Deelstra T, Boyd D, van den Biggelaar Met al., 2001. Multifunctional land use: An opportunity for promoting urban agriculture in Europe.Urban Agriculture Magazine, 4: 1-7.

8
Department of Rural Social and Economic Survey of National Bureau of Statistics of China, 1986-2013. China Rural Statistics Yearbook. Beijing: China Statistics Press, 1986-2013. (in Chinese)

9
Department of Rural Social and Economic Survey of National Bureau of Statistics of China, 1986-2013. China Yearbook of Agricultural Price Survey. Beijing: China Statistics Press, 1986-2013. (in Chinese)

10
Eurostat. Agricultural holdings with agricultural area. 2013-03-07.

11
Feng Z M, Liu B Q, Yang Y Z, 2005. A study of the changing trend of Chinese cultivated land amount and data reconstructing: 1949-2003.Journal of Natural Resources, 20(1): 35-43. (in Chinese)

12
Global Land Project (GLP), 2005. Global Land Project: Science plan and implementation strategy. IGBP Report No.53/IHDP Report No.19. IGBP Secretariat, Stockholm.

13
Grainger A, 1995. The forest transition: An alternative approach.Area, 27(3): 242-251.

14
Jongeneel R A, Polman N B P, Slangen L H G, 2008. Why are Dutch farmers going multifunctional?Land Use Policy, 25(1): 81-94.

15
Koomen E, Stillwell J, Bakema Aet al., 2007. Modelling Land-use Change: Progress and Applications. Netherlands: Springer.

16
Lambin E F, Meyfroidt P, 2010. Land use transitions: Socio-ecological feedback versus socio-economic change.Land Use Policy, 27(2): 108-118.

17
Lin G C S, Ho S P S, 2003. China’s land resources and land-use change: Insights from the 1996 land survey.Land Use Policy, 20(2): 87-107.

18
Liu C W, Li X B, 2006. Diagnosis on the marginalisation of arable land use in China.Geographical Research, 25(5): 895-904. (in Chinese)

19
Liu Y S, Liu Y, Chen Y F, 2011. Territorial multi-functionality evaluation and decision-making mechanism at county scale in China.Acta Geographica Sinica, 66(10): 1379-1389. (in Chinese)

20
Long H L, Heilig G K, Li X Bet al., 2007. Socio-economic development and land-use change: Analysis of rural housing land transition in the Transect of the Yangtse River, China.Land Use Policy, 24(1): 141-153.

21
Lu L S, 2003. New development of agriculture and food security.Food and Nutrition in China, 11: 11-14. (in Chinese)

22
Lu L S, 2008. Study on Strategy of Rational Allocation of Regional Agricultural Resources, Comprehensive Treatment of Environment and Coordinative Development of Agricultural Regions in China. Beijing: China Agricultural Press. (in Chinese)

23
Mather A S, 1992. The forest transition.Area, 24(4): 367-379.

24
Mather A S, Fairbairn J, Needle C L, 1999. The course and drivers of the forest transition: The case of France.Area, 15(1): 65-90.

25
Mather A S, Needle C L, 1998. The forest transition: A theoretical basis.Area, 30(2): 117-124.

26
Matsuno Y, Nakamura K, Masumoto Tet al., 2006. Prospects for multifunctionality of paddy rice cultivation in Japan and other countries in monsoon Asia.Paddy Water Environment, 4: 189-197.

27
Meyfroidt P, Lambin E, 2009. Forest transition in Vietnam and displacement of deforestation abroad.Proceedings of the National Academy of Sciences of the United States of America, 106(38): 16139-16144.

28
Ministry of Agriculture of the People’s Republic of China, 2009.Sixty-year Agricultural Statistics of New China. Beijing: China Agricultural Press. (in Chinese)

29
Ministry of Land and Resources of the People’s Republic of China, 1996-2013. China Land and Resources Statistical Yearbook. Beijing: Geological Press, 1996-2013. (in Chinese)

30
National Bureau of Statistics of China, 1986-2013. China Statistical Yearbook. Beijing: China Statistics Press, 1986-2013. (in Chinese)

31
National Institute of Statistics and Economic Studies, 2010. Farm operations according to utilized agricultural area. 2013-03-03.

32
OECD. Multifunctionality: Towards an Analytical Framework. Paris: Organization for Economic Cooperation and Development, 2001.

33
Organic-World. Organic area in the European Union 2000-2010. 2012-05-22.

34
Research Institute of Organic Agriculture FiBL. Organic agricultural land and other certified areas, breakdown by country 2005-2010. 2013-03-04.

35
Rudel T K, Coomes O T, Moran Eet al., 2005. Forest transitions: Towards a global understanding of land use change.Global Environmental Change, 15(1): 23-31.

36
Song X Q, Ma Z H, Zeng Yet al., 2007. Spatio-temporal evaluation of intensive construction land use based on comprehensive integration granting weight.Scientific and Technological Management of Land and Resources, 24(3): 55-59. (in Chinese)

37
Song X Q, Ouyang Z, 2012a. Connotation of multifunctional cultivated land and its implications for cultivated land protection.Progress in Geography, 31(7): 859-868. (in Chinese)

38
Song X Q, Ouyang Z, 2012b. Route of multifunctional cultivated land management in China.Journal of Natural Resources, 27(4): 540-551. (in Chinese)

39
Song X Q, Ouyang Z, Li Y Set al., 2012. Cultivated land use change in China, 1999-2007: Policy development perspectives.Journal of Geographical Sciences, 22(6): 1061-1078.

40
Song X Q, Wu Z F, 2013. Modelling and mapping trends in grain production growth in China.Outlook on Agriculture, 42(4): 255-263.

41
Statistics Japan. Farm households by degree of engagement and size of operating cultivated land, 1974-2007.

42
2013-03-07.

43
Stuart D, Canty D, Killebrew K, 2010. Guide to environmental markets for farmers and ranchers. American Farmland Trust. 2011-01-02.

44
Statistics Sweden.Agricultural enterprises by region, size class and period, 1981-2007.

45
2013-03-07.

46
Tian Y J, Li X B, Xin L J, 2009. Impacts of the rise of labor opportunity cost on agricultural land use changes: A case study of Ningxia Hui Autonomous Region.Journal of Natural Resources, 24(3): 369-377. (in Chinese)

47
United States Census Bureau. Farms by size and type of organization, 1974-2007.

48
2013-03-07.

49
Yeo I Y, Huang C Q, 2013. Revisiting the forest transition theory with historical records and geospatial data: A case study from Mississippi (USA).Land Use Policy, 32(1): 1-13.

50
Zhang L X, Huang J K, Qiao F B, 2006. Economic evaluation and analysis of chemical fertilizer use of farm household. In: Zhu Zhaoliang, Nuo Si, Sun Bo. Countermeasure of Agricultural Non-point Source Pollution Control in China. Beijing: China Environmental Science Press.

51
Zube E H, 1987. Perceived land use patterns and landscape values.Landscape Ecology, 1(1): 37-45.

Outlines

/