
Journal of Geographical Sciences >
Variations in the oxygen isotopic composition of precipitation in the Tianshan Mountains region and their significance for the Westerly circulation
*Corresponding author: Rao Zhiguo (1978-), PhD and Professor, specialized in geochemistry and paleoclimate research. E-mail:zgrao@lzu.edu.cn
Author: Liu Xiaokang (1990-), PhD Candidate, specialized in geochemistry and paleoclimate research. E-mail:liuxk07@lzu.edu.cn
Received date: 2015-01-09
Accepted date: 2015-02-28
Online published: 2015-06-24
Supported by
National Natural Science Foundation of China, No.41372181, No.41171091, No.41130102
Fundamental Research Funds for the Central Universities, No.lzujbky-2014-260
Copyright
Proxy records of the oxygen isotopic composition of meteorological precipitation (δ18Op) preserved in archives such as ice cores, lacustrine carbonates and stalagmite calcite are important for paleoclimatic studies. Therefore, knowledge of the variations and controlling mechanisms of modern δ18Op on different time scales is necessary. Here, we investigate the linear correlations between δ18Op and corresponding temperature and precipitation on monthly and inter-annual timescales, using data from the Urumqi (1986-2003) and Hotan stations of the Global Network of Isotopes in Precipitation (GNIP), and δ18O data from 4 ice cores in the adjacent Tianshan Mountains. Consistent with previous reported results, modern δ18Op variations on a seasonal time scale in the Tianshan region are mainly controlled by a ‘temperature effect’ (indicated by a significant positive correlation between δ18Op and temperature), with more positive δ18Op values occurring in summer. However, on an inter-annual timescale, there is a weak inverse correlation between weighted average annual δ18Op and annual average temperature at Urumqi station. This finding is supported by the inversely varying trends of δ18O data from 4 ice cores in the central and eastern Tianshan Mountains compared to annual average temperatures in the same region during the past 40-50 years. The data from Urumqi station and the 4 ice cores demonstrate that there is inverse correlation between δ18Op and temperature on inter-annual to decadal time scales. Analysis of water vapor sources and pathways for the warm year of 1997 and the cold year of 1988 reveal that relatively more water vapor for the Tianshan region was derived from long-distance transport from high-latitude sources than during the warm year of 1997; and that more water vapor was transported from more proximal sources from mid- to low-latitude areas during the cold year of 1988. In addition, the δ18Op values are more negative in the high latitude areas than those in mid- to low-latitude areas in the Eurasian continent at the upper wind direction of Tianshan Mountains region, according to the weighted averaged warm season (May to September) δ18Op values for 14 GNIP stations in the years 1997 and 1988. Due to the distribution of δ18Op within the Eurasian continent, the relative shift of water vapor sources between warm and cold years convincingly explains the observed variations of δ18Op in the Tianshan Mountains region. Therefore, we conclude that variations in δ18Op in this region are mainly controlled by changes in water vapor sources which are ultimately caused by northward and southward shifts in the Westerly circulation.
Key words: Tianshan Mountains; Urumqi; δ18Op; water vapor sources; Westerly circulation
LIU Xiaokang , RAO Zhiguo , ZHANG Xiaojian , HUANG Wei , CHEN Jianhui , CHEN Fahu . Variations in the oxygen isotopic composition of precipitation in the Tianshan Mountains region and their significance for the Westerly circulation[J]. Journal of Geographical Sciences, 2015 , 25(7) : 801 -816 . DOI: 10.1007/s11442-015-1203-x
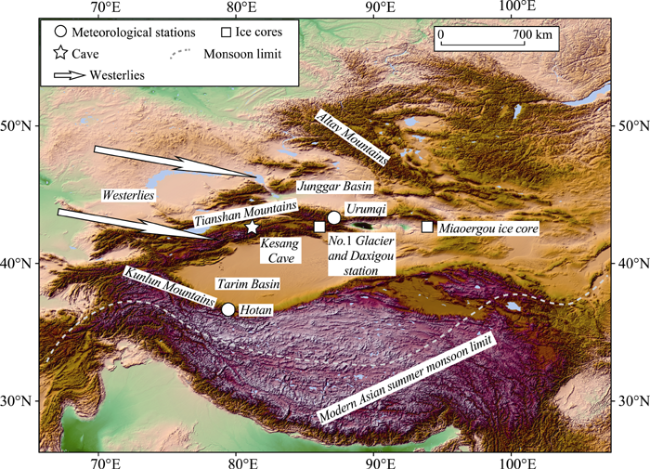
Figure 1 The study area and climatic records (the modern Asian summer monsoon limit is based on Chen et al., 2008) |
Table 2 Details of the localities and δ18Op data for 14 GNIP stations in the Eurasian continent and their weighted average warm season (May to September) δ18Op values in 1997 and 1988 |
 |
Table 2 Annual precipitation, annual and warm season (May to September) average temperature, and weighted average annual and warm season δ18Op values for 1997 and 1988 at Urumqi station |
| Year | Annual precipitation amount (mm) | Annual average temperature (°C) | Weighted average annual δ18Op (‰, VSMOW) | Warm season average temperature (°C) | Weighted average warm season δ18Op (‰, VSMOW) |
|---|---|---|---|---|---|
| 1997 | 156 | 10.13 | -11.33 | 25.72 | -8.64 |
| 1988 | 374 | 6.33 | -7.49 | 19.40 | -6.39 |
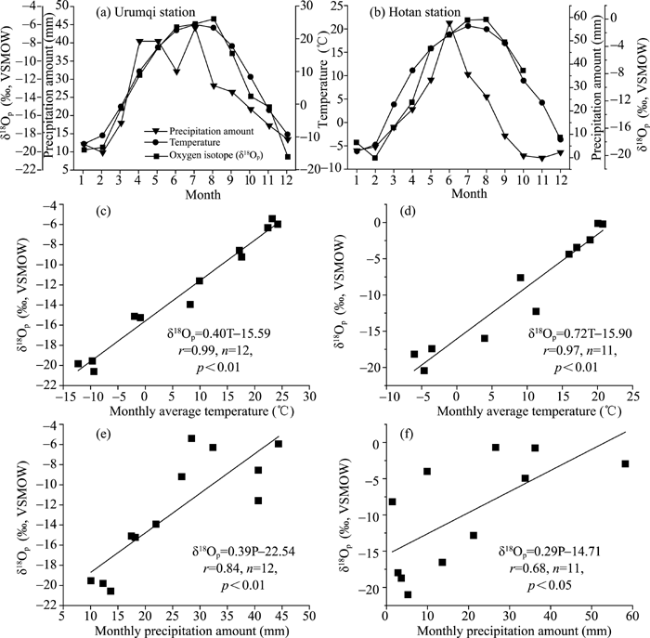
Figure 2 Variations of monthly δ18Op, temperature and precipitation at Urumqi (a) and Hotan (b) stations; linear correlations between monthly δ18Op and temperature at Urumqi (c) and Hotan (d) stations; and linear correlations between monthly δ18Op and precipitation amount at Urumqi (e) and Hotan (f) stations |
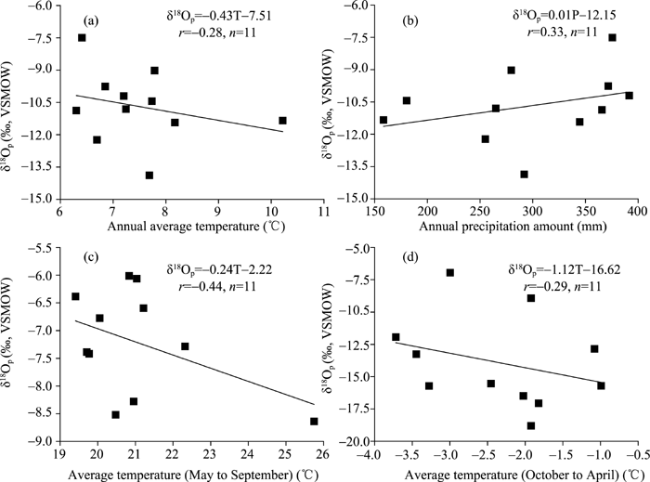
Figure 3 Linear correlations between weighted average annual δ18Op and mean annual temperature (a); weighted average annual δ18Op and annual precipitation amount (b); weighted average warm season (May to September) δ18Op and warm season average temperature (c); weighted average cold season (October to April) δ18Op and cold season average temperature (d) at Urumqi station |
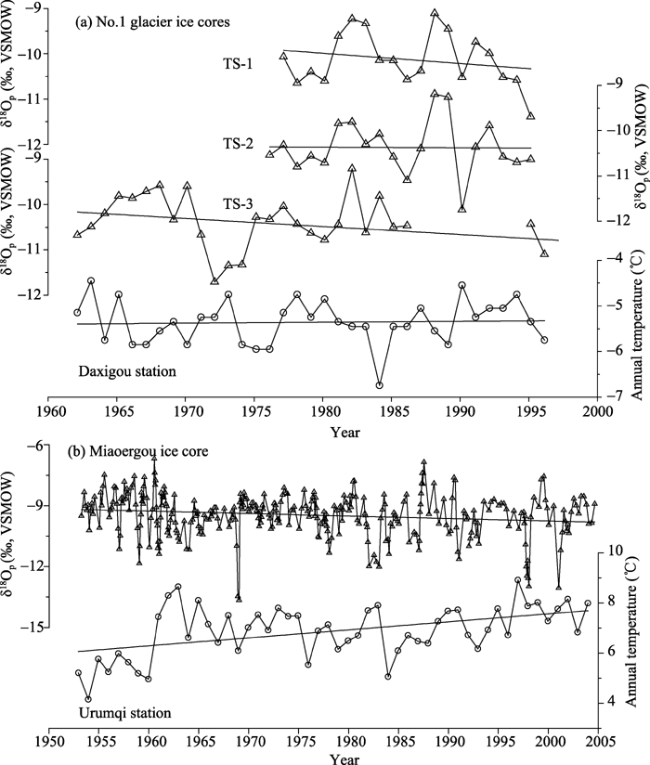
Figure 4 Comparison of δ18O records from three ice cores (TS-1, TS-2, TS-3) from No.1 glacier in the central Tianshan Mountains with annual average temperature data from the nearby Daxigou Meteorological Station (a. original data from Hou et al. (1998, 2006)); comparison of the Miaoergou ice core δ18O record from the eastern Tianshan Mountains (original data from Song et al. (2011)) with annual average temperature data from Urumqi station (b. original data from China Surface Climate Dataset (Monthly)). (Bold lines indicate the long-term trends of each dataset) |
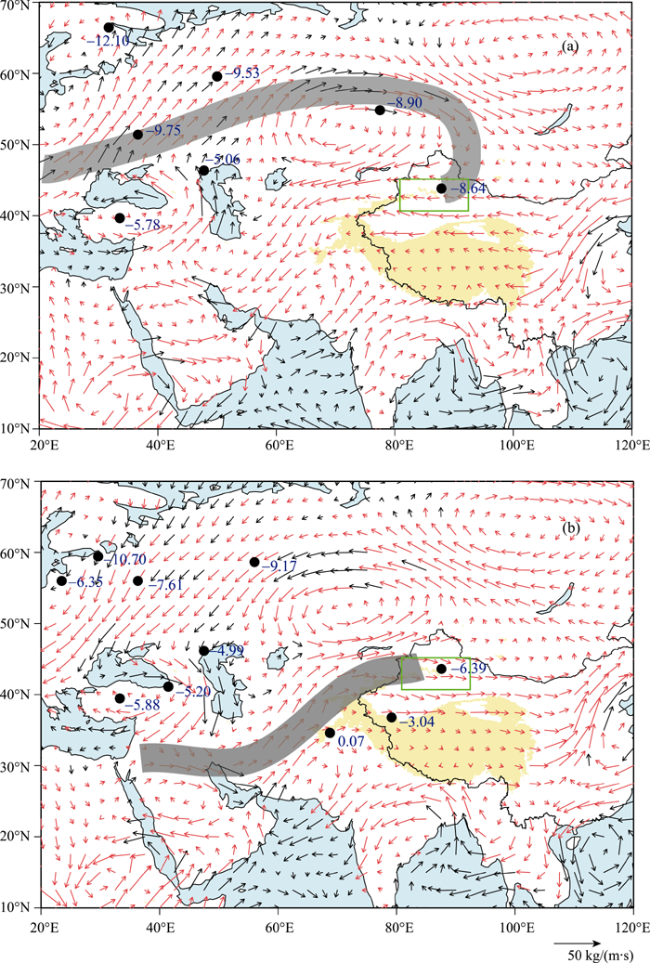
Figure 5 Differences in water vapor sources for the Tianshan Mountains region between the warm season of 1997 (warm year) and 1988 (cold year) and the corresponding weighted average warm season δ18Op values of 14 GNIP stations in the Eurasian continent. (a. warm season water vapor flux of 1997 minus that of 1988; b. warm season water vapor flux of 1988 minus that of 1997. Red arrows indicate the relative water vapor changes significant at the 99% level; grey bands indicate the main pathways of relative water vapor sources; black dots indicate the GNIP stations; blue numbers denote the weighted average warm season δ18Op values in the years 1997 and 1988 (data are shown in Tables 1 and 2); and the green boxes show the location of the Tianshan Mountains region |
The authors have declared that no competing interests exist.
| 1 |
|
| 2 |
|
| 3 |
|
| 4 |
|
| 5 |
|
| 6 |
|
| 7 |
|
| 8 |
|
| 9 |
|
| 10 |
|
| 11 |
|
| 12 |
|
| 13 |
|
| 14 |
|
| 15 |
|
| 16 |
|
| 17 |
|
| 18 |
|
| 19 |
|
| 20 |
|
| 21 |
|
| 22 |
|
| 23 |
|
| 24 |
|
| 25 |
|
| 26 |
|
| 27 |
|
| 28 |
|
| 29 |
|
| 30 |
|
| 31 |
|
| 32 |
|
| 33 |
|
| 34 |
|
| 35 |
|
| 36 |
|
| 37 |
|
| 38 |
|
| 39 |
|
| 40 |
|
| 41 |
|
| 42 |
|
| 43 |
|
| 44 |
|
| 45 |
|
| 46 |
|
| 47 |
|
| 48 |
|
| 49 |
|
| 50 |
|
/
| 〈 |
|
〉 |