Orginal Article

Precipitation variability in Portugal from 1960 to 2011

  • A. N. NUNES ,
  • L. LOURENÇO
Expand
  • Center for Studies in Geography and Spatial Planning (CEGOT), Department of Geography, University of Coimbra, Largo da Porta Férrea, 3004-530 Coimbra, Portugal

Author: A. N. Nunes, E-mail:

Received date: 2014-06-13

  Accepted date: 2014-11-30

  Online published: 2015-06-24

Copyright

Journal of Geographical Sciences, All Rights Reserved

Abstract

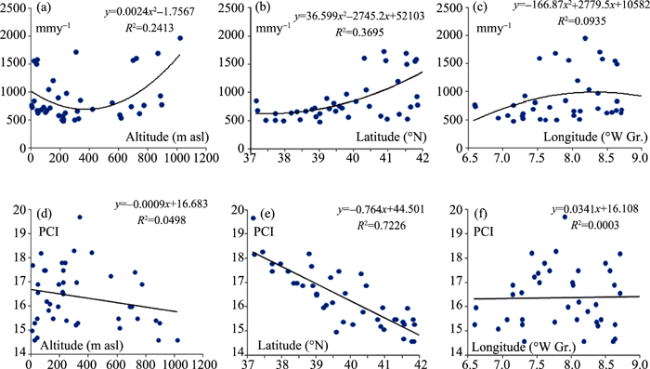
This study analyses spatial variability and trends in annual and monthly precipitation (amount and concentration) based on data from 42 stations in mainland Portugal during the period 1960-2011. Relationships between certain geographic variables (elevation, latitude and longitude) and precipitation variability were also determined in order to check for specific dependencies and spatial patterns in precipitation distribution, concentration and changing trends. Trends and relationships have been analysed using both parametric and non-parametric tests. The results showed that annual precipitation had decreased in all stations and that this trend is statistically significant for most of the time series (70% of the stations showed negative trends with at least a 0.1 significance level). The Annual Precipitation Concentration Index revealed an opposite behaviour pattern, suggesting that even though the annual trend for precipitation amount was negative overall, more than half of the udometric stations registered a more marked seasonality for precipitation during the period 1960-2011. However, only one station showed statistical significant time trend. Regarding the influence of geographical features, latitude is the most important variable, governing spatial distribution and variations in annual precipitation as well as its intra-annual changeability. These important changes in precipitation, involving both amount and concentration, may have severe consequences for ecosystems and societies.

Cite this article

A. N. NUNES , L. LOURENÇO . Precipitation variability in Portugal from 1960 to 2011[J]. Journal of Geographical Sciences, 2015 , 25(7) : 784 -800 . DOI: 10.1007/s11442-015-1202-y

1 Introduction

Changes in the amount and intra-annual distribution of precipitation can have important environmental and economic effects. Changes in total annual and monthly precipitation, as well as in its concentration over time, are important factors which affect water availability by modifying river regimes and groundwater recharge (de Luis et al., 2011; López-Moreno et al., 2009; Paredes et al., 2006), which may have a strong influence on water consumption and hydroelectric production (Paredes et al., 2006). Variations in precipitation can also limit ecosystem productivity, affect soil erosion (Nunes et al., 2011; Nunes et al., 2014; Michiels et al., 1992; Prats et al., 2013) and forest fires (Carvalho et al., 2008) and, in some areas, intensify the processes of land degradation and desertification (Nunes et al., 2014).
In Portugal, as well as in the Mediterranean region in general, there is a complex pattern for spatial and seasonal variability in precipitation, aggravated by the inconstancy of rainfall from year to year and during the year. This inter-annual variability therefore makes it difficult to assess trends in precipitation distribution patterns and the impact of potential climate change (Ramos and Martínez-Casasnovas, 2006).
However, several authors have highlighted different aspects of this variability for specific areas in the Mediterranean basin and have quantified trends with indices. For example, Bartzokas et al. (2003) analysed the spatial distribution of precipitation amount and duration in Greece for each main rainfall period and showed the differences between northern, western and eastern areas. In their study of spatio-temporal variability in precipitation in Castile and León during the period 1945-1996, Labajo and Piorno (2001) identified a declining trend in annual precipitation, although this was not statistically significant. De Luis et al. (2009, 2010) also found decreases in yearly precipitation in most of the Mediterranean Iberian Peninsula when analysing the annual trends for the period 1951-2000. Nunes et al. (2014), analysing the period 1950-2008, detected decreases in annual precipitation accompanied by increases in precipitation concentration in southern Portugal, although no generalised, significant trends for these variables have been found. This trend also concurs with the results obtained by de Luis et al. (2011), which show that precipitation concentration has increased across most of the Spanish Iberian Peninsula.
It is accepted that precipitation variability results from various geographical variables such as latitude, longitude and topography. However, only a small number of studies have investigated the relationship between trends in precipitation variation and geographical variables (Nunes et al., 2014).
This study therefore aims to analyse spatial variability and trends in annual and monthly precipitation (amount and concentration) in mainland Portugal during the period 1960-2011. Relationships between certain geographic variables (such as latitude, longitude and elevation) and annual and monthly precipitation distribution and trend were checked in order to identify specific dependencies and spatial patterns in precipitation distribution, concentration and changing trends.
In fact, the enormous importance of water availability for ecosystems and societies highlights the need to understand precipitation variability and trends, both in time and in space, as well as their link to the large-scale climate system, in order to understand how these changes can affect regional water supplies.

2 Study area

Mainland Portugal is located in the extreme southwest of continental Europe, in the Iberian Peninsula, between 42°00' and 37°00′N and 7°00′ and 9°15′W Greenwich. The average annual precipitation varies from around 2000 mm to 500 mm in the north-west (between the Minho and Douro rivers) and south-eastern areas of the country, respectively. This pattern is reversed for the average annual temperature, with the highest values registered in the Alentejo (Central and Lower Alentejo) and Algarve regions, and the lowest in the northernmost territories.
Despite this variability, the country as a whole reflects the seasonal pattern typical of a Mediterranean climate, characterised by cool, wet winters and hot, dry summers. With the exception of the northwest region, the entire territory has a reasonably long, dry season, lasting three to five months and increasing from north to south and from coastal to inland areas.

3 Material and methods

Yearly and monthly precipitation data for the period between 1960 and 2011, taken from 42 udometric stations spatially representative of Portuguese territory, was obtained from the National Institute of Water database (INAG-Instituto da Água/ SNIRH-Sistema Nacional de Informacão de Recursos Hídricos, http://snirh.inag.pt) (Figure 1 and Table 1). The udometric stations, which have a length of record of 52 years, are located between 39º62' and 37º15'N and 7º00' and 9º12'W Greenwich, and the altimetric gradient varies from 2 m to 1018 m (asl).
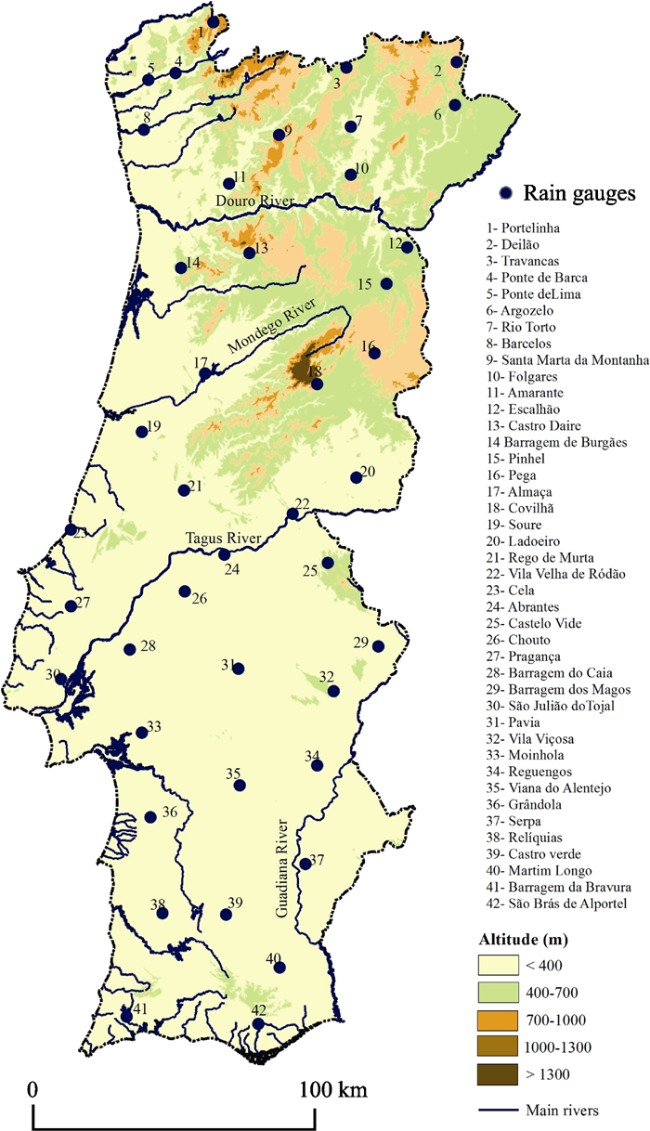
Figure 1 Location of the gauging stations used in this study
As these 42 rain gauges are used for monitoring precipitation on a national scale, the data were complied with important quality criteria, namely: (i) a limited number of gaps in the monthly time series, generally less than 1% of the total observation record longevity, (ii) the fact of being spatially representative of the distribution irregularity for precipitation in mainland Portugal, and (iii) normality and homogeneity requirements.
However, when some data was missing from the time series, the following procedure was adopted. A linear correlation was first established for the time series in order to choose the nearest udometric station with a time series whose precipitation characteristics most closely resembled those of the station with the missing data. Spatial regression was then used to estimate the missing values (Peterson and Easterling, 1994) or correct anomalous precipitation values. Afterwards, using non-parametric tests, the Shapiro-Wilk test and the Kolmogorov-Smirnov test (Lima et al., 2010), the data was statistically tested for normality. The Standard Normal Homogeneity Test was selected to check the time series homogeneity (Alexandersson and Moberg, 1997; Lima et al., 2010).
Table 1 Characteristics of gauging stations used in this study (Length of record =52 yr)
Rain gauges* Altitude
(asl m)
Latitude
North
Longitude
W Greenwich
Mean rainfall
(mm)
St. deviation
(mm)
(1) Portelinha 1018 42º05' 8º17' 1975 525
(2) Deilão 892 41º85' 6º59' 784 211
(3)Travancas 884 41º83' 7º31' 941 263
(4) Ponte da Barca 39 41º80' 8º42' 1599 406
(5) Ponte de Lima 18 41º77' 8º60' 1566 403
(6) Argozelo 685 41º64' 6º60' 756 197
(7) Rio Torto 322 41º54' 7º28' 537 149
(8) Barcelos 36 41º53' 8º62' 1511 390
(9) S.M.Montanha 866 41º50' 7º75' 1709 448
(10) Folgares 739 41º30' 7º28' 623 165
(11) Amarante 146 41º26' 8º07' 1215 330
(12) Escalhão 615 40º95' 6º92' 546 127
(13) Castro Daire 697 40º92' 7º94' 1577 456
(14) B.Burgães 306 40º85' 8º38' 1733 452
(15) Pinhel 606 40º77' 7º06' 597 165
(16) Pega 770 40º43' 7º14' 773 231
(17) Almaça 116 40º34' 8º23' 1056 308
(18) Covilhã 719 40º28' 7º51' 1615 506
(19) Soure 18 40º05' 8º63' 851 238
(20) Ladoeiro 215 39º83' 7º27' 577 168
(21) R. Murta 241 39º77' 8º36' 987 297
(22) V.V.Ródão 84 39º65' 7º67' 739 217
(23) Cela 2 39º57' 9º07' 769 197
(24) Abrantes 105 39º45' 8º10' 679 199
(25) Castelo Vide 552 39º41' 7º45' 823 236
(26) Chouto 126 39º27' 8º35' 725 210
(27) Pragança 183 39º20' 9º06' 912 260
(28) B. Caia 217 39º00' 7º14' 489 155
(29) B. Magos 43 38º99' 8º69' 640 187
(30) Pavia 189 38º90' 8º01' 590 170
(31) S.J. Tojal 6 38º84' 9º12' 736 217
(32) Vila Viçosa 417 38º78' 7º42' 709 212
(33) Moinhola 41 38º58' 8º62' 681 175
(34) Reguengos 218 38º42' 7º53' 527 165
(35) V. Alentejo 314 38º33' 8º01' 676 187
(36) Grândola 95 38º17' 8º55' 651 180
(37) Serpa 209 37º94' 7º60' 509 174
(38) Relíquias 232 37º70' 8º48' 640 207
(39) Castro Verde 217 37º70' 8º09' 524 157
(40) Martim Longo 294 37º44' 7º77' 515 190
(41) B. Bravura 64 37º20' 8º70' 693 229
(42) S.B. Alportel 334 37º16' 7º90' 865 291
Mean 896 254

* Rain gauges stations are listed in accordance with their latitude, towards North to South.

A statistical analysis of the precipitation was carried out for all the rain gauges in order to identify any trends in annual and monthly amounts, using IBM SPSS 20.0 software. Two different methods were used to detect whether there was a trend in the precipitation series. The Spearman test (RS), which is a rank-based distribution-free method, was used to identify trends and determine the significance. Statistical significance was assessed on four levels: statistically significant at 0.01 level (representing a very strong trend); statistically significant at 0.05 level (representing a strong trend); statistically significant at 0.1 level (representing a moderate trend); not statistically significant at 0.1 level, interpreted here as having ‘nil’ significance. As non-parametric tests detect a trend but do not quantify it, linear regression was used to determine the magnitude of the trend on an annual scale.
Oliver (1980) proposes a Precipitation Concentration Index (PCI) which has been used by several researchers in different regions of the world (Apaydin et al., 2006; de Luis et al., 2010; Elagib, 2011). A modified version of the Precipitation Concentration Index (PCI) (de Luis et al., 2010, 2011; Elagib, 2011; Nunes et al., 2014) was used to estimate annual and monthly rainfall heterogeneity. Using the PCI, data related to the long-term variability in rainfall amount was obtained and calculated using the next equation on an annual scale:
where pi is the monthly precipitation in month i.
According to Oliver’s classification, PCI values of less than 10 indicate regular precipitation distribution (low precipitation concentration), values between 11 and 15 represent moderate precipitation concentration, values from 16 to 20 indicate irregular distribution, and values above 20 represent strong irregularity, i.e. high precipitation concentration, in precipitation distribution.
Relationships between precipitation variation trends (amount and concentration) and certain geographical features, such as altitude, latitude and longitude, have been analysed using parametric and non-parametric tests.

4 Results

4.1 Yearly and monthly precipitation: spatial patterns and trends for amount and concentration

The mean annual rainfall values for the 42 time series distributed over Portuguese territory varied from 489 mm and 1975 mm y-1 (Table 1), with an average standard deviation of around 254 mm. In general the mean annual precipitation decreased from north to south and from the coastal region to inland Portugal, although this behaviour was more evident in the north and centre of the country. Thus, the highest values were found in the north-west region, with values between 1500 and 2000 mm yr-1. In the north-east the mean annual precipitation values were significantly lower by around one half or one third in comparison to the values recorded in the north-western area. As example Ponte de Lima and Deilão, both located at the same latitude but the first close to the Atlantic coast and the second in inland of the country, nearby the border with Spain, recorded in average respectively 1600 yr-1 and 780 mm yr-1.
In the area south of the River Tagus, the Alentejo and Algarve regions recorded the lowest average annual precipitation values of approximately 500-600 mm yr-1. The highest values were recorded in the mountainous areas of the Alentejo (the São Mamede mountain ridge) and Algarve (Monchique and Caldeirão) and in the stations nearest the coast. Conversely, the lowest average amounts were found in the south-eastern Alentejo, particularly on the left bank of the River Guadiana (Figure 2a).
According to the PCI classification, 12 of the rain gauges (±30%) registered moderate annual precipitation concentration, while in 30 of the stations it was categorised as the seasonal variation type, i.e. revealing irregular distribution in intra-annual precipitation. The highest values were found in the southern and southeastern parts of Portugal and the lowest values in the north-western region (Figure 2b). The correlations found between annual amount and precipitation concentration were negative and statistically significant (r= -0.453; significant at 0.001 level), suggesting that the stations with the lowest annual precipitation depth have the greatest intra-annual precipitation concentration.
Figure 3 maps the degree of significance of the trend detected for total annual precipitation according to the Spearman coefficient and the magnitude of change in relation to mean annual rainfall (in mm yr-1). Based on an analysis of Figure 3a), annual precipitation has decreased in all of the 42 udometric stations in mainland Portugal, and this trend is statistically significant for most of the time series (more than 70% of the rain gauges showed negative trends with at least a 0.1 significance level). A great percentage of stations (43%) showing, however, a very strong negative trend (significant al 0.01 level), indicating that several areas of the Portuguese territory has been suffering an important precipitation decrease, and the central and northern areas seem to be more affected. The linear trends further confirm that the magnitude of the decrease in cumulative rainfall, over the studied period, is more pronounced in the northern and central areas of the country, highlighting the northwest mainland Portugal, where in all of the rain gauges the decline exceeds 8 mm yr-1 (Figure 3b). In those stations (Portelinha, Ponte de Lima, Ponte da Barca, Barcelos and Amarante) the estimated decrease corresponds to about 30% of the annual value.
The annual rainfall series with trends that are not statistically significant were found mainly in the area to south river Tagus, particularly in the eastern Alentejo and Algarve region.
Various trends were revealed in each of the 12 subseries of individual months from January to December (Tables 2-4). March experienced a homogenous negative trend in precipitation whilst in February and June only one station (Martim Longo) denoted a positive tendency but without statistical significance. In these months, the decline in precipitation was statistically significant in around 80%, 60% and 50% of the stations respectively in February, June and March, when the Spearman coefficient was applied. In January and November more than 90% of the time series also showed a negative trend. However this reduction was just statistically significant at 0.1 level for January in 45% of the rain gauges (Tables 2 and 4).
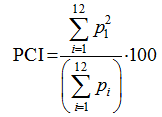
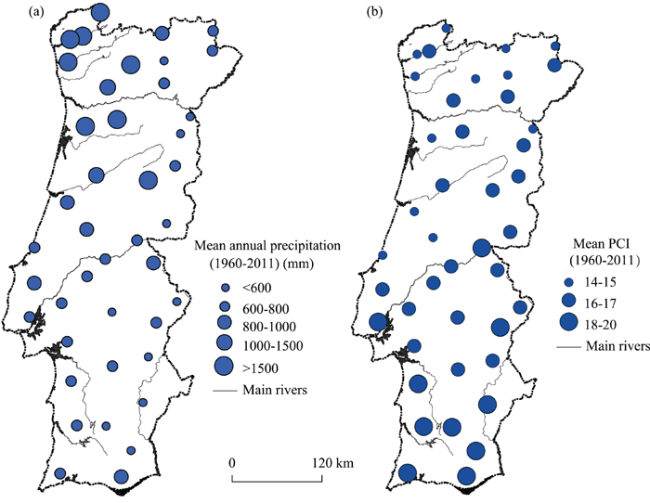
Figure 2 Spatial distribution of mean annual precipitation (a) and mean annual precipitation concentration index (PCI) (b), in mainland Portugal for the period 1960-2011
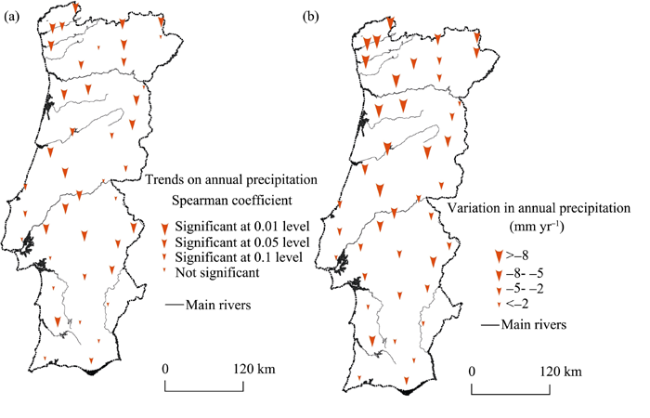
Figure 3 Trends on annual precipitation: Spearman coefficient (a); magnitude of change in mm per year (mm yr-1) (b)
Table 2 Monthly precipitation trends (1960-2011)
Rain gauges Months
J F M A M J J A S O N D
(1) Portelinha -0.284** -0.314** -0.255* -0.052 -0.089 -0.116 0.134 0.079 -0.190 0.110 -0.105 -0.061
(2) Deilão -0.204 -0.300** -0.197 -0.016 -0.074 -0.270* -0.207 0.047 -0.154 -0.001 -0.113 0.035
(3) Travancas -0.302** -0.305** -0.211 -0.089 -0.153 -0.240* -0.113 0.010 -0.246* 0.050 -0.180 -0.018
(4) P. Barca -0.232* -0.385*** -0.236* -0.026 -0.085 -0.100 0.184 0.112 -0.241* 0.042 -0.049 -0.031
(5) P.Lima -0.258* -0.357*** -0.239* -0.099 -0.184 -0.050 0.169 0.138 -0.296** -0.043 -0.053 -0.092
(6) Argozelo -0.223 -0.285* -0.094 0.124 -0.094 -0.053 0.054 0.105 -0.036 0.090 -0.027 0.067
(7) Rio Torto -0.136 -0.378** -0.191 -0.096 0.097 -0.240 -0.122 0.204 -0.116 0.088 -0.155 -0.021
(8) Barcelos -0.259* -0.341** -0.230 -0.043 -0.140 -0.120 0.309** -0.025 -0.303** 0.126 -0.054 -0.132
(9) S.M.Montanha -0.044 -0.265* -0.228 0.053 -0.004 -0.164 0.167 0.124 -0.172 0.026 -0.086 0.032
(10) Folgares -0.187 -0.310** -0.228 -0.067 -0.107 -0.311** -0.054 0.217 -0.134 0.138 -0.115 0.069
(11) Amarante -0.153 -0.345** -0.296** -0.029 -0.066 -0.215 -0.042 0.115 -0.181 -0.010 -0.079 0.022
(12) Escalhão -0.115 -0.233* -0.200 0.008 -0.017 -0.200 -0.060 0.190 -0.075 0.173 -0.114 0.081
(13) Castro Daire -0.245* -0.343** -0.300* -0.040 -0.186 -0.308** 0.130 0.170 -0.132 0.138 -0.120 -0.006
(14) B.Burgães -0.274* -0.393*** -0.326** -0.107 -0.189 -0.145 0.266* 0.134 -0.220 0.056 -0.008 -0.023
(15) Pinhel -0.177 -0.257* -0.293** -0.028 -0.007 -0.262* -0.020 0.158 -0.110 0.099 -0.183 0.012
(16) Pega -0.169 -0.275* -0.197 -0.197 0.010 -0.286** -0.054 0.231 0.006 0.128 -0.202 -0.030
(17) Almaça -0.208 -0.258* -0.325** -0.092 -0.214 -0.260* 0.102 0.155 -0.066 0.102 -0.146 -0.020
(18) Covilhã -0.242* -0.345** -0.146 0.061 -0.131 -0.288** -0.086 0.210 -0.018 0.136 -0.092 0.020
(19) Soure -0.325** -0.302** -0.253* -0.053 -0.137 -0.280** 0.073 0.164 -0.196 0.043 -0.157 -0.152
(20) Ladoeiro -0.192 -0.250* -0.293** -0.027 -0.095 -0.437*** -0.027 0.037 0.008 0.177 -0.081 -0.033
(21) R. Murta -0.321** -0.343** -0.355*** -0.082 -0.244 -0.338** 0.037 0.234* -0.204 0.095 -0.242* -0.097
(22) V.V.Ródão -0.100 -0.211 -0.189 0.161 0.070 -0.345** 0.097 0.293** 0.019 0.203 -0.067 0.016
(23) Cela -0.322** -0.262* -0.271* 0.026 -0.133 -0.248* 0.280** 0.230 -0.096 0.050 -0.177 -0.110
(24) Abrantes -0.268* -0.252* -0.306** -0.035 -0.103 -0.314** 0.231* 0.166 -0.126 0.099 -0.160 0.030
(25) Castelo Vide -0.129 -0.216 -0.248* 0.025 -0.085 -0.349** 0.066 0.197 -0.184 0.191 -0.113 0.038
(26) Chouto -0.311** -0.324** -0.227 -0.084 -0.060 -0.326** -0.078 0.021 -0.068 0.043 -0.141 -0.159
(27) Pragança -0.321** -0.383*** -0.259* 0.041 -0.064 -0.123 0.384*** 0.450*** 0.113 0.127 -0.070 -0.075
(28) B. Caia 0.022 -0.158 -0.100 -0.235 -0.263 -0.225 -0.118 -0.048 -0.411*** 0.200 0.335** -0.031
(29) B.Magos -0.250* -0.339** -0.271* 0.022 -0.188 -0.280** 0.168 0.113 0.025 0.099 -0.216 -0.120
(30) Pavia 0.133 -0.146 -0.063 -0.172 -0.325** -0.336** -0.078 -0.155 -0.456*** -0.006 0.260* -0.127
(31) S.J. Tojal -0.090 -0.194 -0.203 0.051 0.022 -0.050 0.335** 0.194 0.141 0.186 -0.081 -0.005
(32) Vila Viçosa -0.228 -0.302** -0.372** 0.021 0.055 -0.287** 0.198 0.292** 0.024 0.050 -0.116 -0.159
(33) Moinhola -0.200 -0.252* -0.206 -0.022 0.026 -0.136 0.299** 0.226 0.002 0.170 -0.058 -0.077
(34) Reguengos -0.299** -0.281** -0.285** 0.103 -0.050 -0.312** 0.387*** 0.299** -0.046 0.056 -0.214 -0.085
(35) V. Alentejo -0.129 -0.175 -0.171 0.146 0.094 -0.203 0.228 0.188 0.014 0.164 -0.105 -0.083
(36) Grândola -0.122 -0.238* -0.196 0.117 0.071 -0.167 0.416*** 0.236* 0.292** 0.137 -0.098 0.063
(37) Serpa -0.169 -0.223 -0.131 0.114 0.018 -0.457*** 0.287** 0.238* 0.208 0.135 -0.075 -0.008
(38) Relíquias -0.299** -0.281** -0.285** 0.103 -0.050 -0.312** 0.387*** 0.299** 0.010 -0.119 -0.175 -0.059
(39) Castro Verde -0.192 -0.258* -0.228 0.063 -0.066 -0.524*** 0.248* 0.366*** 0.168 0.084 -0.062 0.040
(40) M. Longo 0.205 0.047 -0.479*** 0.368** 0.186 0.214 0.082 -0.007 0.152 -0.193 -0.210 -0.149
(41) B. Bravura -0.239* -0.195 -0.223 0.084 -0.056 -0.040 0.539*** 0.241* 0.190 0.079 0.019 0.150
(42) S.B. Alportel -0.281** -0.331** -0.232* 0.053 0.032 -0.305** 0.428*** 0.161 0.217 0.094 -0.085 0.090
Table 3 Monthly and annual PCI trends (1960-2011)
Rain gauges Months
J F M A M J J A S O N D Year
(1) Portelinha -0.133 -0.197 -0.130 0.087 0.099 0.002 0.236* 0.163 -0.061 0.245* 0.048 0.103 -0.068
(2) Deilão -0.068 -0.195 -0.083 0.108 0.057 -0.173 -0.044 0.097 -0.103 0.128 0.014 0.188 0.142
(3) Travancas -0.094 -0.206 -0.045 0.064 -0.010 -0.126 -0.046 0.131 -0.133 0.185 -0.023 0.179 0.146
(4) P. Barca -0.044 -0.339** -0.080 0.112 0.044 0.025 0.258* 0.195 -0.193 0.129 0.072 0.131 0.056
(5) P.Lima -0.028 -0.256* -0.092 0.075 -0.072 0.099 0.279** 0.216 -0.150 0.072 0.091 0.137 -0.049
(6) Argozelo -0.175 -0.246* -0.043 0.173 0.001 -0.006 0.089 0.119 0.011 0.161 0.076 0.151 -0.130
(7) Rio Torto 0.002 -0.310** -0.075 0.028 0.199 -0.115 -0.040 0.302** -0.010 0.248* -0.036 0.123 -0.065
(8) Barcelos -0.001 -0.238* -0.057 0.133 -0.002 0.012 0.351** 0.054 -0.219 0.192 0.080 0.065 0.095
(9)S.M.Montanha 0.054 -0.209 -0.106 0.157 0.103 -0.085 0.197 0.172 -0.131 0.030 0.001 0.141 -0.023
(10) Folgares -0.046 -0.273* -0.151 0.041 0.029 -0.222 0.050 0.264* -0.047 0.236* -0.017 0.169 0.074
(11) Amarante -0.046 -0.310** -0.195 0.142 0.089 -0.093 0.021 0.241* -0.107 0.098 0.038 0.192 0.069
(12) Escalhão -0.040 -0.203 -0.077 0.038 0.053 -0.170 -0.030 0.221 -0.028 0.252* -0.022 0.137 0.096
(13) Castro Daire -0.048 -0.258* -0.209 0.069 -0.039 -0.177 0.186 0.273** -0.013 0.248* 0.024 0.189 -0.025
(14) B.Burgães -0.163 -0.317** -0.202 0.079 -0.037 -0.047 0.348** 0.229 -0.068 0.212 0.142 0.195 -0.116
(15) Pinhel -0.023 -0.186 -0.190 0.087 0.166 -0.151 0.040 0.183 -0.019 0.207 -0.129 0.127 0.105
(16) Pega -0.072 -0.192 -0.065 -0.020 0.091 -0.160 -0.005 0.267** 0.154 0.313** -0.122 0.089 -0.056
(17) Almaça -0.129 -0.175 -0.171 0.146 0.094 -0.203 0.228 0.219 0.042 0.248* 0.011 0.060 0.010
(18) Covilhã -0.215 -0.307** -0.031 0.211 -0.021 -0.275** -0.059 0.242* 0.082 0.231* -0.030 0.147 -0.008
(19) Soure -0.129 -0.177 -0.152 0.111 0.048 -0.216 0.139 0.222 -0.028 0.207 0.003 0.015 0.022
(20) Ladoeiro -0.131 -0.114 -0.211 0.067 -0.029 -0.397*** -0.020 0.077 0.125 0.281** 0.028 0.072 0.249*
(21) R. Murta -0.154 -0.186 -0.207 0.134 -0.089 -0.231* 0.103 0.308** -0.016 0.258* -0.051 0.203 0.140
(22) V.V.Ródão -0.100 -0.211 -0.189 0.161 0.070 -0.345** 0.097 0.293** 0.019 0.273* 0.015 0.088 0.105
(23) Cela -0.210 -0.131 -0.183 0.186 -0.048 -0.168 0.321** 0.288** 0.010 0.175 0.021 0.013 -0.044
(24) Abrantes -0.147 -0.095 -0.221 0.083 0.058 -0.226 0.238* 0.210 -0.025 0.188 -0.016 0.191 -0.065
(25) Castelo Vide -0.014 -0.137 -0.176 0.091 -0.019 -0.325** 0.091 0.244* -0.137 0.245* -0.002 0.155 0.110
(26) Chouto -0.155 -0.134 -0.074 0.078 0.106 -0.220 -0.026 0.109 0.077 0.185 0.008 -0.040 0.110
(27) Pragança -0.278** -0.293** -0.152 0.158 0.035 -0.084 0.410*** 0.475*** 0.220 0.220 0.039 0.081 -0.174
(28) B. Caia 0.199 -0.001 0.030 -0.048 -0.142 -0.098 0.041 0.061 -0.329** 0.232* 0.360*** 0.044 0.048
(29) B.Magos -0.159 -0.180 -0.110 0.209 -0.082 -0.224 0.204 0.179 0.151 0.249* -0.104 0.024 0.099
(30) Pavia 0.256* 0.029 0.065 0.021 -0.167 -0.201 0.047 -0.068 -0.372*** 0.013 0.307** -0.004 0.216
(31) S.J. Tojal -0.130 -0.148 -0.128 0.168 0.057 -0.427*** 0.291** 0.237** 0.251* 0.194 -0.060 0.032 -0.021
(32) Vila Viçosa -0.131 -0.201 -0.243* 0.180 0.125 -0.233* 0.216 0.324** 0.120 0.185 -0.016 -0.043 0.083
(33) Moinhola -0.126 -0.124 -0.123 0.041 0.095 -0.109 0.310* 0.256* 0.075 0.228 -0.011 -0.005 -0.059
(34) Reguengos -0.065 -0.171 -0.242* 0.226 0.184 -0.277** 0.053 0.162 0.036 0.150 -0.102 0.065 0.107
(35) V. Alentejo -0.129 -0.175 -0.171 0.146 0.094 -0.203 0.228 0.219 0.042 0.248* 0.011 0.060 0.010
(36) Grândola -0.096 -0.187 -0.181 0.167 0.110 -0.170 0.427** 0.255* 0.296* 0.180 -0.081 0.110 -0.154
(37) Serpa -0.100 -0.162 -0.161 0.108 0.071 -0.035 0.333* 0.203 0.168 0.259* -0.071 0.067 -0.183
(38) Relíquias -0.161 -0.179 -0.129 0.254* 0.097 -0.268* 0.419** 0.337** 0.106 0.009 -0.049 0.093 0.020
(39) Castro Verde -0.164 -0.184 -0.177 0.127 0.014 -0.518*** 0.251 0.377*** 0.195 0.134 -0.002 0.151 -0.018
(40) M. Longo 0.200 0.069 -0.508*** 0.352** 0.182 0.188 0.117 -0.025 0.158 -0.230 -0.283** -0.148 -0.034
(41) B. Bravura -0.248* -0.209 -0.158 0.083 0.010 -0.003 0.555*** 0.249* 0.216 0.097 0.054 0.207 -0.159
(42) S.B. Alportel -0.263* -0.233* -0.148 0.101 0.103 -0.288** 0.452*** 0.180 0.258* 0.158 -0.019 0.151 -0.135
Table 4 Synthesis of monthly precipitation and PCI trends (%)
Precipitation (1960-2011)
Negative trend Positive trend
ns 0.1 0.05 0.01 ns 0. 1 0.05 0.01
J 47.6 21.4 23.8 7.2
F 19.0 28.6 40.5 9.5 2.4
M 50.0 23.8 21.4 4.8
A 52.4 45.2 2.4
M 71.4 2.4 26.2
J 40.5 11.9 38.1 7.1 2.4
J 31.0 35.7 7.0 11.9 14.4
A 9.5 66.7 9.5 9.5 4.8
S 47.6 4.8 4.8 4.8 35.7 2.4
O 14.3 85.7
N 90.4 2.4 2.4 4.8
D 64.3 35.7
Precipitation (1960-2011)
Negative trend Positive trend
ns 0.1 0.05 0.01 ns 0. 1 0.05 0.01
J 81.0 4.8 2.4 9.4 2.4
F 66.6 14.2 14.4 4.8
M 88.0 4.8 2.4 4.8
A 4.8 90.5 2.4 2.4
M 31.0 69.0
J 62.0 7.1 11.9 7.1 11.9
J 19.0 45.2 11.9 16.7 7.1
A 4.8 52.4 16.7 21.4 4.8
S 42.9 2.4 2.4 45.2 7.1
O 2.4 59.5 33.3 4.8
N 47.6 2.4 45.2 2.4 2.4
D 11.9 88.1

ns: Without statistical significance; Significant at 0.1, 0.05 and 0.01 level.

In May and September, a negative trend predominated in 74% and 62% of the time series, whilst an opposite precipitation trend was revealed for April and December: around half of the stations presented a negative trend and the other half a positive trend. In spatial terms, the trend towards an increase occurred mainly in the southernmost region of Portugal, whereas the decreasing trend coincided with the centre and north of the country.
Conversely, positive trends were found for August (90%), October (86%) and July (70%). Nevertheless, in October none featured at the 0.1 significance level. In the other months, around 35% of stations, in July, and 25%, in August, showed positive statistically significant tendencies.
With regard to the Precipitation Concentration Index (PCI), i.e. the intra-annual distribution of precipitation, 22 stations presented positive trends and 20 stations negative trends (Tables 3 and 4). Only one station (Ladoeiro) had a positive statistically significant trend. Although no definite trend pattern was evident, this opposite behaviour suggests some patterns not previously identified. In fact, even though the annual trend in precipitation amount was negative overall, more than half of the udometric stations registered a more marked seasonality in precipitation during the period 1960-2011.
Negative trends dominated the monthly series for January (88%), February (95%), March (95%) and June (88%). The overall decline in PCI in the winter months correlated with the decrease in average precipitation for this season. Conversely, an increase in precipitation concentration can be observed in April (95% of the time series), July (81%), August (95%), October (98%) and December (88%). This trend is statistically significant for about half of the rain stations in July (36%) and August (43%). However, despite the general trend towards a greater concentration in October, only 40% of the stations are statistically significant. An opposite trend was observed in the precipitation concentration time series for May, September and November: around 70% of the stations revealed a positive trend in May whereas in September and November half indicated a positive trend and the other half a negative trend. In spatial terms, a more homogeneous positive trend occurred in the southernmost region of mainland Portugal (Table 3).

4.2 Influence of geographical features on precipitation and concentration

Figure 4 provides scatter plots of annual precipitation and concentration versus altitude, latitude and longitude. Latitude emerges as the most important of the three variables governing the geographical distribution of mean annual precipitation, followed by altitude. With regard to the spatial distribution of PCI in mainland Portugal, latitude is also the most powerful influence, explaining approximately 72% of the variance observed in the intra-annual distribution of precipitation.
Figure 4 Correlations between altitude, latitude and longitude and mean annual precipitation and concentration (PCI).
Correlations between the annual trends for precipitation amount and concentration and geographical features are shown in Figure 5 and Table 5. According to the results obtained, latitude is the main factor influencing the spatial variation in the annual trends recorded for precipitation during the studied period, whilst longitude has a more significant correlation with the spatial trend observed in PCI. Both correlations are negative, meaning that the udometric stations with more marked decreasing trends in yearly precipitation are mainly located in the highest latitude, i.e. the northernmost regions of Portugal. On the other hand, the trend towards greater irregularity in intra-annual precipitation distribution was found mainly in the stations further away from influence of the Atlantic Ocean, in the lowest longitudes.
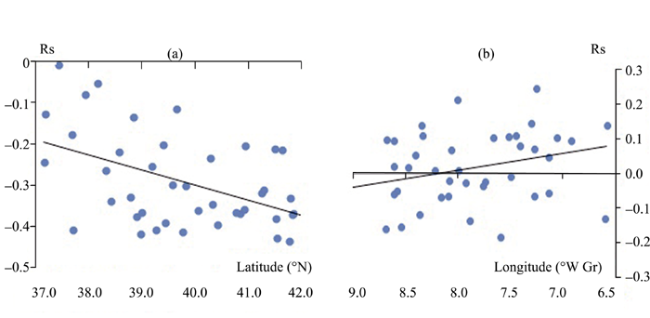
Figure 5 Spearman correlation (Rs) between trends in annual precipitation and latitude (a) and PCI trends and longitude (b)
Table 5 Correlation between precipitation trends (PT) and PCI trends and the geographical features
PT J F M A M J J A S O N D Year
Altitude 0.144 -0.078 0.087 -0.049 0.089 -0.149 -0.478* -0.09 -0.091 0.042 -0.240 0.347* -0.054
Latitude -0.128 -0.490 0.079 -0.512** -0.405** 0.276* -0.492** -0.405** -0.696** -0.100 0.009 0.090 -0.422**
Longitude -0.457** -0.153 -0.263 0.067 -0.154 0.300 0.696** 0.191 0.099 -0.170 0.118 -0.356* -0.049
PCI J F M A M J J A S O N D Year
Altitude 0.130 -0.249 0.105 -0.189 0.172 -0.020 -0.501** -0.072 -0.138 0.135 -0.202 0.397** 0.097
Latitude 0.315* -0.534** 0.342* -0.305* -0.191 0.376* -0.441** -0.187 -0.678* 0.123* 0.330* 0.367* 0.194
Longitude -0.379* 0.048 -0.112 0.301 -0.157 0.099 0.727** 0.247 0.203 -0.221 0.171 -0.204 -0.305**

** Significant at 0.01 level; * Significant at 0.05 level

An analysis of the correlation between long-term trends in precipitation on a monthly level and the three geographical features (Table 5) reveals strong negative relationships between latitude and the precipitation trend for February, April, May, July, August and September. The influence of longitude on the monthly precipitation trend is statistically significant for two months: January, with negative indications, and July, with positive indications.
With regard to monthly trends in precipitation concentration (Table 5), an opposite inter-correlation was obtained for the influence of latitude: a negative correlation was found for February, April, July and September and a positive coefficient for January, March, June, November and December. The relationship between altitude and monthly trends in precipitation concentration is only significant for July and December. A positive inter-correlation between longitude and the July PCI trend was observed, whereas the January PCI reveals a negative relationship with this variable.

5 Discussion

Annual precipitation in mainland Portugal can be described as highly irregular, both in spatial and temporal terms. Great irregularity can also be observed in inter and intra-annual distribution. During the period analysed (1960-2011), a general pattern of a decrease in the annual precipitation amount was recorded in mainland Portugal, based on a stations analysis. In fact, the majority of the udometric stations showed a consistent negative trend, which was more pronounced in the central and northernmost regions of the country. The results obtained for monthly trends reveal an overall decrease in precipitation quantity in November, January, February, March and June, together with a general increase in July, August and October. The aforementioned negative trends in precipitation affected the late autumn period and the whole of the winter, i.e. the wettest period of the year. These results concur with the findings of other researchers working on a regional level, who have reported a decline in precipitation across the Mediterranean basin, particularly during the wet season (Buffoni et al., 1998, 1999; de Luis et al., 2009; Esteban-Parra et al., 1998; González-Hidalgo et al., 2010; Kadioğlu et al., 1999; Paredes et al., 2006; Philandras et al., 2011; Piervitali et al., 1998; Tomozeiu et al., 2002; Xoplaki et al., 2000; Xoplaki et al., 2004).
A significant decrease in precipitation during the wet period can have severe consequences on the hydrological cycle and water supply, both for ecosystems and societies. In fact, a change in precipitation quantity results in changes in runoff and affects the groundwater recharge rates which, in turn, have an impact on the water supply. In terms of agricultural demand, both rainfed crops and irrigated cultures may face a soil-moisture deficit associated with lower precipitation. Changes in runoff also have a significant effect on the output of hydropower generation.
Concerning the influence of geographical features, latitude is the most important variable governing spatial distribution and variations in annual precipitation, as well as its intra-annual changeability, specifically in February and between April and September. In fact, several studies have shown that precipitation in the Mediterranean basin is influenced by large-scale atmospheric circulation (Brunetti et al., 2002; Corte-Real et al., 1995; López-Bustins et al., 2008; López-Moreno et al., 2011; Rodríguez-Puebla et al., 2001; Trigo and Palutikof, 2001; Vicente-Serrano et al., 2010), and also by local or regional characteristics, such as elevation and topography (Acero et al., 2011; Hidalgo-Muñoz et al., 2011; Lionello, 2012).
North Atlantic Oscillation (NAO) is one of the dominant atmospheric patterns in the temporal evolution of precipitation (Xoplaki et al., 2004; Mariotti and Dell’Aquila, 2012; López-Moreno et al., 2011; Angulo-Martínez and Beguería, 2012) and its relevance for surface climate variability is well known in relation to many regions in the western Mediterranean area, such as Portugal (Corte-Real et al., 1998; Trigo and Da Camara, 2000). According to Mariotti and Dell’Aquila (2012), the NAO index reveals a positive long-term trend, in particular since the 1970s. Since the negative phase of these indices is associated with frontal conditions that trigger rainfall in the Mediterranean basin, the more frequent occurrence of positive phases after 1970 may explain the drying trends reported for several regions, as well as for Portuguese territory as a whole (Trigo et al., 2000; Trigo and da Camara, 2000). Positive phases in the NAO index represent an increase of the Atlantic meridional sea level pressure gradient, which contributes to strength zonal flows (López-Moreno et al., 2011).
Such strengthening is responsible for the increased moist and warm advections to northeast Europe, producing warm and humid conditions over Scandinavia and part of northern Russia, but losing progressively such effect toward southern and eastern Europe. This causes warm and wet winters in northern Europe and drier than normal winters in the south. Mariotti et al. (2002) consider, however, that the impact of the NAO on precipitation shows a decreasing influence in the southern and eastern sectors of the Mediterranean basin.
On the other hand, the analyses of the effects of the NAO on precipitation confirm the major influence of the winter NAO on precipitation in the Mediterranean mountain areas, particularly in the mountains of the Iberian Peninsula (López-Moreno et al., 2011). These findings coincide with our results, in which the large negative trends were found particularly in the northern highlands.
On an annual scale, the precipitation concentration in Portugal can be described as irregular in the south and moderately irregular in the central and north-western areas. A more complex behaviour pattern was found for the Precipitation Concentration Index (PCI): around half of the stations indicated a trend towards greater irregularity in intra-annual precipitation distribution, whilst the other half revealed a trend towards lower irregularity. Only one station showed significant time trends when using the Spearman rank correlation coefficient.
The results obtained for monthly trends seem to be more homogenous: a negative trend was observed between January and March, and a positive trend was recorded for most stations during summer and, in particular, autumn (especially in October). This positive trend in PCI may have important consequences, specifically in terms of the potential of precipitation to cause soil erosion (Nunes et al., 2014). According to González-Hidalgo (1996), precipitation concentration is one important factor which leads to erosivity. Stormy precipitation, chiefly at the end of summer and the beginning of autumn, can encourage sediment yield transport and strongly affect the sustainability of Mediterranean ecosystems, particularly if they are affected by other disturbances such as forest fires (Albaladejo 1995; Pérez-Trejo 1994) or if extensive areas are cultivated with rainfed cereals (Roxo and Casimiro, 2004; Nunes et al. , 2010, 2011).
The changes in annual and monthly PCI appear to be related to local factors affecting precipitation concentration trends (de Luis et al., 2011). In fact, although the intra-annual distribution of precipitation is greatly influenced by latitude, the annual trends observed for the PCI were more significantly determined by longitude.

6 Conclusions

The analysis of correlations among spatial patterns of annual and monthly precipitation and concentration trends and some geographical features were performed. Main findings include the following:
(1) A decrease in annual precipitation amounts is the general tendency observed in mainland Portugal, since the 1960s. The degree of decrease in precipitation is more significant in the highest latitudes, i.e. in the central and northern areas of the country, particularly in the wettest region.
(2) At monthly level, significant negative trends could be confirmed during winter months for almost all the stations, while July, August and October increases in precipitation prevailing, although only few stations showed statistically significant trends.
(3) Concerning to intra-annual variability, evaluated by PCI, only one station showed significant time trends when the Spearman rank correlation coefficient was applied. However, the positive tendency observed in more than half of the udometric stations suggested a more marked seasonality for precipitation during the analysed period. April, July, August and October showed a general trend towards a greater concentration.
The aforementioned changes in precipitation (amount and intra-annual distribution) may have a strong influence on natural processes such as runoff and soil erosion, modifying fluvial regimes, groundwater recharge and water availability, or in biomass productivity and forest fires spread. Even though past precipitation trends are not indicative of future trends, the results obtained from this study may be very important for the Portuguese Water Planning Agency, since the implications of the changes described may have important economic and environmental effects that could be greater than climatic change itself.

The authors have declared that no competing interests exist.

1
Acero F J, García J A, Gallego M C, 2011. Peaks-over-Threshold study of trends in extreme rainfall over the Iberian Peninsula.J. Climate, 24: 1089-1105.

2
Albaladejo J, 1995. Soil rehabilitation and desertification control: Case study in Murcia. In: Fantechi R, Peter D, Balabanis P et al. (eds.). Desertification in a European Context: Physical and Socio-economic Aspects (pp. 213-224), Report EUR 15415 EN.

3
Alexandersson H, Moberg A, 1997. Homogenization of Swedish temperature data. Part I: Homogeneity test for linear trends.Int. J. Climatol., 17: 25-34.

4
Angulo-Martínez M, Beguería S, 2012. Trends in rainfall erosivity in NE Spain at annual, seasonal and daily scales, 1955-2006.Hydrology and Earth System Science Discussions, 9: 1-25.

5
Apaydin H, Erpul G, Bayramin Iet al., 2006. Evaluation of indices for characterizing the distribution and concentration of precipitation: A case for the region of Southeastern Anatolia Project, Turkey.J. Hydrol., 328: 726-732.

6
Bartzokas A, Lolis C J, Metaxas D A, 2003. A study on the intra-annual variation and the spatial distribution of precipitation amount and duration over Greece on a 10-day basis.Int. J. Climatol., 23: 207-222.

7
Brunetti M, Maugeri T, Nanni N, 2002. Atmospheric circulation and precipitation in Italy for the last 50 years.Int. J. Climatol., 22: 1455-1471.

8
Buffoni L, Maugeri M, Nanni T, 1998. Analysis of Italian monthly precipitation series. In: Lemmela R, Helenius N (eds.). Proceedings of the 2nd International Conference on Climate and Water (1090-1098) Espoo, Finland.

9
Buffoni L, Maugeri M, Nanni T, 1999. Precipitation in Italy from 1833 to 1996. Theory of Applied Climatology, 63: 33-40.

10
Carvalho A, Flannigan M D, Logan Ket al., 2008. Fire activity in Portugal and its relationship to weather and the Canadian fire weather index system.International Journal of Wildland Fire, 17: 328-338.

11
Corte-Real J, Qian B, Xu H, 1998. Regional climate change in Portugal: Precipitation variability associated with large-scale atmospheric circulation.Int. J. Climatol., 18: 619-635.

12
Corte-Real J, Zhang X, Wang X, 1995. Large-scale circulation regimes and surface climatic anomalies over the Mediterranean.Int. J. Climatol., 15: 1135-1150.

13
de Luis M, Brunetti M, Longares L A, 2011. Precipitation concentration changes in Spain 1946-2005.Nat. Hazards Earth Syst. Sci., 11: 1259-1265.

14
de Luis M, González-Hidalgo J C, Longares L A, 2010. Is rainfall erosivity increasing in the Mediterranean Iberian Peninsula?Land Degrad. Develop., 21(2): 139-144.

15
de Luis M, González-Hidalgo J C, Longares L Aet al., 2009. Seasonal precipitation trends in the Mediterranean Iberian Peninsula in second half of 20th century.Int. J. Climatol., 29: 1312-1323.

16
Diodato N, 2005. The influence of topographic co-variables on the spatial variability of precipitation over small regions of complex terrain.Int. J. Climatol., 24(3): 351-363.

17
Elagib N A, 2011. Changing rainfall, seasonality and erosivity in the hyper-arid zone of Sudan.Land Degrad. Develop., 22: 505-512.

18
Esteban-Parra M J, Rodrigo F S, Castro-Diez Y, 1998. Spatial and temporal patterns of precipitation in Spain for the period 1880-1992.Int. J. Climatol., 18: 1557-1574.

19
González-Hidalgo J C, 1996. Los índices de agresividad de la lluvia y su aplicación en la valoración de la erosión del suelo. Cuadernos Técnicos de la Sociedad Española de Geomorfología 10, Geoforma Ediciones, Logroño. (in Spanish)

20
González-Hidalgo J C, Brunetti M, de Luis M, 2010. Precipitation trends in Spanish hydrological divisions, 1946-2005.Climate Research, 43: 215-228.

21
Hidalgo-Muñoz J M, Argüeso D, Gámiz-Fortis S Ret al., 2011. Trends of extreme precipitation and associated synoptic patterns over the southern Iberian Peninsula.Journal of Hydrology, 409: 497-511.

22
Jacobeit J, 1987. Variations of trough positions and precipitation patterns in the Mediterranean area.Journal of Climatology, 7: 453-476.

23
Kadioğlu M, Tulunay Y, Borhan Y, 1999. Variability of Turkish precipitation compared to El Niño events.Geophys. Res. Lett., 26: 1597-1600.

24
Labajo J L, Piorno A, 2001. Regionalization of precipitation in Castilla and Leon. Analysis of its temporal behaviour. In: Brunet M, López D (eds.). Detecting and Modelling Regional Climate Change. New York Springer-Verlag: 163-174.

25
Lima M I P, Carvalho S C P, de Lima J L M P, 2010. Investigating annual and monthly trends in precipitation structure: an overview across Portugal.Nat. Hazards Earth Syst. Sci., 10: 2429-2440.

26
Lionello P, 2012. The Climate of the Mediterranean Region. From the Past to the Future. London: Elsevier, 592.

27
López-Bustins J A, Martin-Vide J, Sanchez-Lorenzo A, 2008. Iberia winter rainfall trends based upon changes in teleconnection and circulation patterns.Global and Planetary Change, 63(2/3): 171-176.

28
López-Moreno J I, Vicente-Serrano S M, Gimeno L Ret al., 2009. Stability of the seasonal distribution of precipitation in the Mediterranean region: Observations since 1950 and projections for the 21st century.Geophysical Research Letters, 36: L10703.

29
López-Moreno J I, Vicente-Serrano S M, Morán-Tejeda Eet al., 2011. Effects of the North Atlantic Oscillation (NAO) on combined temperature and precipitation winter modes in the Mediterranean mountains: Observed relationships and projections for the 21st century.Global Planet Change, 77: 62-76.

30
Mariotti A, Struglia M V, Zeng Net al., 2002. The hydrological cycle in the Mediterranean region and implications for the water budget of the Mediterranean Sea.J. Climate, 15: 1674-1690.

31
Mariotti A, Dell’Aquila A, 2012. Decadal climate variability in the Mediterranean region: Roles of large-scale forcings and regional processes.Clim. Dynam., 38: 1129-1145.

32
Martín-Vide J, López Bustins J A, 2006. The Western Mediterranean Oscillation and rainfall in the Iberian Peninsula.Int. J. Climatol., 26: 1455-1475.

33
Michiels P, Gabriels D, Hartmann R, 1992. Using the seasonal and temporal precipitation concentration index for characterizing monthly rainfall distribution in Spain.Catena, 19: 43-58.

34
Nunes A N, Almeida A C, Coelho C O A, 2011. Impacts of land use and cover type on runoff and soil erosion in a marginal area of Portugal.Applied Geography, 31(2): 687-699.

35
Nunes A N, Coelho C O A, Almeida A Cet al., 2010. Soil erosion and hydrological response to land abandonment in a central Inland area of Portugal.Land Degradation & Development, 21(3): 260-273.

36
Nunes A, Lourenço L, Vieira Aet al., 2014. Precipitation and erosivity in southern Portugal: Seasonal variability and trends (1950-2008).Land Degradation & Development. doi: 10.1002/ldr.2265.

37
Oliver J E, 1980. Monthly precipitation distribution: A comparative index.Professional Geographer, 32(3): 300-309.

38
Paredes D, Trigo R M, García-Herrera R, 2006. Understanding precipitation changes in Iberia in early spring: weather typing and storm-tracking approaches.J. Hydrometeorol., 7: 101-113.

39
Pérez-Trejo F, 1994. Desertification and Land Degradation in the European Mediterranean. European Commission, DG XII, Luxemburg.

40
Peterson T C, Easterling D R, 1994. Creation of homogeneous composite climatological reference series.Int. J. Climatol., 14: 671-679.

41
Philandras C M, Nastos P T, Kapsomenakis Jet al., 2011. Long term precipitation trends and variability within the Mediterranean region.Nat. Hazards Earth Syst. Sci., 11: 3235-3250.

42
Piervitali E, Colacino M, Conte M, 1998. Rainfall over the central-western Mediterranean basin in the period 1951-1995. Part I: Precipitation trends.Nuovo Cimento, C21: 331-344.

43
Prats S A, Malvar M C, Vieira D C S, 2013. Effectiveness of hydromulching to reduce runoff and erosion in a recently burnt pine plantation in central Portugal.Land Degradation & Development, doi: 10.1002/ldr.2236.

44
Ramos M C, Martínez-Casasnovas J A, 2006. Trends in precipitation concentration in the Penedès-Anoia region, NE Spain: Extreme events and dry periods. Climatic Change, 74: 457-474.

45
Rodó X, Baert E, Comin F A, 1997. Variations in seasonal rainfall in Southern Europe duirng the present century: Realtionships with the North Atlantic Oscillation and the El Nio-Sourthern Oscillation.Clim. Dyn., 13: 275-284.

46
Rodríguez-Puebla C, Encinas A H, Sáenz J, 2001. Winter precipitation over the Iberian peninsula and its relationship to circulation índices.Hydrol. Earth Syst. Sci., 5: 233-244.

47
Roxo M J, Casimiro P C, 2004. Long term monitoring of soil erosion by water Vale Formoso Erosion Centre - Portugal. In: SCAPE-Soil Conservation and Protection for Europe, 37-48.

48
Tomozeiu R, Busuioc A, Stefan S, 2002. Changes in seasonal mean maximum air temperature in Romania and their connection with large-scale circulation.Int. J. Climatol., 22: 1181-1196.

49
Trigo I F, Davies T D, Bigg G R, 2000. Decline in Mediterranean rainfall caused by weakening of Mediterranean cyclones.Geophys. Res. Lett., 27: 2913-2916.

50
Trigo R M, da Camara C, 2000. Circulation weather types and their impact on the precipitation regime in Portugal.Int. J. Climatol., 20(13): 1559-1581.

51
Trigo R M, Palutikof J P, 2001. Precipitation scenarios over Iberia: A comparison between direct GCM output and different downscaling techniques.J. Climate, 14: 4422-4446.

52
Vicente-Serrano S M, Beguería S, López-Moreno J Iet al., 2010. A complete daily precipitation database for North-East Spain: Reconstruction, quality control and homogeneity.Int. J. Climatol., 30(8): 1146-1163.

53
Xoplaki E, González-Rouco J F, Luterbacher Jet al., 2004. Wet season mediterranean precipitation variability: influence of large-scale dynamics.Clim. Dyn., 23: 63-78.

54
Xoplaki E, Luterbacher J, Burkard Ret al., 2000. Connection between the large-scale 500 hPa geopotential height fields and precipitation over Greece during wintertime.Climate Research, 14: 129-146.

Outlines

/