Orginal Article

Comparison of GCM-simulated isotopic compositions of precipitation in arid central Asia

  • WANG Shengjie ,
  • ZHANG Mingjun , * ,
  • CHEN Fenli ,
  • CHE Yanjun ,
  • DU Mingxia ,
  • LIU Yangmin
Expand
  • College of Geography and Environmental Science, Northwest Normal University, Lanzhou 730070, China

*Corresponding author: Zhang Mingjun, Professor, E-mail:

Author: Wang Shengjie, PhD, specialized in climate change and hydrological cycle. E-mail:

Received date: 2014-11-25

  Accepted date: 2015-03-02

  Online published: 2015-06-24

Supported by

National Natural Science Foundation of China, No.41161012, No.41461003

National Basic Research Program of China, No.2013CBA01801

Copyright

Journal of Geographical Sciences, All Rights Reserved

Abstract

The isotope-equipped GCMs (general circulation models) are useful tools to investigate the isoscape in precipitation and water vapor, especially for the regions without enough in-situ observations. To study the spatial distribution and seasonal variation of precipitation isotopic composition in arid central Asia, several isotope-equipped GCMs are applied, and the long-term observations in two stations are used to verify the GCM-simulated results. Generally, seasonality of isotopic composition can be well simulated in each GCM, and the values of δ18O in precipitation are larger in summer months (from April to October) and lower in winter months (from November to March). Higher latitude usually shows lower values of δ18O in precipitation, and lower latitude has higher values. The values of δ18O are relatively low in the eastern section, and higher in the western section. Among these simulations, ECHAM is good at describing the isotopic composition in the study region, which can be seen from the mean absolute error (MAE) and root-mean-square error (RMSE). The ECHAM-derived values of δ18O in precipitation positively correlate with the observed series, and the correlation coefficient based on ECHAM is the largest among these GCMs.

Cite this article

WANG Shengjie , ZHANG Mingjun , CHEN Fenli , CHE Yanjun , DU Mingxia , LIU Yangmin . Comparison of GCM-simulated isotopic compositions of precipitation in arid central Asia[J]. Journal of Geographical Sciences, 2015 , 25(7) : 771 -783 . DOI: 10.1007/s11442-015-1201-z

1 Introduction

The stable hydrogen and oxygen isotopes are widely-used tools in studies of regional and global hydrological cycle (e.g., Jouzel et al., 2013; Aemisegger et al., 2014; Chen et al., 2014). Atmospheric precipitation is a vital section in water circulation, and the stable isotopes in precipitation can reflect climatic and environmental information. In arid central Asia, the existing isotopic studies showed that the hydrogen and oxygen isotopes in precipitation were mainly controlled by air temperature (also known as temperature effect), instead of precipitation amount (Yao et al., 1999; Feng et al., 2013; Liu et al., 2014). The extremely arid condition may influence below-cloud secondary evaporation and local moisture recycling (Pang et al., 2011; Kong et al., 2013).
The spatial distribution of stable isotopes (also called isoscape) in precipitation can be spatially interpolated using observation network (West et al., 2010). However, the available observations in central Asia are still too limited in spatial coverage to understand the full isoscape for this arid region. For the areas without enough in-situ measurements, researchers have to use other approaches to acquire the isoscape, including stable isotope-equipped GCMs (general circulation models). After the initial use by Joussaume et al. (1984), a number of GCMs have been applied to investigate the regional and global isoscapes (e.g., Tindall et al., 2009; Risi et al., 2013; Sjolte and Hoffmann, 2014). The accuracy of the GCM- simulated results is related with the spatiotemporal resolution of models and the isotopic parameterization schemes. Usually, only one model is used in each publication of GCM-based simulations. The comparisons of simulated isotopes using different GCMs are necessary to assess the biases of modeled results and to select the optimal models for specific regions and periods (Sturm et al., 2010; Risi et al., 2012; Yao et al., 2013; Conroy et al., 2013).
In this study, based on the simulations of several isotope-equipped GCMs released by the second Stable Water Isotope Intercomparison Group (SWING2), the isoscape of δ18O in arid central Asia is investigated. To improve the knowledge of isotopic process in precipitation under an arid condition, the spatial distribution and seasonal variation of δ18O in precipitation for each model are compared, and slopes of local meteoric water line (LMWL) are also mentioned. In addition, two typical stations, Urumqi and Hotan, are selected to assess the modeled results.

2 Data and method

2.1 Study area

Because of the long distance to the surrounding oceans and the influence of huge mountains ranges, the marine moisture can be hardly transported to the central area of Eurasian continent (Figure 1a; the land cover is acquired from Natural Earth via http://www.naturalearthdata.com). As shown in Figure 1b (Hijmans et al., 2005), the annual mean precipitation for the arid area in central Asia is less than 150 mm (Chen, 2012). The air regime of this region is mainly controlled by the Westerlies in the Northern Hemisphere (Figure 2), and the westerlies and polar vapor are considered as the main sources for the limited precipitation (Araguas-Araguas et al., 1998; Tian et al., 2007). In central Asia, the high mountains usually have more precipitation than the low-lying basins and plains (Zhang and Zhang, 2006).

2.2 Data description

Stable Water Isotope Intercomparison Group is an international project to compare isotope- equipped GCMs simulated by different research teams, and contains the first and second stages until now, i.e., SWING (Noone, 2007) and SWING2 (Sturm et al., 2010). In this study, the simulated results of several GCMs are selected from the SWING2 list (available at http://www.giss.nasa.gov/projects/swing2), and the details about horizontal resolution are listed in Table 1. All these selected GCM simulations are forced with the sea surface temperature, and are expressed as δ value (i.e., δ18O and δD). As shown in Table 1, three simu- lations (ECHAM, LMDZ and isoGSM) are nudged with reanalysis data, and two simulations (LMDZ and MIROC) have free simulations. The similar nudge methods are described in previous studies (e.g., Yoshimura et al., 2008).
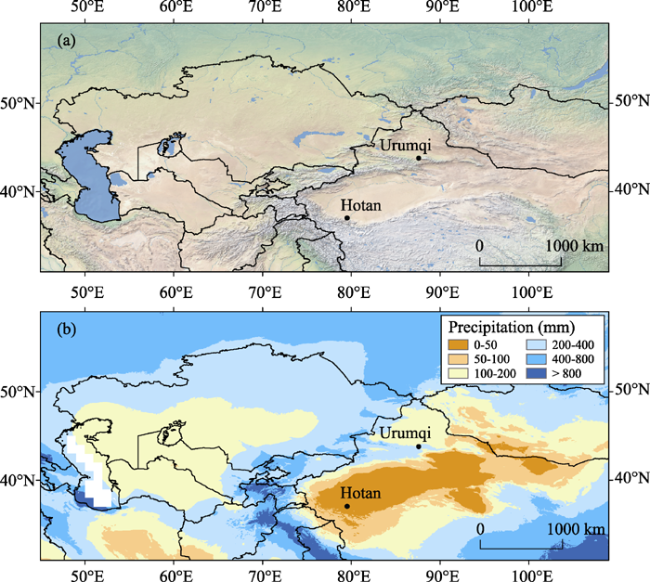
Figure 1 Spatial distribution of satellite-derived land cover with shaded relief (top) and annual mean precipitation during 1950-2000 (bottom) in arid central Asia
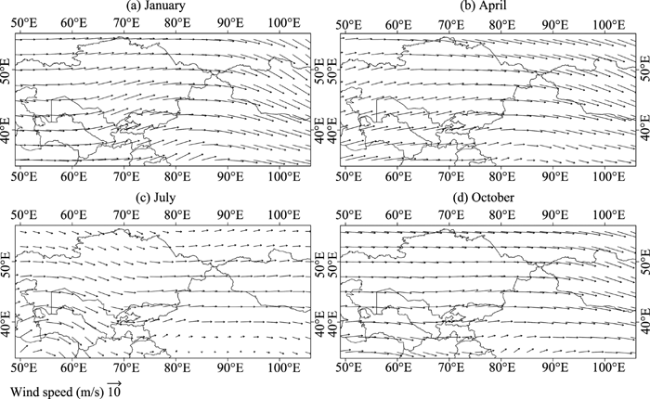
Figure 2 Spatial distribution of wind field at 500 hPa in January, April, July and October during 1981-2010 based on NCEP/NCAR Reanalysis 1
Table 1 Basic information of stable isotope-equipped GCMs used in this study
GCM Horizontal resolution
(latitude×longitude)
Simulation method Period Key reference
ECHAM 64×128 Nudged with ECMWF 1956-2001 Hoffmann et al., 1998
LMDZ 72×96 Nudged with ECMWF 1979-2007 Risi et al., 2010
LMDZ (free) 72×96 Free 1979-2007 Risi et al., 2010
MIROC (free) 64×128 Free 1979-2007 Kurita et al., 2011
isoGSM 94×192 Nudged with NCEP 1979-2007 Yoshimura et al., 2008
The monthly data of δ18O and δD in two stations in arid central Asia are used, including Urumqi (43.78°N, 87.62°E, 918 m, during 1986-1992, 1995-1998 and 2001-2003) and Hotan (37.13°N, 79.93°E, 1375 m, during 1988-1992). The long-term observations in the two stations are acquired from the Global Network of Isotopes in Precipitation (GNIP) database (IAEA/WMO, 2014). The locations of the two sites are also marked in Figure 1. The values in the nearest four grid boxes are weighted to the station location using IDW (inverse distance weighted) method (Shepard, 1968; Wang et al., 2015). Figure 3 shows the long- term mean of air temperature and precipitation in Urumqi and Hotan measured by the China Meteorological Administration during 1981-2010. The annual precipitation in Urumqi and Hotan are 298.6 mm and 43.9 mm, respectively, and the annual air temperature are 7.3℃ and 13.0℃, respectively.
Figure 3 Monthly mean of air temperature and precipitation during 1981-2010 in Urumqi and Hotan
The values of mean bias error (MBE), mean absolute error (MAE) and root-mean-square error (RMSE) were used in comparison between the observed and simulated isotopic composition in precipitation. The formulas of MBE, MAE and RMSE are
where 
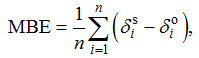
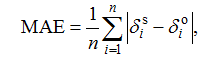
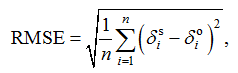
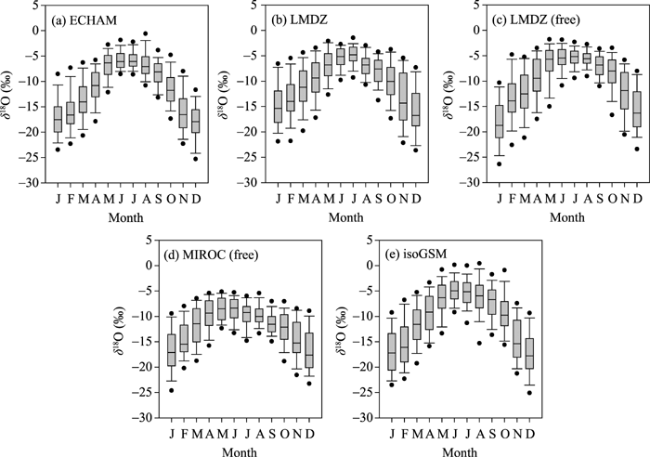
and are GCM-simulated and observed values of isotopic composition in precipitation, respectively.
Pearson’s correlation coefficient (r) and two-tailed t test were used to assess the correlation between the GCM-simulated and observed values.

3 Results and discussion

3.1 Seasonal variation and spatial distribution

Figure 4 shows monthly variation of stable isotopes in precipitation. Grid boxes within 35°-55°N and 50°-105°E were calculated. The strong seasonality can be seen in all the GCM-simulated results. According to seasonal variation of precipitation and air temperature in the study region, summer months are defined as months from April to October, and winter months are from November to March (Zhang and Deng, 1987; Zhang and Zhang, 2006). The values of δ18O are higher in summer months and lower in winter months. In most GCMs, June has the maximum median of δ18O value, and the minimum median value on a monthly basis can be seen in December and January.
Figure 4 Box plots showing the monthly variation of δ18O in arid central Asia derived from ECHAM, LMDZ, LMDZ (free), MIROC (free) and isoGSM
Figure 5 shows the spatial distribution of δ18O in January and July simulated from the isotope-equipped GCMs. Generally, the isoscapes derived from each GCM are similar. In January, the lower values of δ18O are mainly distributed in Tibetan Plateau and Mongolian Plateau, and the higher values usually lie at the southwestern part of the study area. The relatively low values can also be seen in the Tianshan Mountains from the simulations of ECHAM, LMDZ, LMDZ (free) and isoGSM. However, it should be noted that precipitation amount during winter months is relatively limited (as shown in Zhu et al., 2015). In July, the δ18O values less than -15‰ can only be found in MIROC (free) and isoGSM. For most areas in arid central Asia, the values of δ18O are larger than -10‰.
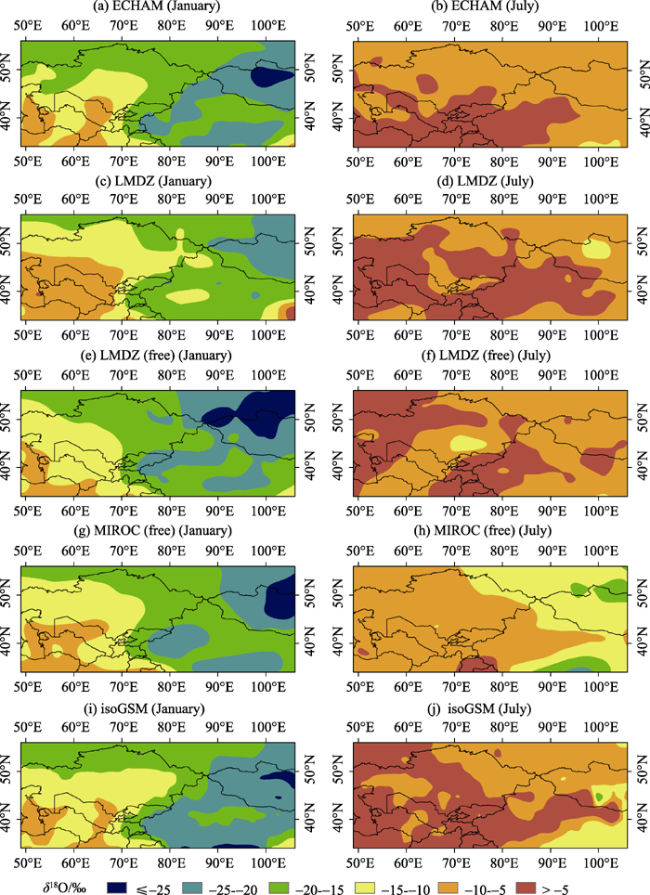
Figure 5 Spatial distribution of δ18O in arid central Asia derived from ECHAM, LMDZ, LMDZ (free), MIROC (free) and isoGSM in January (left column) and July (right column)
To show the spatial difference of the seasonality, the study region can be subdivided into two sections according to longitude and latitude, respectively (Figures 6 and 7). Generally, higher latitude (45°-55°N, i.e., northern section) usually has lower values of δ18O in precipitation, and lower latitude (35°-45°N, i.e., southern section) has higher values. The latitude dependency can be simulated in all the isotope-equipped GCMs. For the western (50°-75°E) and eastern (75°-105°E) sections, the seasonal variation of δ18O is also slightly different. Compared with those in winter months, the differences between the two longitude intervals in summer months are relatively small. In August, the values of δ18O in the western section are very close to those in the eastern section, which can be seen in most isotope-equipped GCMs.
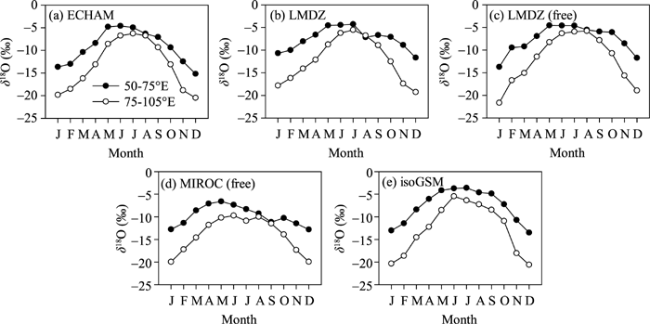
Figure 6 Monthly variation of average δ18O at different latitude intervals in arid central Asia derived from ECHAM, LMDZ, LMDZ (free), MIROC (free) and isoGSM
Figure 7 Monthly variation of average δ18O at different longitude intervals in arid central Asia derived from ECHAM, LMDZ, LMDZ (free), MIROC (free) and isoGSM

3.2 Local meteoric water line

Local meteoric water line (LMWL) states the correlation between stable hydrogen and oxygen isotope values in waters. Precipitations evaporating or mixing with evaporated surface water greatly influence the slopes and intercepts of LMWL. In the isotope-equipped GCMs, the slopes of LMWL range from 7.74 to 8.02 (Figure 8). The simulated result of LMDZ (free) has the maximum slope of 8.02. The intercepts of LMWL range between 7.75‰ (LMDZ) and 13.94‰ (isoGSM). Generally, the good correlations can be found in all the GCMs, and the values of r2 are all larger than 0.98.
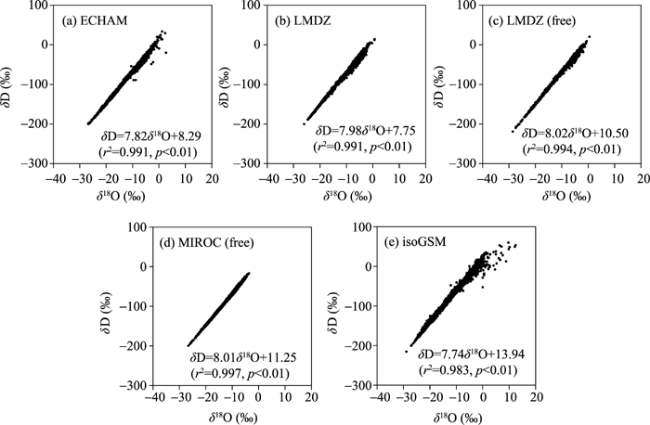
Figure 8 Correlation between δ18O and δD in arid central Asia derived from ECHAM, LMDZ, LMDZ (free), MIROC (free) and isoGSM
As mentioned in the above sections, the simulated isotopic composition shows strong seasonality. The seasonal difference can also be seen in the slopes and intercepts of LMWL (Table 2). In most GCM simulations, the slopes in summer months are lower than those in winter months. The intercepts in winter months are generally larger than 13, but those in summer months range between 7.32 and 11.77. The elevated slopes and intercepts of LMWL during winter months indicate an arid condition in these months. The seasonality in LMWL has been reported by previous studies (e.g., Gu, 2011), which coincides with simulation result in this study.
The spatial distribution of LMWL slope derived from isotope-equipped GCMs is presented in Figure 9. Compared with the spatial pattern of δ18O values, the distribution of slopes derived from different models are more complex. In ECHAM and LMDZ, low values (≤7.5) are mainly distributed in the western section, and the slopes of most parts in the eastern section are generally between 7.5 and 8.0. In LMDZ (free) and MIROC (free), the area with slopes below 7.5 is very limited. The spatial distribution simulated from isoGSM is generally different from that in other GCMs, and the longitude dependency is not obvious.
Table 2 Slopes and intercepts of LMWL during summer months (from April to October) and winter months (from November to March) in arid central Asia derived from ECHAM, LMDZ, LMDZ (free), MIROC (free) and isoGSM
GCM Summer months Winter months
Slope Intercept (‰) r2 Slope Intercept (‰) r2
ECHAM 7.74 7.32 0.968* 8.09 13.00 0.995*
LMDZ 8.10 7.44 0.978* 8.32 14.12 0.997*
LMDZ (free) 7.99 9.60 0.982* 8.29 15.41 0.998*
MIROC (free) 8.11 11.77 0.994* 8.11 13.41 0.998*
isoGSM 7.38 11.31 0.950* 8.13 20.09 0.992*

Note: * Statistically significant at the 0.01 level.

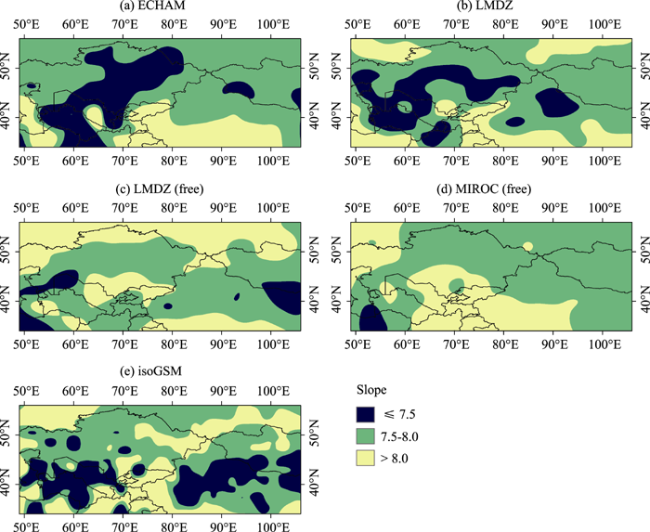
Figure 9 Spatial distribution of LMWL slope in arid central Asia derived from ECHAM, LMDZ, LMDZ (free), MIROC (free) and isoGSM

3.3 Case study in Urumqi and Hotan

Observed isotopic records in Urumqi and Hotan are used to assess the simulation results. Urumqi lies on the northern slope of the Tianshan Mountains, and Hotan is located at the western part of the Tarim Basin. In order to acquire the value of isotopic composition in the two sites, the nearest four grid boxes are weighted to the station location. Figure 10 presents simulated and observed isotopic values in Urumqi and Hotan. The seasonality of δ18O in precipitation can be simulated in each isotope-equipped GCM. In Urumqi, most results are no less than the observed values. In Hotan, the observed values of δ18O in summer months are larger than the modeled values. According to the monthly distribution of air temperature and precipitation (Figure 3), most precipitation occurs in summer months, and Hotan is much drier than Urumqi. In addition, the air temperature in Hotan is generally larger than that in Urumqi.
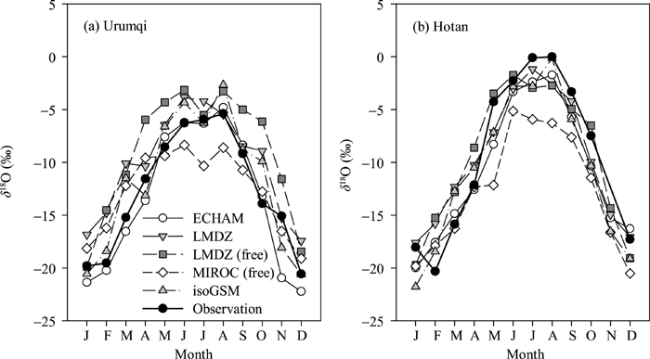
Figure 10 Monthly variation of δ18O in Urumqi and Hotan derived from observations, ECHAM, LMDZ, LMDZ (free), MIROC (free) and isoGSM
As is shown in Table 3, the observed values of δ18O positively correlate with simulated values in Urumqi and Hotan. Most isotope-equipped GCMs have r2 larger than 0.85. The values of MBE vary between -0.87‰ and 3.51‰ in Urumqi, and range between -3.02‰ and 0.25‰ in Hotan, respectively. In Urumqi and Hotan, MAEs modeled by ECHAM are 1.39‰ and 1.86‰, respectively, which are the least values among these GCMs. The minimum value of RMSE in Urumqi (2.01‰) can be seen in the result simulated by ECHAM. In Hotan, RMSE less than 2.5‰ can be simulated by ECHAM (2.12‰), LMDZ (2.33‰) and isoGSM (2.36‰). Generally, ECHAM is good at simulating isotopic composition of precipitation in Urumqi and Hotan. Previous studies using several isotope-equipped GCMs over eastern Asia (Zhang et al., 2011, 2012) also show a good simulation of ECHAM.
In previous studies (e.g., Yoshimura et al., 2008; Risi et al., 2010; Conroy et al., 2013), the effect of nudging is dependent on the locations and the specific models. According to the simulations of LMDZ and LMDZ (free) in this study (Table 3), the nudged result generally has less MAE and RMSE than the free simulation. In Urumqi, MAE reduces from 3.52‰ (free simulation) to 2.45‰ (nudged simulation), and RMSE reduces from 4.09‰ to 3.00‰. In Hotan, MAE (and RMSE) derived from the nudged and free LMDZ are 1.88‰ (and 2.33‰) and 2.36‰ (and 2.69‰), respectively.
The slopes and intercepts of LMWL simulated by the isotope-equipped GCMs are also shown in Table 4. The GCM-simulated slopes range from 7.43 to 7.85 which are larger than the observations. However, the simulated slopes in Hotan (between 7.80 and 8.20) are all less than the observed slope. In Urumqi, most GCMs (except LMDZ, -0.43‰) have larger LMWL intercepts than the observations. In Hotan, LMDZ and LMDZ (free) have less intercepts of LMWL than the observations. The simulated slopes and intercepts in Hotan are generally larger than those in Urumqi, which coincide with the observations in the two stations.
Table 3 MBE, MAE and RMSE of GCM-simulated δ18O in Urumqi and Hotan derived from ECHAM, LMDZ, LMDZ (free), MIROC (free) and isoGSM
GCM Urumqi Hotan
MBE (‰) MAE (‰) RMSE (‰) r2 MBE (‰) MAE (‰) RMSE (‰) r2
ECHAM -0.87 1.39 2.01 0.936* -0.91 1.86 2.12 0.952*
LMDZ 2.42 2.45 3.00 0.896* 0.25 1.88 2.33 0.934*
LMDZ (free) 3.51 3.52 4.09 0.864* 0.24 2.36 2.69 0.884*
MIROC (free) -0.07 2.17 2.40 0.853* -3.02 3.51 4.26 0.893*
isoGSM 0.55 2.12 2.20 0.895* -0.77 2.10 2.36 0.911*

Note: * Statistically significant at the 0.01 level.

Table 4 Slopes and intercepts of LMWL in Urumqi and Hotan derived from observations, ECHAM, LMDZ, LMDZ (free), MIROC (free) and isoGSM
GCM Urumqi Hotan
Slope Intercept (‰) r2 Slope Intercept (‰) r2
Observations 6.90 -0.30 0.996* 8.48 12.79 0.997*
ECHAM 7.68 6.20 0.999* 8.18 18.14 1.000*
LMDZ 7.43 -0.43 0.990* 8.03 10.47 0.999*
LMDZ (free) 7.62 4.60 0.993* 7.87 9.84 0.998*
MIROC (free) 7.85 9.55 0.998* 8.20 16.32 1.000*
isoGSM 7.69 15.08 0.995* 7.80 16.70 0.994*

Note: * Statistically significant at the 0.01 level.

The correlations between δD and δ18O in precipitation are related with evaporation, and lower slope of LMWL may indicate strong evaporation in raindrop falling (Gat, 1996). GCM-simulated slopes are higher in Urumqi and lower in Hotan, compared with observed values in the two sites. The differences indicate that the GCM-simulations may underestimate the rain evaporation in Urumqi and overestimate that in Hotan. However, the slope of LWML in Urumqi is lower than that in Hotan, which can be well simulated in each GCM. These findings may provide meaningful information about the applicability of different GCMs for this arid region.
Many processes may influence the accuracy of GCM simulations, and the difference in isotopic composition shown in these models is related with the parameterization in GCMs (Conroy et al., 2013). The hypothesis of details in isotope fractionation process in each GCM may be different from the actual condition. It should be noted that the gridded simulations reflect the mean level for each grid box, and the specific characteristics in a certain location may be smoothed. The spatial resolutions of output provided by SWING2 are not the same for different isotope-equipped GCMs, which may influence the simulated results. ECHAM and MIROC have the same resolutions, which are higher than LMDZ and lower than isoGSM.

4 Conclusions

In this paper, several isotope-equipped GCMs are applied to investigate the spatial distribution and seasonal variation of isotopic composition in precipitation over arid central Asia. Two GNIP stations with long-term precipitation isotopic records are also used to verify the GCM-simulated results.
(1) Generally, seasonality of isotopic composition in precipitation can be well simulated in each GCM, and the δ18O values are larger in summer months and lower in winter months. Higher latitude (45°-55°N) usually shows lower values of δ18O in precipitation, and lower latitude (35°-45°N) has higher values. On a longitude basis, the eastern section (75°-105°E) usually shows lower values of δ18O, and the values in the western section (50°-75°E) are relatively high.
(2) In the isotope-equipped GCMs, the slopes of LMWL range between 7.74 (isoGSM) and 8.02 (LMDZ-free), and the intercepts of LMWL range from 7.75‰ (LMDZ) to 13.94‰ (isoGSM). The intercepts in winter months are generally larger than 13, but those in summer months range between 7.32 and 11.77.
(3) Among all the simulations in this study, ECHAM is good at describing the isotopic composition of precipitation in arid central Asia. The ECHAM-derived values of δ18O positively correlate with the observed series, and have the largest correlation coefficients among these GCMs. The good simulation can also be seen from MAE and RMSE in Urumqi and Hotan.

The authors have declared that no competing interests exist.

1
Aemisegger F, Pfahl S, Sodemann Het al., 2014. Deuterium excess as a proxy for continental moisture recycling and plant transpiration.Atmospheric Chemistry and Physics, 14: 4029-4054.

2
Araguás-Araguás L, Froehlich K, Rozanski K, 1998. Stable isotope composition of precipitation over Southeast Asia.Journal of Geophysical Research, 103(D22): 28721-28742.

3
Chen L, Wang G C, Hu F Set al., 2014. Groundwater hydrochemistry and isotope geochemistry in the Turpan Basin, northwestern China.Journal of Arid Land, 6(4): 378-388. doi: 10.1007/s40333-013-0249-9.

4
Chen Xi, 2012. Retrieval and Analysis of Evapotranspiration in Central Areas of Asia. Beijing: China Meteorological Press. (in Chinese)

5
Conroy J L, Cobb K M, Noone D, 2013. Comparison of precipitation isotope variability across the tropical Pacific in observations and SWING2 model simulations.Journal of Geophysical Research: Atmospheres, 118(11): 5867-5892.

6
Feng Fang, Li Zhongqin, Zhang Mingjunet al., 2013. Deuterium and oxygen 18 in precipitation and atmospheric moisture in the upper Urumqi River Basin, eastern Tianshan Mountains.Environmental Earth Sciences, 68(4): 1199-1209.

7
Gat J R, 1996. Oxygen and hydrogen isotopes in the hydrologic cycle.Annual Review of Earth and Planetary Sciences, 24: 225-262.

8
Gu Weizu, 2011. Isotope Hydrology. Beijing: Science Press. (in Chinese)

9
Hijmans R J, Cameron S E, Parra J Let al., 2005. Very high resolution interpolated climate surfaces for global land areas.International Journal of Climatology, 25(15): 1965-1978.

10
Hoffmann G, Werner M, Heimann M, 1998. Water isotope module of the ECHAM atmospheric general circulation model: A study on timescales from days to several years.Journal of Geophysical Research, 103(D14): 16871-16896.

11
IAEA/WMO (International Atomic Energy Agency / World Meteorological Organization), 2014. Global Network of Isotopes in Precipitation.

12
Joussaume S, Sadourny R, Jouzel J, 1984. A general circulation model of water isotope cycles in the atmosphere.Nature, 311(5981): 24-29.

13
Jouzel J, Delaygue G, Landais Aet al., 2013. Water isotopes as tools to document oceanic sources of precipitation.Water Resources Research, 49(11): 7469-7486.

14
Kong Yanlong, Pang Zhonghe, Froehlich K, 2013. Quantifying recycled moisture fraction in precipitation of an arid region using deuterium excess.Tellus B, 65, 19251, doi: 10.3402/tellusb.v65i0.19251.

15
Kurita N, Noone D, Risi Cet al., 2011. Intraseasonal isotopic variation associated with the Madden-Julian Oscillation.Journal of Geophysical Research, 116, D24101, doi: 10.1029/2010JD015209.

16
Liu Jianrong, Song Xianfang, Yuan Guofuet al., 2014. Stable isotopic compositions of precipitation in China.Tellus B, 66, 22567, doi: 10.3402/tellusb.v66.22567.

17
Noone D, 2007. Assessing global model hydrology with simulations from the Stable Water-isotope INtercomparison Group. In: Cote J. Research activities in atmospheric and oceanic modeling, Report No.36. WMO, Vienna: 4-21.

18
Pang Zhonghe, Kong Yanlong, Froehlich Ket al., 2011. Processes affecting isotopes in precipitation of an arid region.Tellus B, 63(3): 352-359.

19
Risi C, Bony S, Vimeux Fet al., 2010. Water-stable isotopes in the LMDZ4 general circulation model: Model evaluation for present-day and past climates and applications to climatic interpretations of tropical isotopic records.Journal of Geophysical Research: Atmospheres, 115, D12118, doi: 10.1029/2009JD013255.

20
Risi C, Landais A, Winkler Ret al., 2013. Can we determine what controls the spatio-temporal distribution of d-excess and 17O-excess in precipitation using the LMDZ general circulation model.Climate of the Past, 9: 2173-2193.

21
Risi C, Noone D, Worden Jet al., 2012. Process-evaluation of tropospheric humidity simulated by general circulation models using water vapor isotopologues: 1. Comparison between models and observations.Journal of Geophysical Research, 117, D05303, doi: 10.1029/2011JD016621.

22
Shepard D, 1968. A two-dimensional interpolation function for irregularly-spaced data. Proceedings of the 1968 ACM National Conference, 517-524.

23
Sjolte J, Hoffmann G, 2014. Modelling stable water isotopes in monsoon precipitation during the previous interglacial.Quaternary Science Reviews, 85: 119-135.

24
Sturm C, Zhang Q, Noone D, 2010. An introduction to stable water isotopes in climate models: Benefits of forward proxy modelling for paleoclimatology.Climate of the Past, 6: 115-129.

25
Tian Lide, Yao Tandong, MacClune Ket al., 2007. Stable isotopic variations in west China: A consideration of moisture sources.Journal of Geophysical Research, 112, D10112, doi: 10.1029/2006JD007718.

26
Tindall J C, Valdes P J, Sime L C, 2009. Stable water isotopes in HadCM3: Isotopic signature of El Nino Southern Oscillation and the tropical amount effect.Journal of Geophysical Research, 114, D04111, doi: 10.1029/2008JD010825.

27
Wang Shengjie, Zhang Mingjun, Sun Meiping, et al., 2015. Comparison of surface air temperature derived from NCEP/DOE R2, ERA-Interim, and observations in the arid northwestern China: A consideration of altitude errors.Theoretical and Applied Climatology, 2015, 119(1/2): 99-111.

28
West J B, Bowen G J, Dawson T Eet al., 2010. Isoscapes: Understanding Movement, Pattern, and Process on Earth through Isotope Mapping. Dordrecht, the Netherlands: Springer.

29
Yao Tandong, Masson V, Jouzel Jet al., 1999. Relationships between δ18O in precipitation and surface air temperature in the Urumqi River Basin, East Tianshan Mountains, China.Geophysical Research Letters, 26(23): 3473-3476.

30
Yao Tandong, Masson-Delmotte V, Gao Jinget al., 2013. A review of climatic controls on δ18O in precipitation over the Tibetan Plateau: Observations and simulations.Reviews of Geophysics, 51(4): 525-548.

31
Yoshimura K, Kanamitsu M, Noone Det al., 2008. Historical isotope simulation using reanalysis atmospheric data.Journal of Geophysical Research, 113, D19108, doi: 10.1029/2008JD010074.

32
Zhang Jiabao, Deng Zifeng, 1987. Introduction of Precipitation in Xinjiang. Beijing: China Meteorological Press. (in Chinese)

33
Zhang Xinping, Sun Zhian, Guan Huadeet al., 2011. Intercomparison of δ18O in precipitation simulated by Isotopic GCMs with GNIP Observation over the East Asia.Procedia Environmental Sciences, 10: 1601-1612.

34
Zhang Xinping, Sun Zhian, Guan Huadeet al., 2012. GCM simulations of stable isotopes in the water cycle in comparison with GNIP observations over East Asia.Acta Meteorologica Sinica, 26(4): 420-437.

35
Zhang Xuewen, Zhang Jiabao, 2006. Xinjiang Meteorological Handbook. Beijing: China Meteorological Press. (in Chinese)

36
Zhu Xiaofan, Zhang Mingjun, Wang Shengjieet al., 2015. Comparison of monthly precipitation derived from high-resolution gridded datasets in arid Xinjiang, central Asia.Quaternary International, 358: 160-170.

Outlines

/