Orginal Article

Modeling the spatial distribution of urban population during the daytime and at night based on land use: A case study in Beijing, China

  • QI Wei , 1, 2 ,
  • LIU Shenghe , 1, * ,
  • GAO Xiaolu 1 ,
  • ZHAO Meifeng 1, 2
Expand
  • 1. Institute of Geographic Sciences and Natural Resources Research, CAS, Beijing 100101, China
  • 2. University of Chinese Academy of Sciences, Beijing 100049, China

*Corresponding author: Liu Shenghe (1967-), Professor, specialized in urban geography and land use. E-mail:

Author: Qi Wei (1989-), PhD, specialized in urban geography. E-mail:

Received date: 2014-05-26

  Accepted date: 2014-06-27

  Online published: 2015-06-15

Supported by

National Natural Science Foundation of China, No.41271174

National Science and Technology Support Program, No.2012BAI32B07

Copyright

Journal of Geographical Sciences, All Rights Reserved

Abstract

Urban population during the daytime and at night and their spatial distribution are important bases for planning urban infrastructure, public services and disaster relief. As current population statistics cannot distinguish urban population during the daytime from that at night, existed research in this field are quite limited. This paper tries to advance studies at this aspect by establishing a relationship model for the three components of ‘population, land use and time (daytime or night)’ to explore the temporal and spatial characteristics of different types of population, which is aimed to estimate urban population during the daytime and at night and to analyze their spatial characteristics at grid scale. Furthermore, an empirical case study has been carried out at the Haidian District in Beijing, China to test the model. The results are as follows: (1) The spatial structure of urban population during the daytime is significantly different from that at night. The spatial distribution of urban population during the daytime is more extensive and more agglomerated that that at night. (2) Several types of spatial coupling relationship between population during the daytime and that at night have been identified, such as sandwich mode, symmetry mode, convergence mode and single mode, etc. (3) The spatial distribution of daytime and nighttime population also reflects certain factors during the development of China, such as the distribution of old residential areas, the construction of new industrial districts, and the differences between urban and rural areas, which can provide reference points for studies in this field and other regional research.

Cite this article

QI Wei , LIU Shenghe , GAO Xiaolu , ZHAO Meifeng . Modeling the spatial distribution of urban population during the daytime and at night based on land use: A case study in Beijing, China[J]. Journal of Geographical Sciences, 2015 , 25(6) : 756 -768 . DOI: 10.1007/s11442-015-1200-0

1 Introduction

Population distribution has both spatial and temporal characteristics (Zhang, 1999). Daytime and nighttime are two basic temporal modes, especially for urban populations. Affected by self-organizing systems and urban planning, urban spatial structure presents a variety of functions. These functions include commuting, consumption, leisure, etc., which cause the differences in spatial distribution of urban population between daytime and nighttime. The urban population during the daytime and at night is not only an important indicator of the separation of workplace and residence but also a significant tool for urban commuter traffic management. Currently, concern about such temporal population differences is more meaningful. On the one hand, urban public safety and crises receive more attention, especially the layout for emergency shelters both during the daytime and at night (Guo, 2008). On the other hand, more and more migrants are gathering in cities (Liu et al., 2011). These immigrants occupy more workplaces and residences, forming their own spatial distribution during the daytime and at night. Therefore, understanding the urban population both during the daytime and at night could help us better understand the mechanisms of city evolution. However, there is a general lack of national statistics on populations during the daytime and at night, especially in developing countries such as China. Most censuses or official statistics are concerned more with the residential population in different administrative units but ignore the population during the daytime. Furthermore, there are few spatial databases for population during the daytime and at night that could support research and urban planning.
Louis Wirth (1964) differentiated population during the daytime and at night for the first time in the book entitled Urbanism as a Way of Life. Internationally, the main methods of modeling spatial distribution of the population during the daytime and at night include observation statistics (Foley, 1952, 1953), OD matrices (Akkerman, 1995), geographical unit statistics based on GIS (Kavanaugh, 1990), and estimation using traffic survey data (Roddis et al., 1998), mobile phone network data (Mao et al., 2010), or high-resolution remote sensing data (Elvidge et al., 2001; Sleeter et al., 2006; Yang et al., 2011). For many developed countries, most of the above methods could be used because of their mature databases (Bresse, 1949; McPherson et al., 2004; Kang, 2006; Collins et al., 2007) while other countries, such as China, do not have enough of a statistical foundation to measure population during the daytime and at night. Furthermore, because different countries have their own levels of urbanization and urban spatial structures, those methods may not be suitable for every city. Some researches about population during the daytime and at night in China have started (Chen et al., 1981; Huang, 2003; Kang, 2006; Zhao, 2010; Yang et al., 2011), which, however, rarely considered spatial perspective. Considering such questions, this paper focuses on the application of land use to the study of urban population during the daytime and at night. Different types of land use are indicators of urban spatial functions both during the daytime and at night. Moreover, urban land use is a common data source that can be obtained from land use surveys or remote sensing. As an important auxiliary method, spatialization, a geography technique, is also applied to the study of urban population during the daytime and at night. Population spatialization is a method that can simulate the spatial distribution of a population for a certain time and a certain area with specified parameters and models. This method could transfer existing statistical or census data of macroscopic spatial scale into that of microscopic scale (Meng, 2005).Traditional research on urban population distribution has tried to use this method without concern about the differences between daytime and nighttime. In view of this, this paper will develop a relational model of population and geographic space during day and night based on land use. A population spatialization model based on differentiated area weights will also be presented. This paper uses Haidian District, Beijing as a case study to model urban population during the daytime and at night and analyze its spatial-temporal characteristics.

2 Methodology

2.1 Methods

From the perspective of geography, a person can only exist in one place at a time and form a spatial and behavioral trajectory at different times. Temporal-spatial behaviors are similar among urban populations. On weekdays, the behaviors of the urban population include commuting, working, going to school, etc. during the daytime (7:00 am to 7:00 pm). Behavior is mainly home-based at night (7:00 pm to 7:00 am the next day). On weekends or holidays, in addition to travel, people usually stay at home, as with nighttime on weekdays. Different behaviors happen in different functional areas, which can be represented by land use type. Based on the above principles, this paper presents the following research methods.
(1) Building the relational model of ‘population - time (daytime and nighttime) - land use’. First, a relational model of ‘population - time (daytime and nighttime)’ should be built according to the division of the population. This model aims to estimate the total population during the daytime and at night. Then, according to the relationship between different population types and different land use types, this paper builds a relational model of ‘population - land use’ for both daytime and nighttime.
(2) Population spatialization. The relational model of ‘population - time (daytime and nighttime) - land use’ recognizes the dispersion of the population into areas with different types of land use. However, each area has its own shape and size, which is not fine enough for the study of urban population distribution. Population spatialization can divide an area into units of a grid. A uniform grid is helpful not only for detailed studies but also for reducing the impact of the MAUP effect.
(3) Integration of multi-source data. The distribution of the population during the daytime and at night involves in multiple elements such as time, space and population. Therefore, this paper integrates population data, land use data, structures data and grid data using spatial scale conversion and spatial topology calculation.

2.2 Models

2.2.1 The relational model of ‘population - time (daytime and nighttime)’
A city is an open space and also a floating space, with many people flowing in and out. There are also many internal flows of commuters between different urban areas, with a complex relationship between population and land use. According to the regular pattern of spatial displacement of people's daily activities, this paper divides population into three types: home population, pendulum population and random population.
(1) Home Population. This refers to those people who are mostly at home both day and night, including the elderly, infants, the unemployed, etc.
(2) Pendulum Population. This refers to those people who regularly go to the workplace (or school, etc.) during the daytime and go back home at night. This population contains workers, students, etc. The pendulum population can be divided into three subtypes from the perspective of a given district: 1) Local pendulum population, whose workplaces (or schools, etc.) and residences are both in the local district. 2) Out pendulum population, whose residences are in the local district but whose workplaces (or schools, etc.) are in another district. 3) External pendulum population, whose workplaces (or schools, etc.) are in the local district but whose residences are in another district.
(3) Random Population. This refers to those people appearing randomly, such as outpatients, inpatients, shoppers, guests and tourists. The random population can be divided into the local random population and the external random population. The portion of the local random population is too small to compare to the home population and the local pendulum population, so this paper ignores the subtypes of random population.
Therefore, the following model can be built for any local district:
where PD and PN denote the daytime and nighttime populations, respectively. H denotes the home population. L, O and E denote the local pendulum population, out pendulum population and external pendulum population, respectively. RD and RN denote the random population during the daytime and at night, respectively. W, S, and PR denote the worker, student and resident populations of the local district, respectively. Clearly, for a district of a city, its population and structure during the daytime and at night have a large difference. In addition, for multiple districts of a city, such differences in population number and structure could vary in both time and space.
2.2.2 The relational model of ‘population - time (daytime and nighttime)-land use’
Considering the differences of urban land use, the urban space can be divided into different spatial zones. Each type of land use is subject to the following model.
where i denotes each type of land use. The other parameters are the same as in formulas (1) and (2). Formulas (3) and (4) show that the sum of the population in different types of land use during the daytime or at night is equal to the sum of the total population during the daytime or at night. The land use categories of ‘The Second National Land Survey’ in 2008 can reflect types of urban land use. To reflect the land use structure during the daytime and at night, this paper refines and merges some categories of land use according to ‘The Standards of City Land Classification and Land Use Planning & Construction’ (GB50137-2011).The science & education category is divided into kindergarten, primary school, middle school, vocational school, the teaching areas of colleges and universities, the accommodations of colleges & universities and the staff dormitory areas of colleges & universities. The hotel& restaurant category is divided into two separate categories. Finally, this paper gives 14 types of urban land use, which are shown in Table 1. Workplaces are listed from I1 to I3, schools from I4 to I7, and residential lands from I9 to I11. The lands with frequent random population are from I12 to I13, and I14 lands have few people. According to human behavior, different types of land use can be matched with different types of population during the daytime and at night, including the home population (the elderly, infants, the unemployed), workers, students, and the random population (patients, guests, tourists). Therefore, the relational model of ‘population - time (daytime and nighttime)-land use’ are described in Table 1.
Table 1 The relational model of ‘population - time (daytime and nighttime) - land use’
Types of land use (I) Time
Daytime (D) Night (N)
I1 Farmland PD1 Working population of primary industry PN1 Nobody
I2 Industry & Mining &
Warehouse Land
PD2 Working population of secondary
industry
PN2 Nobody
I3 Commerce & Public
Management & Service Land
PD3 Working population of tertiary industry (Those staff in PD4, PD5, PD6, PD7, PD11, PD12, PD13 are not involved) PN3 Nobody
I4 Kindergarten Land PD4 Students and staff in kindergarten PN4 Nobody
I5 Primary School Land PD5 Students and staff in primary school PN5 Nobody
I6 Vocational School & Middle School Land PD6 Students and staff in vocational school
& middle school
PN6 Nobody
I7 Teaching & Research Land of
Colleges & Universities
PD7 Students and staff in colleges & universities PN7 Nobody
I8 Urban & Township Residential Land PD8 The elderly, infants, the unemployed
in urban areas & townships
PN8 Urban resident population
(Students in colleges & universities and inpatients are not involved)
I9 Rural Homestead PD9 The elderly, infants, the unemployed
in rural areas
PN9 Rural resident population
I10 Accommodations Land of
Colleges & Universities
PD10 Nobody PN10 Students in universities &
colleges
I11 Hotel Land PD11 Staff in hotels PN11 Hotel guests
I12 Hospital Land PD12 Staff, outpatients and inpatients PN12 Inpatients
I13 Scenic Land PD13 Staff and visitors PN13 Nobody
I14 Others PD14 Nobody PN14 Nobody

Note: I8 contains those staff dormitory areas of colleges & universities

2.2.3 The model of urban population spatialization by differentiated area weights
This model aims to map the urban population of land with different types of use onto a grid with the same spatial scale and shape. The method of area-weighted interpolation is widely used for spatialization of social and economic data, which is suitable for meso-scale study, such as for an administrative district (Ye, 2006; Zhang, 2010; Kuang, 2011). Assuming the area per person is same for the source zone of the same type, this method uses the percentage of area that the source zone occupies of the target zone to calculate an attribute number of the target zone. In this study, the target zone is the grid region and the source zone is the type of land use. For those grids near a boundary, the estimation value may have errors, which could not affect the overall research. Based on the existing research, this paper corrects the area weight, which is called the differentiated area weight. The model is as follows.
where Pj, Pi, 
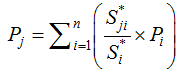
and denote the population in the j-th grid, the total population in the i-th type of land use, the area weight of the i-th type of land use in the j-th grid and the total area weight of i-th type of land use, respectively. In formula (5), substituting Pi for PDi or PNi gives us the population during the daytime or at night in a cell. As for the city, the geographical space is three-dimensional and the economic, plot ratio and economic attraction index should be the important part of the area weight. Therefore, different types of land use can be considered with different types of area weights. The land area is suitable for land use type I1. The building area is suitable for land use types I2 to I12 and is calculated by multiplying the basal area of a building by its number of floors. The economic area is suitable for I13, which is calculated by multiplying land area by the rank coefficient of the scenic spot. This rank coefficient is determined by tourists’ and visitors’ different ranks of the scenic spot according to ‘The Standards of Division and Assessing of Quality Grade of Different Scenic Spots’ (GB/T 17775-2003, Table 2).
Table 2 Scenic area’s rank coefficient
Scenic area’s rank Minimal number of tourists in a year Scenic area’s
rank coefficient
5A 0.6 million 60
4A 0.5 million 50
3A 0.3 million 30
2A 0.1 million 10
A 0.03 million 3

2.3 The case area and its data

This paper uses Haidian District, Beijing as a case study (Figure 1). Haidian District, an urban function expanding district located between the city center of Beijing (Dongcheng District, Xicheng District) and ecological conservation districts, is the agglomeration area of universities and high-tech industries. Therefore, Haidian District is a suitable case area to study population distribution during the daytime and at night, for it has developed both complete urbanization areas and developing semi-urbanization areas. It contains 22 sub-districts and 7 towns and townships with a total area of 430.8 km2. According to the 6th census in 2010, the total population of Haidian District is 3.28 million and the urbanization level is 97.8%. Most of the rural population is located in the northwest semi-urbanization areas, with mountainous terrain and farmland.
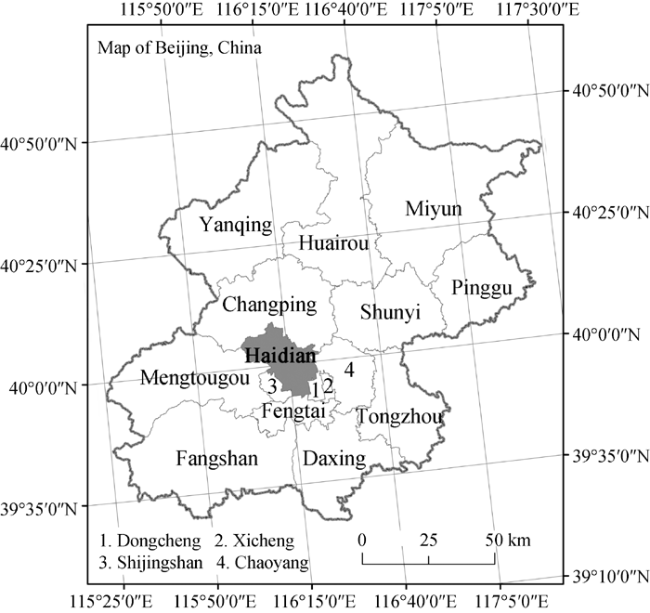
Figure 1 Location of Haidian District, Beijing
Resident population data were derived from the ‘The 6th National Census Data Bulletin of Haidian District’ and ‘The 6th National Census Data Bulletin of Beijing’ in 2010, which includes both local resident population and floating population but does not include the temporary population whose period of residence is six months or less. Working population data were derived from the corrected numbers of ‘The Second National Economic Census Data Bulletin of Haidian District’ in 2008. The correction aims to transfer data from 2008 into 2010, multiplying working population of enterprises above designated size in 2008 from ‘Beijing Haidian Statistical Yearbook 2009’ to a ratio. This ratio is calculated by dividing the total working population in 2008 from ‘The Second National Economic Census Data Bulletin of Haidian District’ by the working population of enterprises above a designated size in 2010 from ‘Beijing Haidian Statistical Yearbook 2011’. The 2010 special population data about schools, hospitals, and tourism are from the ‘Beijing Haidian Statistical Yearbook 2011’, ‘Beijing Statistical Yearbook 2011’ and ‘Beijing Regional Statistical Yearbook 2011’. Baby is defined as children under 4 years of age and elderly is defined as those over 60 years old. The random population for each day is calculated by dividing the data in the Statistical Yearbook on those such as visitors, hotel guests, and patients by 365. The spatial data are provided by the Beijing Institute of Surveying and Mapping, including a 1:10,000 geographic information database that contains roads, water, place names, and administrative boundaries, as well as 1:500 land use data of Haidian in 2010 which is modified based on land use survey data in 2008, 1:2000 building vector data, 1:10,000 hospital and school vector data. With the help of ArcGIS, 1876 grid cells of 250 m × 250 m have been generated. The intersect module in ArcGIS is used to build spatial matching relationship between grid regions, building data and land use data.

3 Results

3.1 Quantitative estimation results

The main parameters of the ‘population - time (daytime and nighttime) - land use’ model are given in Table 3, which contains the total area weights of different land use categories for daytime and nighttime. According to Table 3, the total population in the day and at night can be calculated based on formulas (3) and (4). The result shows that the daytime and nighttime total populations of Haidian District are 3.24 million and 3.30 million, respectively, with a ratio of 0.98. This ratio approaches 1, indicating the mixed function of Haidian District, with a balanced population inflow and outflow between day and night. Huang Rongqing used an index, calculated by dividing the working population of working land by the working population of residential land, to estimate this ratio for Haidian District. His answer was 0.99, which is close to the results here.
Table 3 Some parameters of the relational model of ‘population - time (daytime and nighttime) -land use’ in Haidian
Types of land use Population during the daytime Population at night The total area
weights
I1 Farmland 2290 0 58871726.5
I2 Industry & Mining & Warehouse Land 164059 0 6773584.0
I3 Commerce & Public Management
& Service Land
1747151 0 32029209.4
I4 Kindergarten Land 54441 0 203259.7
I5 Primary School Land 128724 0 632876.7
I6 Vocational School & Middle School Land 126868 0 1494705.7
I7 Teaching & Research Land of Colleges
& Universities
350997 0 10411515.0
I8 Urban & Township Residential Land 459861 2936960 71400902.7
I9 Rural Homestead 10335 72107 288723.6
I10 Accommodations Land of Colleges
& Universities
0 263256 2806573.0
I11 Hotel Land 48836 23444 2251014.3
I12 Hospital Land 43618 8347 1122445.8
I13 Scenic Land 102226 0 52263207.8
Total 3239406 3304114
Furthermore, the population and population density in each grid region can be calculated based on formula (5). Figure 2 shows the histogram of day and night population density in all 1876 grid regions. During the daytime, the maximum population density is 0.15 million/km2. Most of the other densities are within 0.05 million/km2, with a cumulative percentage of 97.3. At night, the maximum population density is 0.01 million/km2. Most of the other nighttime densities are also within 0.05 million/km2, with a cumulative percentage of 96.4. Clearly, there is high frequency in low value or zero value both during the daytime and at night because Haidian District is an urban-rural transitional zone. There is an abundance of mountains and agricultural land in the northwest area, with a low population density. Furthermore, both day and night histograms are right-skewed distributions. However, the peak value of population density during the daytime is higher, which shows a greater difference among population densities during the daytime.
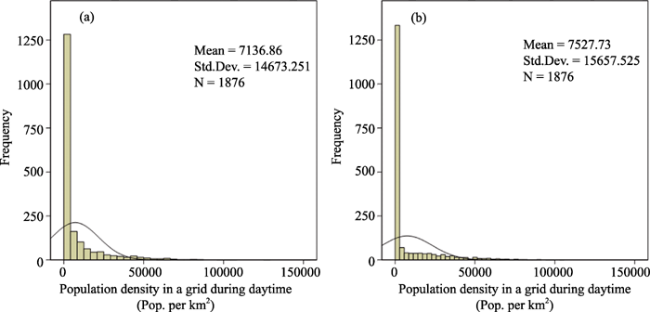
Figure 2 The histogram of population density during the daytime and at night

3.2 The spatial structure of daytime and nighttime population distribution in Haidian District

An isoline with the interval of 500 is used to visualize the spatialization result of population density, which is shown in panels (a) and (b), respectively, of Figure 3. Overall, the urban population density distribution shows a significant decay mode of ‘urban - suburban - outer suburban’ from southeast to northeast both during the daytime and at night. However, the population distribution during the daytime is wider than that at night. This result shows that the number of grid regions with zero population is 304 during the daytime and 1145 at night. There are more farmers and tourists in the northwestern outer suburban area during the daytime but fewer at night.
Turning to the southeast area, which has a high urbanization level, there is a large difference between daytime and nighttime population distributions. As Figure 3a shows, there is a significant daytime population agglomeration center, which is called Zhongguancun. Zhongguancun is the major information industrial center in Beijing and northern China. It is a high-tech industrial cluster and also a high-density employment center and shopping district. There are also several secondary population agglomeration centers, which are mainly located in a shopping center or sport center, such as Century City, Gongzhufen, Wukesong and Weigongcun. Universities also have a high population density during the daytime, which is also a key location condition for high-tech industrial clusters, such as Zhongguancun. In addition, there are several population agglomeration centers in the suburbs. Most of them are industrial parks, including Shangdi Information Industry Park, Zhongguancun Software Park, Yongfeng high-tech industrial base, China Sky City, Wenquan Science & Technology Park and Medical Technology Park. They are benefited from China’s urbanization for industry in recent years, which brings more people into the suburbs to work during the daytime. Overall, the daytime population distribution of Haidian District has a hierarchical spatial pattern of ‘single center-multiple second centers’, which is affected by unique spatial planning in China, such as industrial or college parks in the suburbs.
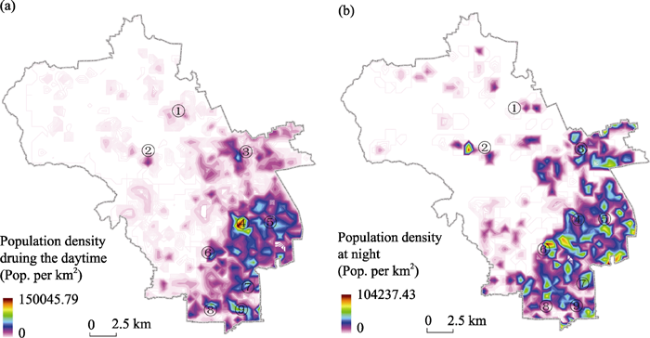
Figure 3 The histogram of population density during the daytime and at night

Note: 1. Yongfeng high-tech industrial base; 2. Wenquan Science &Techonology Park; 3. Shangdi Information Industry Park; 4. Zhongguancun; 5. University District; 6. Shijicheng; 7. Ganjiakou; 8. Wukesong; 9. Gongzhufen

However, the population distribution at night shows a scattered pattern in the southeast complete urbanization area, which is different from the hierarchical pattern during the daytime. As Figure 3b shows, the distribution of the population at night spreads significantly outward from downtown to the suburbs, which obeys the process of urban economy. Those population agglomerations at night in the suburbs are usually called ‘bedroom towns’ or ‘commuter towns’ in urban geography or urban planning. However, there are also several population agglomerations at night near the center of Beijing, mostly the accommodations of colleges & universities, the staff dormitory areas of colleges & universities and ‘the old residential area’. Cui Gonghao’s research noted that there are several ‘old residential areas’ between downtown and the industrial zones in China (Gu, 2012). Ding Richeng’s research also noted that the center of Beijing is mixed with many residential functions (Ding, 2004). This unique phenomenon benefits from the evolution of traditional spatial structure in Beijing and a high value for those houses near schools. Overall, the population distribution of Haidian District at night shows a scattered spatial pattern of ‘multiple centers’, which is affected by unique spatial planning in China, such as old residential areas.

3.3 The spatial coupling of population distribution during the daytime and at night in Haidian District

One of the spatial coupling indices of population distribution during the daytime and at night is based on mean value. As shown in Figure 4, Haidian District can be divided into four types according to the mean value of population density in all grid regions during the daytime ( 
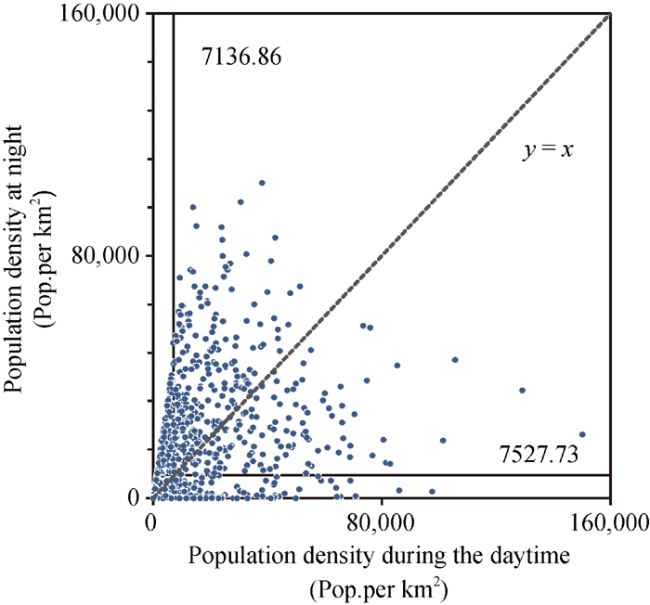
=7136.86) and at night ( = 7527.73). The types are DHNH (PD & PN ), DLNL (PD & PN< ), DHNL (PD< & PN≥ ) and DLNH (PD< & PN< ). As shown in Figure 5, DHNH areas are mainly distributed in the southeast side, with the function of living, working, and going to school. DHNL areas are mainly distributed in the scenic areas and industrial parks. DLNH areas are mainly distributed in ‘bedroom towns’ and ‘old residential areas’, suburban and rural settlements. DLNL areas are mainly distributed in the northwest side, with abundant farmland and mountains.
Figure 4 Schematic of types division method
Figure 5 The spatial types division based on mean value
Another spatial coupling index of daytime and nighttime population distribution is based on difference value. The grid can also be divided into three types according to the difference value of population density during the daytime and at night. As shown in Figure 4, taking the line y=x as a reference, the types are DD (daytime-dominant, y<x), ND (nighttime-dominant, y>x) and DNB (daytime- nighttime balanced, y=x). The isoline with the interval of 250 is used to visualize the spatialization result of population density difference, which is shown in Figure 6. The higher the positive value, the stronger the population activity is during the daytime, while the lower the negative value, the stronger the population activity is at night. Based on this rule, there are four typical spatial coupling modes. The first is the ‘sandwich’ mode, which forms an ‘ND-DD-ND’ spatial structure, such as ‘old residential area - commuter area - suburb’. The second is the ‘symmetry’ mode, which forms an ‘ND-DD’ spatial structure, such as ‘production area - residential area’ in industrial parks. The third is the ‘convergence’ mode, which is ND in the center and DD in the periphery, such as ‘rural settlement - farmland’ in outer suburban areas. The last mode is the ‘single’ mode, which forms only a DD or ND spatial structure, such as the scenic area or ‘bedroom towns’ in a suburb.
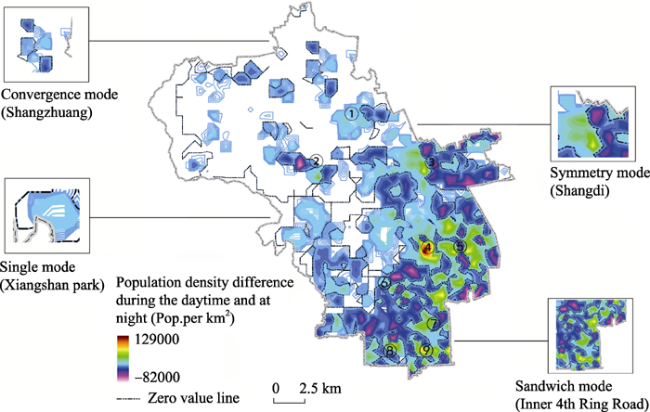
Figure 6 The spatial coupling map of population based on difference value during the daytime and at night in Haidian

Note: 1. Yongfeng high-tech industrial base; 2. Wenquan Science &Techonology Park; 3. Shangdi Information Industry Park; 4. Zhongguancun; 5. University District; 6. Shijicheng; 7. Ganjiakou; 8. Wukesong; 9. Gongzhufen

According to the spatial coupling conclusions above, the population movements during the daytime and at night can be summarized. From daytime to nighttime, most people spread out from the commuting area to bedroom towns in suburbs, while a small number of people flow into old residential areas or the staff dormitory areas of colleges & universities. In suburbs, there is a large flow from production areas into residential areas in industrial parks. Furthermore, the suburbs also absorb people from the city center. In the scenic area, tourists spread out, mostly into hotels. In outer suburban areas, farmers go back home. From nighttime to daytime, all the spatial processes above are reversed.

4 Conclusions

In order to estimate urban population during the daytime and at night and to explore their spatial characteristics, this paper establishes a relationship model for the three components of ‘population, land use and time (daytime or night)’ with the help of geographic spatialization method, and carries out an empirical case study at the Haidian District in Beijing, where has both developed complete urbanization area and developing semi-urbanization area. The main conclusions are listed as follows.
(1) Land use types can function as the core intermediary for the coupling relationship among ‘population, time and space’, which is actually the key for estimating urban population during the daytime and that at night. Once the coupling relationship table among ‘population - time (daytime and nighttime) - land use types’ has been established, it can be used not only to estimate the population number during the daytime and that at night, but also to explore their spatialization. While estimating the distributed population at different types of land use, different weight indices should be used for their area spatialization by fully considering the differences of factors such as floor area ratio, economic outputs, etc.
(2) The spatial structure of urban population during the daytime is significantly different from that at night. As a modern city, Beijing has certain characteristics similar to other large cities in the world. During the daytime, people gather in the center of the city to work or study. There are usually several population agglomeration centers with a hierarchical pattern, a small number of high population agglomeration centers and a majority of secondary population agglomeration centers. However, at night, the population distribution spreads significantly outward from city center to the suburbs, forming ‘bedroom towns’. The mean value and difference value between the populations of different grid regions during the daytime and at night could be used to identify the spatial coupling of the population during the daytime and at night. Some spatial structures, such as ‘sandwich’ mode, ‘symmetry’ mode, ‘convergence’ mode, and ‘single’ mode, could be identified according to continuous changes in space. Knowledge of those spatial structures would greatly contribute to spatial optimization and management in a city.
(3) The case study of Haidian District also reflects certain unique spatial characteristics of population distribution in China. The first is ‘old residential areas’. In many traditional and historical cities, such as Beijing, there are usually many people living in the centers of cities. Most of them are local citizens, enjoying old, inherited houses. The second is the University District. The urban plan in China always provides a large and concentrated area for universities. There are many universities gathered in Haidian District, such as Peking University and Tsinghua University. The students and the faculty’s families usually stay in the university both during the daytime and at night. The third is the industrial parks, which usually gather in large areas in the suburbs. This is promoted by China’s land economy; industrial parks bring large working populations during the daytime and resident populations at night, forming new population agglomeration areas.

The authors have declared that no competing interests exist.

1
Akkerman A, 1995. The urban household pattern of daytime population change.The Annals of Regional Science, 29(1): 1-16.

2
Bresse G W, 1949. The Daytime Population of the Central Business District of Chicago. Chicago: Chicago University Press.

3
Chen Kuanzheng, Xie Yusheng, 1981. The research on day-night population distribution and convection in Taipei Area. The Taipei City Government Research and Development Appraisal Commission. (in Chinese)

4
Collins A, Greaves S, 2007. Daytime population tracking for planning and pollution exposure assessment.Road & Transport Research Journal, 16(1): 55-68.

5
Ding Chengri, 2004. Is China’s urban population density high?City Planning Review, 28(8): 43-48. (in Chinese)

6
Elvidge C D, Imhoff M L, Baugh K Eet al., 2001. Night-time lights of the world: 1994-1995.Isprs J. Photogramm., 56(2): 81-99.

7
Floating Population Service Department of National Population and Family Planning Commission, 2011. The Report of China’s 2011 Floating Population Development. Beijing: China Population Press. (in Chinese)

8
Foley D L, 1952. The daily movement of population into central business districts.American Sociological Review, 17(5): 538-543.

9
Foley D L, 1953. Urban daytime population: A field for demographic-ecological analysis.Social Forces, 32(4): 323.

10
Gu Chaolin, 2012. Introduction to Human Geography. Beijing: Science Press. (in Chinese)

11
Guo Xiuyun, 2008. Urban public security and risk governance: An analysis of population migration and social inclusion.Urban Problem, (11): 6-11. (in Chinese)

12
Huang Rongqing, 2003. Beijing’s regional structure.Chinese Journal of Population Science, (5): 49-55. (in Chinese)

13
Kang Wenqin, 2006. On the character of downtown daytime population and its impacts on regional develop: A case study in Luwan District, Shanghai. Shanghai: East China Normal University. (in Chinese)

14
Kavanaugh Paul, 1990. A method for estimating daytime population by small area geography. San Diego Association of Governments, 1990 URISA Proceeding.

15
Kuang Wenhui, Du Guoming, 2011. Analyzing urban population spatial distribution in Beijing proper.Journal of Geo-Information Science, 13(4): 506-512. (in Chinese)

16
Liu Shenghe, Hu Zhang, Deng Yuet al., 2011. The regional types of China’s floating population: Identification methods and spatial patterns.Journal of Geographical Sciences, 21(1): 35-48.

17
Mao Xia, Xu Rongrong, Li Xinshuoet al., 2010. Fine grid dynamic features of population distribution in Shenzhen.Acta Geographica Sinica, 65(4): 443-453. (in Chinese)

18
McPherson T N, Brown M J, 2004. Estimating daytime and nighttime population distributions in US cities for emergency response activities. The American Meteorological Society.

19
Meng Bin, Wang Jinfeng, 2005. A review on the methodology of scaling with geo-data.Acta Geographica Sinica, 60(2): 277-288. (in Chinese)

20
Roddis S M, Richardson A J, 1998. Construction of daytime activity profiles from household travel survey data. Transportation Research Record 1625, TRB, National Research Council, Washington DC: 102-108.

21
Sleeter R, Wood N, 2006. Estimating daytime and nighttime population density for coastal communities in Oregon. In: Proceedings of the Annual Conference of the Urban and Regional Information Systems Association, Vancouver, Canada, 26-29 September, 2006.

22
Wirth Louis, 1964. Urbanism as a Way of Life. Chicago: Chicago University Press.

23
Yang Hai, Tian Yongzhong, Wang Bing, 2011. Simulation of urban population distribution during daytime based on the high resolution of RS and GIS.Journal of Anhui Agricultural Sciences, 39(2): 1129-1132. (in Chinese)

24
Ye Yu, Liu Gaohuan, Feng Xianfeng, 2006. Presentation of spatial distribution of population and its application.Journal of Geo-Information Science, 8(2): 59-65. (in Chinese)

25
Zhang Shanyu, 1999. Introduction to Population Geography. Shanghai: East China Normal University Press. (in Chinese)

26
Zhang Zimin, Zhou Ying, Li Qiet al., 2010. An estimation method of dynamic population within an urban local area.Journal of Geo-Information Science, 12(4): 503-509. (in Chinese)

27
Zhao Yeqin, 2010. International studies on “daytime population” and its implication for China.South China Population, 25(6): 24-31. (in Chinese)

Outlines

/