Orginal Article

An economic tie network-structure analysis of urban agglomeration in the middle reaches of Changjiang River based on SNA

  • SUN Qian , 1, 2 ,
  • TANG Fanghua , 3, * ,
  • TANG Yong 4
Expand
  • 1. School of Business, Central South University, Changsha 410086, China
  • 2. School of Business, Hunan City University, Yiyang 413000, Hunan, China
  • 3. School of Architecture and City Planning, Hunan City University, Yiyang 413000, Hunan, China
  • 4. School of Urban Management, Hunan City University, Yiyang 413000, Hunan, China

*Corresponding author: Tang Fanghua (1964-), PhD and Professor, E-mail:

Author: Sun Qian (1977-), PhD Candidate and Associate Professor, specialized in spatial economics and real estate economics. E-mail:

Received date: 2014-10-25

  Accepted date: 2015-01-18

  Online published: 2015-06-15

Supported by

National Natural Science Foundation of China, No.41371182

Key Project of Hunan Social Science Foundation, No.12ZDB01

Entrusting Project of Hunan Social Science Foundation Base, No.12JD12

Copyright

Journal of Geographical Sciences, All Rights Reserved

Abstract

Due to its great strategic significance in integrating regional coordinated development and enhancing the rise of Central China, urban agglomeration in the middle reaches of Changjiang (Yangtze) River has attracted much attention from both theoretical and practical aspects. Such research into the area’s economic network structure is beneficial for the formation of an urban- and regional-development strategy. This paper constructs an economic tie model based on a modified gravitation model. Subsequently, referring to social network analysis, the paper empirically studies the network density, network centrality, subgroups and structural holes of the middle reaches of Changjiang River’s urban agglomeration economic network. The findings are fourfold: (1) an economic network of urban agglomeration in the middle reaches of Changjiang River has been formed, and economic ties between the cities in this network are comparatively dense; (2) the urban agglomeration in the middle reaches of Changjiang River can be divided into four significant subgroups, with each subgroup having its own obvious economic communications, while there is less economic-behavioral heterogeneity among subgroups - this is especially true for the two subgroups that exist in the Poyang Lake Ecological Economic Zone; (3) an economy pattern driven by the central cities of Wuhan, Changsha and Nanchang has emerged in the urban agglomeration of the middle reaches of Changjiang River, while these three capital cities have exerted great radiation abilities to their surrounding cities, the latter are less able to absorb resources from the former; (4) the Wuhan Metropolitan Areas and the Poyang Lake Ecological Economic Zone have more structural holes than the Ring of Changsha, Zhuzhou and the Xiangtan City Clusters, meaning that cities at the periphery of these two areas are easily constrained by central cities. The Ring of Changsha, Zhuzhou and the Xiangtan City Clusters have fewer structural holes; thus, the cities in this area will not face as many constraints as those in the other two areas.

Cite this article

SUN Qian , TANG Fanghua , TANG Yong . An economic tie network-structure analysis of urban agglomeration in the middle reaches of Changjiang River based on SNA[J]. Journal of Geographical Sciences, 2015 , 25(6) : 739 -755 . DOI: 10.1007/s11442-015-1199-2

1 Introduction

With the introduction of collective competition National New-type Urbanization Plan as the primary competitive form, urban agglomeration, as the main force driving China’s urbanization, is considered to be essential for urbanization that maintains Chinese characteristics (Gu and Pang, 2011). Urban agglomeration relates not only to the explicit spatial structural combination of individual cities in a given cluster, but also to the tacit combination of related economy, society and culture among cities. Therefore, the economic factors of the cities in an agglomeration are highly interconnected, which is often seen as a very important feature for urban agglomeration. Nowadays, regional economy of urban agglomeration is increasing rapidly in China, thereby increasing the economic ties between cities. This trend has led to the formation of an urban economic mode that can be measured in terms of scale, structure and dynamics, presenting the urban economic system with more network-like features (Xiong, Liu and Yuan, 2006).
Considering the impact of an urban agglomeration’s spatial structure, existing urban agglomeration studies have implemented their research roadmap based on single cities, regional cities and city networks. Earlier studies into urban ties have focused mainly on economic ties among separate cities, and mainly utilize central (Losch, 1940), growth-pole, growth-center (Perroux, 1950), core-edge (Henderson and Mitra, 1996) and other theories. These theoretical studies have concentrated mainly on discussing the economic ties among intra-central cities, central cities and peripheral cities, or ties between central cities and their interiors.
Along with the evolutionary study of sole-center to multi-center, research into economic ties among urban agglomerations has developed from node-based (single-city-based) economic ties to regional economic ties (multi-city-based). Research perspectives have included the regional economic tie mechanism (Garreau, 1977; Glückler, 2007; Storper, 1997; Pred, 1977; Glaeser, 1999; Li, 1995) and the internal ties of individual cities in relation to a region’s traffic, industry, capital, information and technology (Bunnell et al., 2002; Matsumoto, 2004; Zhou et al., 2001; Zhu, 2003; Liu C, 2004).
Beginning with ties between cities, research into the whole-network of urban agglomeration has been prominent (Zhang et al., 2006). Urban agglomeration networks can be both explicit, such as aero networks (Matsumoto, 2004; Gu, 2008) and land traffic networks (Kim, 1999; Lv and Wang, 2011), and tacit, such as trade networks and information networks (Batten, 1995).
From previous studies, we know that research into whole-network urban agglomeration is still in its early stages, and that the main focus is on the formation of explicit networks and evolutionary mechanisms. With respect to the methodology used, previous studies have adopted a predominantly qualitative analysis, and seldom explored the dynamic network structure and interaction relations of individual cities among a given agglomeration. With the advancement of regional economic integration, all cities in an urban agglomeration need to have multi-edge ties with other cities from an economic perspective. For individual cities, emphasis must be placed on exploring the rationales of economic collaboration with other cities, and fulfilling co-existing development in an agglomeration. However, previous studies have ignored other studies into tacit networks within economic whole networks, and have focused even less on digging out the whole-network structure of economies, making it difficult to shed light on the inner rules of urban agglomeration in the context of mass urbanization in China. In order to fill this research gap, and to discover the inner rationales of urban agglomeration, this paper designs a modified gravitation method to construct an economic tie model, and uses social network analysis (SNA) as the main method by which to measure economic ties and network structures, in order to form an econometric model for urban agglomeration networks. In addition, with the aid of empirical study, this paper studies the economic network structures of urban agglomeration in the middle reaches of Changjiang River.

2 Methodology, research background and data source

2.1 Methodology

In order to construct a tacit network consisting of economic ties, it is first necessary to formulate an economic tie model and define some indicators to gauge the strength of those economic ties. Then, for the constructed whole network, we use SNA to measure the economic network structure.
2.1.1 Economic tie model
The quantitative analysis of network ties that has been adopted in previous agglomeration studies has been based on two methods: the experience method and the theoretical-model method (Gu, 2008). The experience method in relation to tie strengths between cities is realized principally by conducting on-site investigations, such as collecting data relating to aero-line passenger flow, volume of trade and vehicle flow. For this reason, the experience method is more suitable for a single-variable calculation in explicit networks. The theoretical-model method is a processing method that is constructed according to solid theoretical foundations and strict practical conditions. Though mainly abstracted from practice, the theoretical-model method is, when compared with the experience method, more theoretically reliable in construction, saves more time in calculation, and is more feasible in comprehensive analysis, which means that it is more widely used in theoretical studies.
Similar to the law of universal gravitation, in the theory of economic gravitation in economic dynamics, the economic ties among cities can be explained by the law of gravitation, and also follow the rule of decay with distance (Yang, 1989). This means that the tie strength between any two cities will decrease as the distance between them increases (Zhu, Wu and Zheng, 2008). Reilly (1931) was the first to use the gravitation model in economics. Zipf (1942) then adopted the gravitation model to city-system spatial-interaction analysis. Since then, the gravitation model has been widely adopted by researchers examining the effect of decay with distance and spatial interaction.
The basic model of gravitation is:
where Fij is the gravitation of city i and city j; Mi and Mj are the mass of city i and city j; Dij is the distance between city i and city j; b is the distance decay coefficient; and k is an experience constant.
Firstly, we will define the mass of cities. Our aim is to discuss the economic ties among cities; therefore, the mass of cities should be presented principally as the individual economic development level for every given city. Referring to previous studies, we use gross domestic production (GDP) as one important indicator for mass measurement (Wang and Zhuang, 1996). Human beings are considered to be the actors of economic ties among cities, so the population should also be taken as an important indicator (Taaffe, 1962). With the development of any city economy, the scale of a city is expanded both longitudinally and horizontally, and the level of expansion is obviously correlated with the land areas within it (Meng and Jia, 2000). Thus, we conclude that the development scale of a city is correlated with its regional population, regional area and regional economic scale.
Then, we measure the distance between cities. In physics, the measurement of distance is focused on the spatial distance. However, for economic ties, we cannot adopt spatial distance because cities are confined by actual traffic conditions. By way of substitution, we can define economic distance by calculating the traffic length (Niu et al., 1998) or traffic time (Meng and Lu, 2009). However, we still face some problems in calculating the traffic distance or traffic time because several types of traffic routes often exist for some cites. Nowadays, most traffic volume is attributed to highway transportation; thus, the total length of the highway is a very significant indicator of a regional transportation system. We therefore use the shortest highway length between two cities to measure the traffic distance. In addition, Taaffe (1962) empirically studied the decay coefficient for two cities, and demonstrated that the economic tie strength is inversely proportional to the square of distance between two cities, thus resulting in a distance decay coefficient of 2.
Considering the causality that exists between potential economic ties and actual economic ties between cities, the economic ties are directed, and ties between two cities are therefore not equivalent. For this reason, we use the ratio of every city’s GDP to the sum of two cities’ GDP to modify the experience constant, k.
Therefore, the economic tie strength is calculated using the following equation:
where Fij is the economic tie of city i to city j; Si and Sj are the areas of city i and city j; Pi and Pj are the populations of city i and city j; Gi and Gj are the GDP values of city i and city j; and Dij is the shortest highway distance between two cities.
2.1.2 Social network analysis
Taking the node tie as an analytical unit, the network analysis method is concerned principally with network structure, which is embodied by the ties among nodes. Network structure depicts the complex attributes of ties between the nodes, which will in turn show those nodes’ diversity compared to other nodes. Meanwhile, the network structure will affect the behaviors of the nodes in the network (Burt, 2000). With respect to the network formed by nodes as represented by the various cities in an agglomeration, the structures can be both social and economic, which means that an exploration of the network structure is of great significance in obtaining insight into the features of an agglomeration.
SNA is an important methodology that is used in sociology to reveal the features of interactions that occur between actors, making it a useful new paradigm in social-relation studies. SNA uses graph theory and algebra to depict the relation patterns in networks, and examines the effect on individual or collective actors’ behaviors (Haythornthwaite, 1996). Therefore, SNA is very suitable for studies in collective interaction and collective structure. Network theory takes the “tie” or “relation” between nodes or actors as the basic unit of analysis, and deems structure to be the actors’ behavior pattern, where structure can be both economic-tie-based and social- or political-tie-based (Liu J, 2004). The most important issue in SNA is how and to what extent the structure will affect the actors’ behavior.
SNA provides a useful tool for exploring the structure of an urban agglomeration network. With the aid of SNA and its software, we can clearly trace the process of the formation of, and interactions within urban agglomeration network structures, which makes the quantitative evaluation of network structures possible. Therefore, we will adopt SNA to quantify the urban agglomeration network structure. According to SNA, variables are concentrated mostly on network density, network centrality, subgroup and structural holes. Therefore, the next section will focus principally on these variables of urban agglomeration in the middle reaches of Changjiang River.

2.2 Research background

From the west of Yichang, Hubei Province, to the east of Hukou, Jiangxi Province, the middle reaches of Changjiang River has a total length of 955 km, and occupies a large part of Central China. In terms of administrative area, it covers the provinces of Hunan, Hubei and Jiangxi, in which some primary water bodies, such as Dongting Lake and Poyang Lake, are located. The region of the middle reaches of Changjiang River covers Jianghan Plain in Hubei Province, Dongting Lake Plain in Hunan Province, and Poyang Lake Plain in Jiangxi Province, making it the core area of China’s central region, as well as the engine that drives China’s economic development. This region is widely recognized for its abundance of land, mineral, and water resources. Some national transportation infrastructures, such as Zhegan Railway (from Hangzhou, Zhejiang Province, to Zhuzhou, Hunan Province), Jingguang Railway (Beijing to Guangzhou), Wujiu Railway (Wuhan to Kowloon) and Jingjiu Railway (Beijing to Kowloon), intersect here, and most cities in this region are connected by highways, thus making this region of China a very important traffic hub.
In order to enhance economic development in Central China, China’s government adopted the “Rise of Central China Plan” in 2004, and then implemented several national development strategies in regions such as the Wuhan Metropolitan Areas, the Ring of Changsha, the Zhuzhou and Xiangtan City Clusters, and the Poyang Lake Ecological Economic Zone. A conference about urban agglomeration in the middle reaches of Changjiang River was held in 2012 by the authorities of three provinces (Hunan, Hubei and Jiangxi), resulting in the consensus that urban agglomeration in the middle reaches of Changjiang River should center on three provincial capitals of Wuhan, Changsha and Nanchang, and constituted the cross-province area by combining the Wuhan Metropolitan Areas, the Ring of Changsha, Zhuzhou and Xiangtan City Clusters, and Poyang Lake Ecological Economic Zone (See Figure 1). The area surrounding the middle reaches of Changjiang River is famous for its excellent location, prosperous transportation system, comparatively well-developed industrial foundation and abundant science and technology resources, and is considered one of the most important urban agglomerations in China. According to Chinese National New-type Urbanisation Plan (2014-2020), it figures significantly in China’s development strategy, and will be regarded as the biggest urban agglomeration in China by 2020, as well as being the fourth pole of China’s regional economic development.
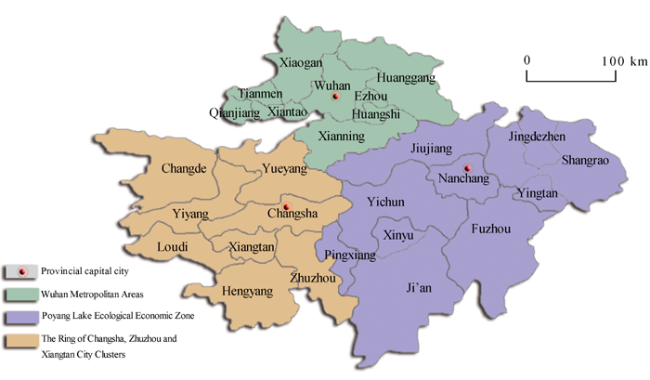
Figure 1 Diagram of the middle reaches of Changjiang River

2.3 Data source

This paper focuses on the cities in the Wuhan Metropolitan Areas, the Ring of Changsha, the Zhuzhou and Xiangtan City Clusters, and the Poyang Lake Ecological Economic Zone, with the researchers having collected data from the 27 cities, among which 9 cites of Wuhan, Huangshi, Ezhou, Huanggang, Xiaogan, Xianning, Xiantao, Tianmen and Qianjiang are located in the Wuhan Metropolitan Areas, 8 cities of Changsha, Zhuzhou, Xiangtan, Yueyang, Changde, Yiyang, Loudi and Henyang are located in the Ring of Changsha, the Zhuzhou and Xiangtan City Clusters, and 10 cites of Nanchang, Jiujiang, Jingdezhen, Yingtan, Shangrao, Wuzhou, Xinyu, Ji’an, Yichun and Pingxiang are located in the Poyang Lake Ecological Economic Zone. Of the 27 cities, three are provincial capitals, 21 are prefecture-level cities, and the remaining three are subprefecture-level cities. We take the 27 cities as the economic network nodes for urban agglomeration in the middle reaches of Changjiang River for network construction, thus making the scale of this network 27. In terms of the data source, we refer mainly to national statistics and local statistics yearbooks. The China City Statistics Yearbook 2010 was selected as the main data source, while the Hunan Statistical Yearbook 2010, Hubei Statistical Yearbook 2010 and Jiangxi Statistical Yearbook 2010 were introduced as complementary data sources.
We calculate the economic tie strength based on the economic tie model outlined in Section 2.1.1. In order to exclude closed loops in the networks, we set the tie strength of a city as 0. Taking 27 cities in the middle reaches of Changjiang River as the network nodes, we connect them according to the economic ties with a threshold value of 0. This value denotes that all economic ties, no matter how strong, will be presented wholly in the topology. The topology of economic networks is demonstrated in Figure 2.
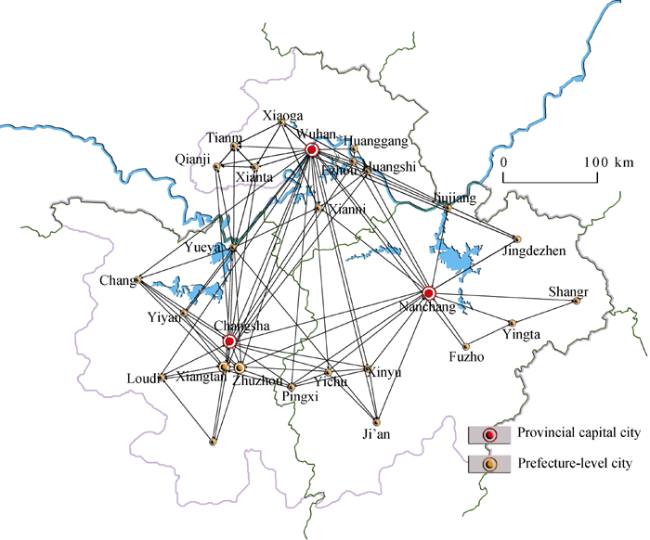
Figure 2 Network structure diagram of urban agglomeration in the middle reaches of Changjiang River (threshold value = 0)

3 Data measurement and results analysis

3.1 Network viscosity

Network viscosity is the influential force among network actors and the cohesive force in groups, and can be presented in terms of network density and network geodesic distance (Freeman, 1979). Network density reflects the closeness of ties among actors; thus, higher density means closer ties among actors. Geodesic distance is the shortest distance between two actors. Cohesion is calculated based on geodesic distance (distance-based cohesion); thus, stronger cohesion equates to the increased cohesive force within the network.
The measurement of network viscosity is illustrated in Table 1.
Table 1 Network viscosity measurement of urban agglomeration in the middle reaches of Changjiang River
Density/Distance Values
Density
Density (matrix average) 0.8376
Standard deviation 4.8759
Distance
Average distance (among reachable pairs) 2.166
Distance-based cohesion (“Compactness”) (Range 0 to 1; larger values indicate greater cohesiveness) 0.489
Distance-weighted fragmentation (“Breadth”) 0.511
We can see that the network density is at a comparatively high level of 0.8376, implying that the network has a huge impact on regional economic development and cooperation, and that the cities in the region have a high tendency for interaction, and thus benefit from the advantages of urban agglomeration. However, the ties among cities are affected by exchange costs, and the return to resource utilization is determined by the comparison of benefits and costs from economic ties; thus, the density value should be kept at a moderate level. Moderate network scale and density are helpful in an urban agglomeration’s coordination and sustainable development. Therefore, interactive effects and collaboration among similar cities should be reinforced. The standard error is 4.8759, indicating that the value of economic tie strength-variance among cities is high, and there exists a two-level difference in this region. In order to better reflect the variance in this region, we redrew the topology with the threshold value of 1 (Figure 3).
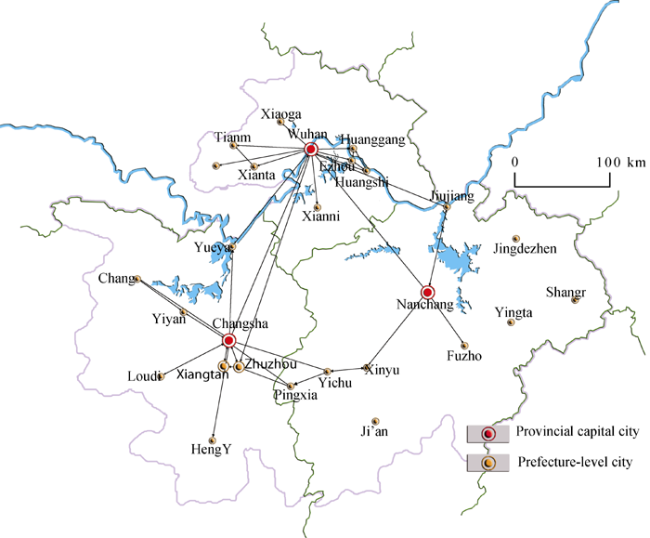
Figure 3 Network structure diagram of urban agglomeration in the middle reaches of Changjiang River (threshold value = 1)
As shown in Figure 3, some cities have very strong economic ties with surrounding cities. Wuhan, for instance, has strong ties with Huangshi, Xiaogan and Ezhou; Changsha has strong ties with Xiangtan and Zhuzhou. The cases above demonstrate that the central city has the ability to strongly radiate to adjacent cities. However, some prefecture-level cities, especially those in the Poyang Lake Ecological Economic Zone, are tied weakly to each other. The geodesic distance of this whole network is 2.166, demonstrating that, on average, every city should pass two to three nodes to connect the target city, and the economic communication among cities is to some extent confined. The distance-based cohesion is 0.489, signifying that the cohesive force is not at a high level.

3.2 The centrality-of-network measurement

Centrality is used to measure an actor’s central tendency in its network position, as well as its interaction advantages and disadvantages (Freeman, 1979). Centrality of network is discussed from two main perspectives: the node’s centrality, and the graph’s centralization. The node’s centrality quantitatively analyzes other nodes’ dependence on the designated node, and is represented by three indicators: degree centrality, closeness centrality and betweenness centrality (Freeman, 1979). Degree centrality is defined as the number of links incident upon a node. Thus, a higher value of degree centrality implies that the node has more power to connect other nodes directly, and this node remains more closely at the center of network, thus indicating that it has a higher social position and a greater privilege. Closeness centrality measures the dominant conditions for a given node, and only happens in a completed connected graph. However, this indicator is significantly correlated to the indicator of degree centrality, and is therefore seldom used in depicting the node’s centrality (Luo, 2010). Betweenness centrality signifies the sum of geodesic distances of one given node compared to other nodes. It is adopted to measure a node’s ability to be a betweenness centrality for other nodes. If a node has a high value of betweenness centrality, this node must be less dependent on other nodes. The centralization of any network is a measure of how central its most central node is in relation to how central all the other nodes are. Centralization measures therefore (1) calculate the sum in differences in centrality between the most central node in a network and all other nodes; and (2) divide this quantity by the theoretically largest such sum of differences in any network of the same size (Freeman, 1979).
We calculate all indicators of an urban agglomeration economic network in the middle reaches of Changjiang River using Ucinet 6. From the results, we observe that the outdegree centralization of economic network is 8.125%, and the indegree centralization is 3.579%. The values above are comparatively low, indicating that this region’s centralization is not obvious, and that most cities remain at a status of comparative equilibrium. The explanations for these results are that the urban agglomeration of the middle reaches of Changjiang River is composed of cities from three provinces, and that each province has its own central city, and thus the urban agglomeration has the configuration of a multi-center network. Betweenness centralization is 35.38%, denoting that the centralization reflected by the central media effect in the economic network is comparatively high; that is, that the number of cities located in the betweenness position and also capable of controlling resources is comparatively big; even the central cities in subgroups can be at betweenness positions, and could serve as hubs in connecting economic communications for other cities.
Table 2 displays the measurement of degree centrality and betweenness centrality for every city in the economic network.
Table 2 The centrality of the urban agglomeration economic network in the middle reaches of Changjiang River
ID Degree centrality Betweenness centrality
Sequence Outdegree centrality Sequence Indegree centrality Sequence Centrality
1 Wuhan 213.40 Huangshi 106.00 Wuhan 248.44
2 Changsha 104.30 Ezhou 77.00 Changsha 129.64
3 Huanggang 52.00 Xiangtan 74.00 Nanchang 118.60
4 Zhuzhou 48.00 Zhuzhou 57.00 Xiantao 49.35
5 Xiangtan 34.20 Huanggang 36.00 Zhuzhou 48.08
6 Ezhou 27.20 Xiaogan 26.00 Xiangtan 43.31
7 Nanchang 21.00 Yiyang 24.00 Xinyu 34.93
8 Huangshi 15.10 Xianning 21.00 Yueyang 20.27
9 Yueyang 11.30 Changsha 20.00 Pingxiang 6.87
10 Yichun 9.20 Xiantao 18.00 Yichun 6.63
11 Xiaogan 8.00 Wuhan 17.00 Huangshi 5.74
12 Changde 7.00 Pingxiang 13.00 Ezhou 5.41
13 Yiyang 6.40 Yueyang 10.00 Wuzhou 4.83
14 Jiujiang 6.30 Jiujiang 10.00 Yiyang 3.57
15 Xinyu 6.20 Tianmen 10.00 Changde 2.00
16 Xiantao 4.00 Yichun 9.00 Qianjiang 1.02
17 Henyang 4.00 Xinyu 9.00 Tianmen 0.33
18 Pingxiang 3.10 Changde 8.00 Huanggang 0.04
19 Tianmen 2.10 Nanchang 7.00 Loudi 0.03
20 Wuzhou 2.10 Qianjiang 7.00 Jiujiang 0.02
21 Qianjiang 2.00 Loudi 7.00 Xianning 0.02
22 Loudi 1.20 Henyang 5.00 Shangrao 0.02
23 Xianning 1.20 Wuzhou 5.00 Henyang 0.02
24 Shangrao 1.00 Ji’an 5.00 Xiaogan 0.01
25 Ji’an 1.00 Jingdezhen 3.00 Ji’an 0.01
26 Jingdezhen 0.40 Yingtan 3.00 Jingdezhen 0.01
27 Yingtan 0.30 Shangrao 1.00 Yingtan 0.01
We now focus on the centrality indicators in this region. Firstly, we look at the degree centrality, and the findings are as follows.
(1) Both indegree centrality and outdegree centrality display an obvious polarization trend. From the sequence in Table 2, we can see that the central cities of Wuhan and Changsha have a bigger outdegree centrality than other cities, illustrating that Wuhan and Changsha are positioned as the cores of the economic network, and that both of them have strong radiation abilities, so that they produce economic externalities for adjacent or surrounding cities. Comparatively, Jingdezhen’s and Yingtan’s outdegrees are 0.4 and 0.3, respectively, showing that they are far less capable of radiating to their surrounding cities. Similar characteristics appear in indegree centrality. Huangshi, Ezhou and Xiangtan have a high level of indegrees due to the fact that they are obviously affected by adjacent central cities (Wuhan and Changsha). However, some remote cities, such as Jingdezhen, Yingtan and Shangrao, have weak ties with other cities in the economic network, so they are neither capable of radiating to their surrounding cities, nor acquiring radiation from their surrounding cities.
(2) The centrality of the Wuhan Metropolitan Areas and the Ring of Changsha, Zhuzhou and Xiangtan City Clusters are obviously higher than that of the Poyang Lake Ecological Economic Zone. From the ranks of indegrees and outdegrees, we can summarize that the first ten biggest are all located in the Wuhan Metropolitan Areas and the center of the Ring of Changsha, Zhuzhou and Xiangtan City Clusters, while the last ten are located mainly in the Poyang Lake Ecological Economic Zone.
(3) When comparing the values of outdegree with indegree, we discover that only five cities (Wuhan, Changsha, Huanggang, Nanchang and Yueyang) have bigger outdegrees than indegrees. This result shows that these five cities impose bigger economic effects on their surrounding cities than they acquire from their surrounding cities. This is especially the case for the cities of Wuhan and Changsha, whose economic effects on other cities are far beyond those they receive from other cities, verifying their respective domination roles in urban agglomeration.
With respect to the betweenness centrality of every city, we can see that:
(1) Wuhan has far more betweenness centrality than other cities - almost twice that of the second city of Changsha - demonstrating that Wuhan is the center of urban agglomeration of the middle reaches of Changjiang River, and that it has very dense ties with other cities.
(2) The top three places in terms of betweenness centrality are Wuhan, Changsha and Nanchang, which are capital cities of Hubei, Hunan and Jiangxi provinces, respectively. This result shows that every capital city is the center of its province, which means that they can be regarded as being in a position of betweenness centrality in relation to other cities, and that they exert a great impact on communication and cooperation with other cities in their own provinces.
(3) The sum of betweenness centrality of all the cities in the urban agglomeration is 729, and the sum of first five cities occupies more than 70% of the total, while the last ten cites have a small quota of 0.1. Some cities, such as Yueyang, Yichun, Xiaogan, Changde, Yiyang, Jiujiang, Xinyu and Xiantao, have very slim betweenness centrality. Therefore, we can conclude that the betweenness centrality for all cites proximately follows normal distribution, and that the majority of economic ties are implemented by the betweenness cities such as Wuhan, Changsha and Nanchang.

3.3 Measurement of subgroups

The measurement of urban agglomeration subgroups aims to examine the small groups in an economic network based on cities’ economic tie strengths. Here, small groups are not city alliances, but densely connected economic teams. In these groups, the communication of economic resources is implemented with high frequency, making them more like relatives than others. We calculate the subgroups using the concor algorithm of Unicet. The measurement results show that from 2-plex, the urban agglomeration economic network has four subgroups; we recalculate this from 3-plex, and can obtain seven subgroups (Figure 3). We list the subgroup density and subgroup diagram in Table 3, Figures 4 and 5.
Table 3 Subgroup density of the urban agglomeration economic network in the middle reaches of Changjiang River
ID 1 2 3 4 5 6 7
1 16.667 8.238 0.444 0.167 0.400 0.556 0.333
2 1.095 0.286 0.095 0.036 0.000 0.000 0.000
3 0.222 0.238 1.000 0.583 0.000 0.222 1.000
4 0.000 0.000 0.083 0.167 0.000 0.000 0.000
5 0.444 0.190 0.333 0.000 2.667 20.833 1.667
6 0.067 0.114 0.000 0.000 0.400 1.067 0.000
7 0.000 0.000 0.833 0.000 0.000 0.500 2.000
From Table 3, Figures 4 and 5, we can draw the following conclusions.
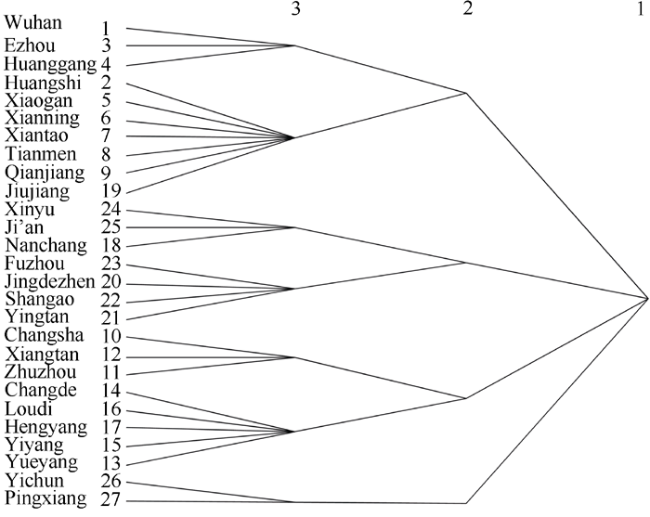
Figure 4 Subgroup of the urban agglomeration economic network in the middle reaches of Changjiang River (from 2-plex and 3-plex)
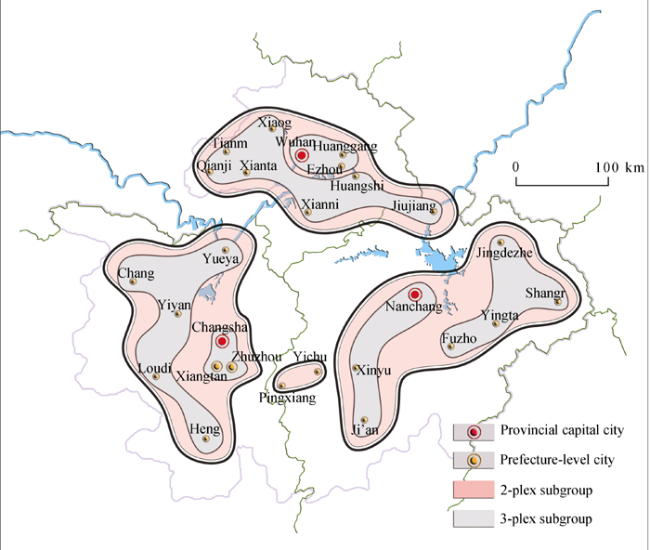
Figure 5 Subgroup diagram of the urban agglomeration economic network in the middle reaches of Changjiang River
(1) The nine cities administered by the Wuhan Metropolitan Areas belong to one subgroup when from 2-plex, and two subgroups when from 3-plex. The subgroup composed of Wuhan, Ezhou and Huanggang has the highest density value, and very strong radiation to the subgroup made up of the cities of Huangshi and Xiaogan. From the above, we know that the cities in the Wuhan Metropolitan Areas are densely tied to each other. Furthermore, the subgroup formed by Wuhan, Ezhou and Huanggang imposes economic radiation on six other subgroups. Because this subgroup is strongly tied to other cities in economic communication, and no other subgroups can compete with it, we can infer that the network development in the urban agglomeration is based mainly on the subgroup of Wuhan, Ezhou and Huanggang.
(2) Ten cities of this urban agglomeration are located in Jiangxi Province, which belong to four subgroups when from 3-plex, among which Jiujiang belongs to the second subgroup of the Wuhan Metropolitan Areas, and the subgroup of Yichun and Pingxiang are parallel to the subgroups of the Wuhan Metropolitan Areas and the Ring of Changsha, Zhuzhou and Xiangtan City Clusters from 2-plex. We can conclude that the Poyang Lake Ecological Economic Zone has not economically formed a significant urban agglomeration, and that the economic ties among the cities in this zone are not dense, which means that the central city has weaker radiation and diffusion effects in relation to its surroundings. Comparing the density values, we can see that the Poyang Lake Ecological Economic Zone has very slim economic ties with the Wuhan Metropolitan Areas and the Ring of Changsha, Zhuzhou and Xiangtan City Clusters. This is especially true in the case of the subgroup of Wuzhou, Jingdezhen, Shangrao and Yingtan, which only interacts significantly with the subgroup of Nanchang, Ji’an and Xinyu.
(3) The Ring of Changsha, Zhuzhou and Xiangtan City Clusters belong to one subgroup when from 2-plex, and two subgroups when from 3-plex, basically reflecting the formation of a “3+5” urban pattern in Hunan (the “3+5” urban pattern is the Ring of Changsha, Zhuzhou and Xiangtan City Clusters; here, “3” represents the three cities of Changsha, Zhuzhou and Xiangtan, and is the core of this cluster, and “5” represents the surrounding five cities of Yueyang, Changde, Yiyang, Loudi and Henyang). Furthermore, we find that the radiation from the subgroup of Changsha, Zhuzhou and Xiangtan to the surrounding five cities is the strongest in the urban agglomeration in the middle reaches of Changjiang River, verifying that the “3+5” urban pattern strategy taken by the Hunan Provincial authority has preliminarily succeeded. Changsha, Zhuzhou and Xiangtan have gradually become growth poles in Hunan Province, and are exerting their abilities in expanding the local economy and leading local development.

3.4 Measurement of structural holes

Burt (1992) found that structural holes represent the non-redundancy ties between two actors. In a network, the nodes that occupy the position of structural holes are bridges for resource exchange for other nodes; thus, they shoulder the broker positions. Structural holes dominate the flow of information and resources in the whole network, and are able to acquire resources in an efficient way. Two kinds of gauge are given to measure structural holes: the first is Burt’s measurement of structural holes, while the other is the measurement of betweenness centrality recommended by Freeman (1979). Burt’s measurement considers four indicators: effective size, efficiency, constraint and hierarchy, so this method is more influential in evaluating network’s information compared to Freeman’s method. Therefore, we take Burt’s method to measure structural holes.
Table 4 is the result of our measurement of structural holes. From this table we know that Wuhan, Changsha and Nanchang rank in the first three positions, indicating that these three cities have more non-redundancy ties, and that they have more efficient communication with other cities. For this reason, Wuhan, Changsha and Nanchang are more important in controlling and affecting economic resource communication. Hengyang, Yingtan, Jingdezhen and Shangrao have a value of less than two, showing that they have fewer ties with other cities. We can see that the value of efficiency in Wuhan is approaching 1, denoting that Wuhan’s effective size is close to its actual size. In addition, some other cities, such as Nangchan, Changsha, Ezhou and Huanggang, have efficiency values of 0.8 or above, demonstrating that all of these cities have comparatively important influences on other relative cities. It is worth noting that Hengyang and Xiaogan have efficiency values of less than 0.5, reconfirming that these two cities are not active in influencing other cities. From the constraint perspective, Nanchang, Wuhan and Yichun are valued at less than 0.4, so they occupy the biggest amounts of structural holes in the network, and always take the positions of bridging other cities. Most resources will pass through these three cities. Xiaogan and Xianning’s values are above 0.9, implying that their constraints or dependencies are the biggest; that is, that they are strictly constrained by the other cities they are tied with. From a hierarchy perspective, Xiaogan, Huangshi and Xiantao have a higher hierarchy of more than 0.7, which indicates that they are highly constrained in the network, and will therefore face some handicaps in implementing their functions. Ji’an, Shangrao and Jingdezhen have the smallest hierarchy, meaning that the constraints from their surrounding cities are generally equal.
Table 4 Measurement of structural holes in the urban agglomeration economic network in the middle reaches of Changjiang River
Number Nodes Effective Size Efficiency Constraint Hierarchy
1 Wuhan 21.929 0.953 0.288 0.606
2 Huangshi 4.215 0.602 0.789 0.760
3 Ezhou 5.928 0.847 0.676 0.549
4 Huanggang 2.438 0.813 0.806 0.364
5 Xiaogan 2.062 0.412 0.917 0.883
6 Xianning 3.338 0.556 0.916 0.658
7 Xiantao 3.381 0.563 0.676 0.707
8 Tianmen 3.143 0.629 0.697 0.470
9 Qianjiang 3.644 0.729 0.562 0.300
10 Changsha 15.653 0.870 0.469 0.580
11 Zhuzhou 7.106 0.646 0.710 0.660
12 Xiangtan 5.049 0.561 0.714 0.627
13 Yueyang 7.408 0.741 0.448 0.312
14 Changde 4.150 0.692 0.712 0.333
15 Yiyang 3.481 0.580 0.812 0.501
16 Loudi 3.239 0.648 0.703 0.222
17 Hengyang 1.991 0.498 0.876 0.179
18 Nanchang 13.225 0.882 0.252 0.271
19 Jiujiang 3.093 0.619 0.600 0.366
20 Jingdezhen 1.887 0.629 0.646 0.026
21 Yingtan 1.933 0.644 0.818 0.212
22 Shangrao 1.400 0.700 0.713 0.045
23 Wuzhou 2.149 0.716 0.660 0.604
24 Xinyu 4.620 0.770 0.439 0.286
25 Ji’an 3.831 0.766 0.443 0.086
26 Yichun 5.487 0.784 0.390 0.205
27 Pingxiang 5.295 0.756 0.489 0.155

4 Conclusions and recommendations

With the introduction of a modified gravitation model and SNA, we construct an urban agglomeration economic tie model, and empirically study the economic network structure of urban agglomeration in the middle reaches of Changjiang River. The main conclusions are as follows.
(1) From a whole-network perspective, the urban agglomeration network has a comparatively high density, which implies that this region has formed an economic network, and the ties of cities in the network are comparatively dense.
(2) This urban agglomeration has significant subgroups, and four subgroups are located in Wuhan Metropolitan Areas (only one subgroup of the four is located in this area), the Ring of Changsha, Zhuzhou and Xiangtan City Clusters (one subgroup) and Jiangxi Province (two subgroups). There are obvious economic communications in each subgroup, while there are fewer economic behaviors among subgroups. This is especially true for the two subgroups in the Poyang Lake Ecological Economic Zone, and the ties between them should therefore be strengthened in future.
(3) The pattern of economy driven by central cities has basically formed because the three capital cities of Wuhan, Changsha and Nanchang have a great ability to radiate to their surrounding cities. Within this urban agglomeration, three capital cities play very important betweenness roles and have strong diffusion effects to other surrounding cities. However, the surrounding cities are less able to absorb the resources from central cities. Uneven resource diffusion and absorption abilities may damage the economic integration of urban agglomeration, calling for more policies to encourage the alleviation of these imbalances among various cities.
(4) From the network measurement of structural holes, we can see that the subgroup of the Wuhan Metropolitan Areas imposes important effects on its surrounding cities, and that the surrounding cities are generally constrained by the central city. The subgroups in Jiangxi Province have more structural holes compared to other regions, and the cities in the periphery of these subgroups have fewer ties with surrounding cities. However, the cities in the Ring of Changsha, Zhuzhou and Xiangtan City Clusters are basically densely tied to each other, so the structural holes are not great in number, and constraints in this subgroup are at a low level.
Restricted by administration, there are many problems and handicaps when it comes to the networking process of urban agglomeration in the middle reaches of Changjiang River. It is therefore recommended that policies focus on propelling the combination of infrastructures, integrating resources and economic factors, and strengthening the economic ties among cities in this agglomeration, so as to fulfill the regional integration of urban agglomeration. It is also recommended that policymakers should pay more attention to the economic interactions of subgroups, thereby further improving the radiation abilities from central cities, and enhancing the absorption abilities for small and medium cities. With respect to the geographic plan, we suggest that urban agglomeration can be mapped as a multiple-center configuration; that is, Wuhan, Changsha and Nanchang as the centers, and Ezhou, Zhuzhou and Jiujiang as the sub-centers. In light of the requirements of regional economic integration, policy emphasis should be concentrated on digging out every subgroup’s respective advantageous industries in order to expand industry combination and cooperation, and thus boost the collective improvement of each subgroup’s advantageous industry, and realize total collaboration development for urban agglomeration in the middle reaches of Changjiang River.
It is worth noting that the scope of urban agglomeration in the middle reaches of Changjiang River has not reached consensus by authorities, so the geographic location may continue to change. Meanwhile, the economic ties identified in this paper are not only affected by GDP, population and distance, but also by other factors such as economic structure and industrial segmentation. For the dynamics of urban agglomeration, future research into economic network structure can be implemented in terms of scope variation in urban agglomeration and economic radiation ability for each city in this region. In addition, it is recommended that further studies focus on the possibility of modifying the gravitation model and introducing more factors by which the economic ties among cities may be measured.

The authors have declared that no competing interests exist.

1
Batten D F, 1995. Network cities: Creative urban agglomerations for the 21st century. Urban Studies, 32(2): 313-327.

2
Bunnel T, Barter P A, Morshidi S, 2002. Kuala Lumpur metropolitan area: A globalizing city-region. Cities, 19(5): 357-370.

3
Burt R S, 1992. Structure Holes: The Social Structure of Competition. Boston, MA: Harvard University Press.

4
Burt R S, 2000. The network structure of social capital. Research in Organizational Behavior, 22: 345-423.

5
Freeman L C, 1979. Centrality in social networks: Conceptual clarification.Social Networks, 1(3): 215-239.

6
Garreau J, 1991. Edge City: Life on the New Frontier. New York, NY: Doubleday.

7
Glaeser E L, 1999. Learning in cities. Journal of Urban Economics, 46(2): 254-277.

8
Glückler J, 2007. Economic geography and the evolution of networks.Journal of Economic Geography, 7(5): 619-634.

9
Gu C, 2011. Study on urban agglomeration: Progress and prospects. Geographical Research, 30(5): 771-784. (in Chinese)

10
Gu C, Pang H, 2008. Study on spatial relations of Chinese urban system: Gravity Model approach. Geographical Research, 27(1): 1-11. (in Chinese)

11
Haythornthwaite C, 1996. Social network analysis: An approach and technique for the study of information exchange.Library & Information Science Research, 18(4): 323-342.

12
Henderson V, Mitra A, 1996. The new urban landscape: Developers and edge cities.Regional Science and Urban Economics, 26(6): 613-643.

13
Kim T J, 1999. Metadata for geo-spatial data sharing: A comparative analysis.The Annals of Regional Science, 33(2): 171-181.

14
Li C, 1995. Inter-regional connectivity: As a recent frontier of regional geography.Acta Geographica Sinica, 50(6): 491-496. (in Chinese)

15
Liu C, 2004. Empirical analysis on the spatial structure of logistics economic linkages in China mainland. Economic Geography, 24(6): 826-829, 868. (in Chinese)

16
Liu J, 2004. An Introduction to Social Network Analysis. Beijing: Social Science Academic Press. (in Chinese)

17
Liu J, 2009. Lecture on Whole Network Approach: A Practical Guide to Ucinet. Shanghai: Truth & Wisdom Press. (in Chinese)

18
Losch A, 1940. The Economics of Location. New Haven, CT: Yale University Press.

19
Luo J, 2010. Social Network Analysis. Beijing: Social Science Academic Press. (in Chinese)

20
Lv K, Wang J, 2011. Study on networked development of the Yangtze River Delta cities.China Soft Science, (8): 130-140. (in Chinese)

21
Matsumoto H., 2004. International urban systems and air passenger and cargo flows: Some calculations.Journal of Air Transport Management, 10(4): 241-249.

22
Meng D, Lu Y, 2009. Strength and direction of regional economic linkage in Jiangsu Province based on Gravity Model.Progress in Geography, 28(5): 697-703. (in Chinese)

23
Meng X, Jia S, 2000. Statistical analysis of China’s large city development and regional dependence.Chinese Journal of Population Science, (5): 40-44. (in Chinese)

24
Niu H, Meng Q, Hu Qet al., 1998. Economic interaction analysis between regions of Gansu Province and their surrounding areas.Economic Geography, 18(3): 51-55. (in Chinese)

25
Perroux F, 1950. Economic space: Theory and applications.The Quarterly Journal of Economics, 64(1): 89-104.

26
Pred A, 1977. City Systems in Advanced Societies. London: Hutchinson.

27
Reilly W J, 1931. The Law of Retail Gravitation. Austin, TX: University of Texas.

28
Seidman S B, Foster B L, 1978. A graph-theoretic generalization of the clique concept.Journal of Mathematical Sociology, 6(1): 139-154.

29
Storper M, 1997. The Regional World: Territorial Development in a Global Economy. New York, NY: Guilford Press.

30
Taaffe E J, 1962. The urban hierarchy: An air passenger definition.Economic Geography, 38(1): 1-14.

31
Wang D, Zhuang R, 1996. The preliminary probe into the quantitative analysis of regional economic links: A case study on economic links between Su-Xi-Chang and Shanghai.Scientia Geographica Sinica, 16(1): 51-57. (in Chinese)

32
Xiong J P, Liu C L, Yuan J, 2006. Progress in foreign research on economic linkages of city agglomeration. World Regional Studies, 15(1): 63-70. (in Chinese)

33
Yang W, 1989. Principle of Location Theory. Lanzhou: Gansu People’s Publishing House. (in Chinese)

34
Zhang M, Gu C, Chen Let al., 2006. Spatial structure construction of global city-region in the Yangtze River Delta.Resources and Environment in the Yangtze Basin, 15(6): 787-792. (in Chinese)

35
Zhou Y, Zhang L, Wu Y, 2001. Study of China’s urban centrality hierarchy.Areal Research and Development, 20(4): 1-5. (in Chinese)

36
Zhu D, Wu, X, Zheng J, 2008. Application review of gravity model in economic researches. Journal of Yunnan Finance and Trade Institute, (5): 19-24. (in Chinese)

37
Zhu Y, 2003. The study of air transportation links among urban compact district of Huninghang.Human Geography, 18(5): 22-25. (in Chinese)

38
Zipf G K, 1942. The unity of nature, least-action, and natural social science.Sociometry, 5(1): 48-62.

Outlines

/