
Journal of Geographical Sciences >
Evolution of regional transport dominance in China 1910-2012
*Corresponding author: Wang Jiaoe (1981-), Associate Researcher, specialized in transport geography and regional development studies. E-mail:wangje@igsnrr.ac.cn
Author: Hu Hao (1984-), PhD, specialized in regional development studies. E-mail:bsdhao@126.com
Received date: 2014-03-10
Accepted date: 2014-10-30
Online published: 2015-06-15
Supported by
The Programme of Bingwei Excellent Young Scientists of the Institute of Geographic Sciences and Natural Resources Research, CAS, No.2011RC201
National Natural Science Foundation of China, No.41371143;No.41171107
Copyright
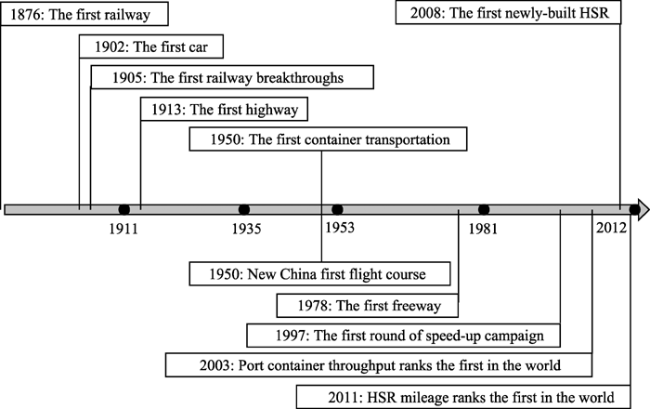
Transport infrastructure plays an important role in shaping the configuration of spatial socio-economic structures and influencing regional accessibility. Although China’s transport infrastructure has been experiencing a rapid development in the last 100 years, there lacks a systematic examination of the complete evolution history of China’s transport development, particularly with all kinds of transport modes. This paper first aims to clarify the history of China’s transportation from 1910 to 2012, and divides its evolution process into five periods (
Key words: transport dominance; transport infrastructure; spatial evolution; regions; history; China
HU Hao , WANG Jiaoe , JIN Fengjun , DING Nan . Evolution of regional transport dominance in China 1910-2012[J]. Journal of Geographical Sciences, 2015 , 25(6) : 723 -738 . DOI: 10.1007/s11442-015-1198-3
Table 1 The index and weight of transport dominance evaluation |
| Class | Subclass | Distance (km) | Weight | Class | Subclass | Distance (km) | Weight |
|---|---|---|---|---|---|---|---|
| Transport mode | Conventional railway | <20 | 2 | Transport mode | HSR | <30 | 2 |
| 20-40 | 1.5 | 30-60 | 1.5 | ||||
| 40-80 | 1 | 60-120 | 1 | ||||
| >80 | 0 | >120 | 0 | ||||
Highway | <10 | 2 | Airport | <30 | 2 | ||
| 10-30 | 1.5 | 30-60 | 1.5 | ||||
| 30-60 | 1 | 60-120 | 1 | ||||
| >60 | 0 | >120 | 0 | ||||
Freeway | <20 | 2 | Port | <30 | 2 | ||
| 20-40 | 1.5 | 30-60 | 1.5 | ||||
| 40-80 | 1 | 60-120 | 1 | ||||
| >80 | 0 | >120 | 0 | ||||
| City nodes | Central | <100 | 2 | City nodes | Central | 300-600 | 1 |
| city | 100-300 | 1.5 | city | >600 | 0 |
Figure 1 The first events of China’s transport development in the last 100 years |
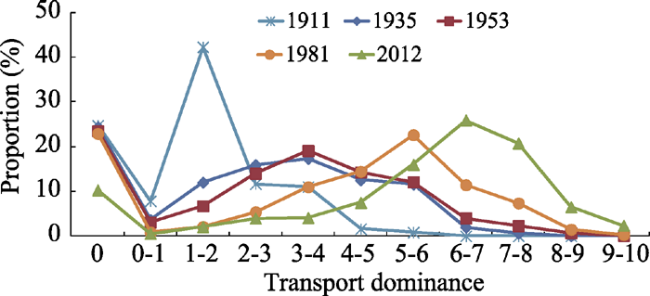
Figure 2 Proportion of counties with different transport dominance values, 1911-2012 |
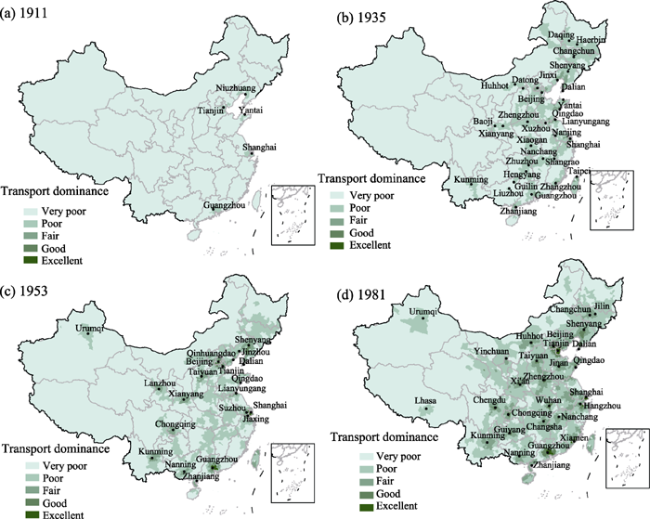
Figure 3 Spatial distribution of transport dominance 1911-1981 |
Table 2 Statistics of areas by transport dominance during the last 100 years |
| Transport dominance | Year | |||||
|---|---|---|---|---|---|---|
| 1911 | 1935 | 1953 | 1981 | 2012 | ||
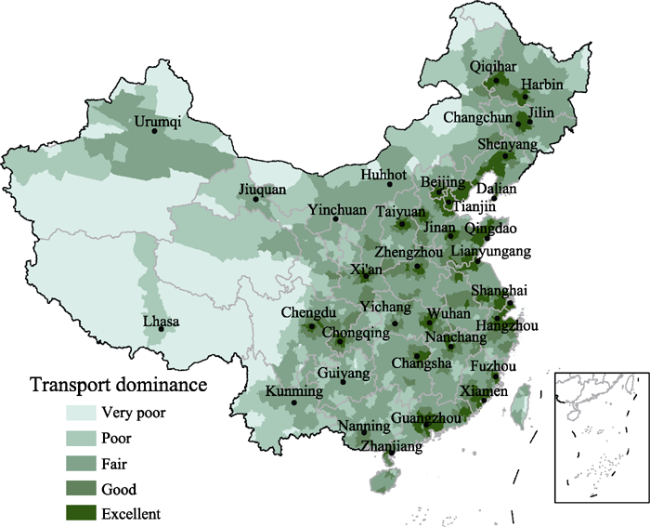
| Very poor | Number of counties | 3011 | 2261 | 2052 | 1303 | 644 |
| Area (km2) | 9,415,732 | 8,061,029 | 7,645,895 | 5,703,774 | 2,957,907 | |
| Area percentage (%) | 98.08 | 84.82 | 79.64 | 59.41 | 30.81 | |
| Poor | Number of counties | 74 | 744 | 816 | 1145 | 521 |
| Area (km2) | 88,093 | 1,335,486 | 1,547,199 | 2,873,956 | 2,143,983 | |
| Area percentage (%) | 0.92 | 14.05 | 16.12 | 29.94 | 22.33 | |
| Fair | Number of counties | 0 | 75 | 168 | 504 | 1262 |
| Area (km2) | 0 | 101,539 | 263,795 | 767,331 | 3,354,976 | |
| Area percentage (%) | 0.00 | 1.07 | 2.75 | 7.99 | 34.95 | |
| Good | Number of counties | 0 | 5 | 34 | 99 | 384 |
| Area (km2) | 0 | 5771 | 35,235 | 131,394 | 662,020 | |
| Area percentage (%) | 0.00 | 0.06 | 0.37 | 1.37 | 6.90 | |
| Excellent | Number of counties | 0 | 0 | 15 | 34 | 274 |
| Area (km2) | 0 | 0 | 11701 | 27369 | 384940 | |
| Area percentage (%) | 0.00 | 0.00 | 0.12 | 0.29 | 4.01 | |
Figure 4 Spatial distribution of transport dominance in 2012 |
The authors have declared that no competing interests exist.
| 1 |
|
| 2 |
|
| 3 |
|
| 4 |
|
| 5 |
|
| 6 |
|
| 7 |
|
| 8 |
|
| 9 |
|
| 10 |
|
| 11 |
|
| 12 |
|
| 13 |
|
| 14 |
|
| 15 |
|
| 16 |
|
| 17 |
|
| 18 |
|
| 19 |
|
| 20 |
|
| 21 |
|
| 22 |
|
| 23 |
|
| 24 |
|
| 25 |
|
| 26 |
|
| 27 |
|
/
| 〈 |
|
〉 |