Orginal Article

Spatial-temporal patterns of major ion chemistry and its controlling factors in the Manasarovar Basin, Tibet

  • YAO Zhijun , 1 ,
  • WANG Rui , 1, 2, * ,
  • LIU Zhaofei 1 ,
  • WU Shanshan 1 ,
  • JIANG Liguang 1
Expand
  • 1. Institute of Geographic Sciences and Natural Resources Research, CAS, Beijing 100101, China
  • 2. University of Chinese Academy of Sciences, Beijing 100049, China

*Corresponding author: Wang Rui (1987-), PhD Candidate, E-mail:

Author: Yao Zhijun (1959-), Professor, specialized in hydrology and water resources studies. E-mail:

Received date: 2014-11-17

  Accepted date: 2015-01-22

  Online published: 2015-06-15

Supported by

National Natural Science Foundation of China, No.41190080

“Strategic Priority Research Program (B)” of the Chinese Academy of Sciences, No.XDB03030400

Copyright

Journal of Geographical Sciences, All Rights Reserved

Abstract

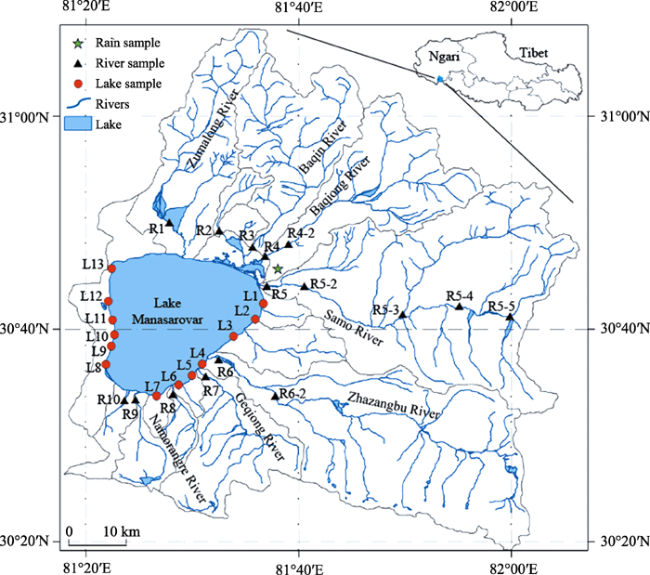
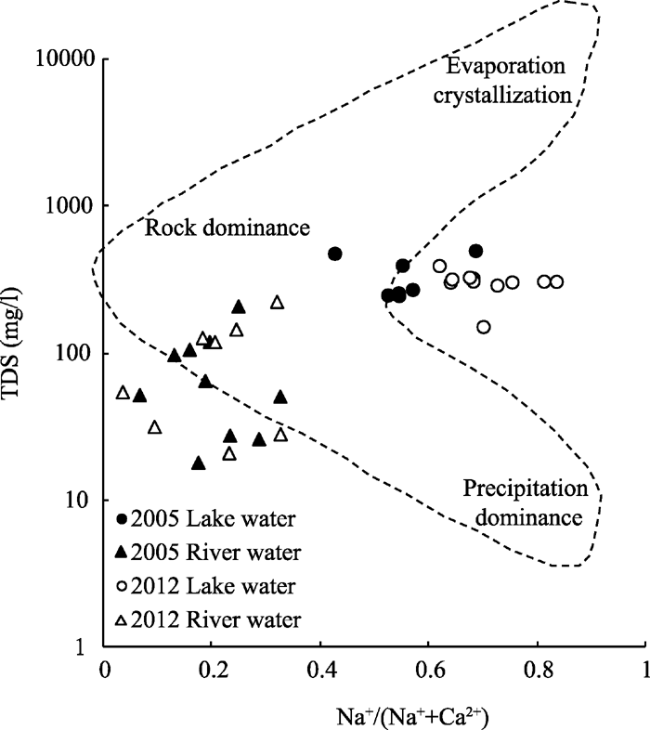
The Manasarovar Basin in southern Tibet, which is considered a holy land in Buddhism, has drawn international academic attention because of its unique geographical environment. In this study, based on actual measurements of major ion concentrations in 43 water samples collected during the years 2005 and 2012, we analyzed systemically the spatial- temporal patterns of water chemistry and its controlling factors in the lake and inflowing rivers. The results reveal that the water in the Manasarovar Basin is slightly alkaline, with a pH ranging between 7.4-7.9. The amounts of total dissolved solids (TDS) in lake and river waters are approximately 325.4 and 88.7 mg/l, respectively, lower than that in most of the surface waters in the Tibetan Plateau. Because of the long-term effect of evaporative crystallization, in the lake, Na+ and HCO3- have the highest concentrations, accounting for 46.8% and 86.8% of the total cation and anion content. However, in the inflowing rivers, the dominant ions are Ca2+ and HCO3-, accounting for 59.6% and 75.4% of the total cation and anion content. The water exchange is insufficient for such a large lake, resulting in a remarkable spatial variation of ion composition. There are several large inflowing rivers on the north side of the lake, in which the ion concentrations are significantly higher than that on the other side of the lake, with a TDS of 468.9 and 254.9 mg/l, respectively. Under the influence of complicated surroundings, the spatial variations in water chemistry are even more significant in the rivers, with upstreams exhibiting a higher ionic content. The molar ratio between (Ca2++Mg2+) and (Na++K+) is much higher than 1.0, revealing that the main source of ions in the waters is carbonate weathering. Although natural processes, such as rock weathering, are the major factors controlling main ion chemistry in the basin, in the future we need to pay more attention to the anthropogenic influence.

Cite this article

YAO Zhijun , WANG Rui , LIU Zhaofei , WU Shanshan , JIANG Liguang . Spatial-temporal patterns of major ion chemistry and its controlling factors in the Manasarovar Basin, Tibet[J]. Journal of Geographical Sciences, 2015 , 25(6) : 687 -700 . DOI: 10.1007/s11442-015-1196-5

1 Introduction

The main ion chemistry of surface water is affected by many factors, such as climate, geology, and human activities (Stallard and Edmond, 1983). The ion composition of a lake’s water is related to the water quality of its inflowing rivers. However, because of the long-term effects of natural processes such as evaporative crystallization and rock weathering, the difference in water chemistry between a lake and its inflowing rivers increases dramatically, leading to higher concentrations of ions in the lake (Wang et al., 2010b; Zhu et al., 2010). A study on the ion chemistry of a lake catchment can benefit an understanding of the rivers supplying the lake and the environment impacting the ions in the waters. The Tibetan Plateau is very sensitive to environmental changes; therefore, the ion chemistry of plateau lakes can reflect the level of impact that climate change and human disturbance have on the environment (Mitamura et al., 2003). Limited by the severe natural conditions, the studies that aim to understand the water chemistry of inland lakes in the Tibetan Plateau are still at a basic stage of investigation. They are mostly focused on areas with convenient traffic, which are heavily disturbed by human activities, such as Lake Qinghai (Xiao et al., 2012; Xu et al., 2010), Lake Nam Co (Wang et al., 2010; Zhang et al., 2008), Lake Yamzhog Yumco (Sun et al., 2013; Zhang et al., 2012), and Lake Pumayum Co (Ju et al., 2010; Zhu et al., 2010). These studies showed that there are large variations among the ion compositions of the inland lakes on the plateau. However, generally, evaporative crystallization was shown to control the chemical composition of inland lakes, and rock weathering appeared to be the primary source of ions in their inflows (Tian et al., 2014).
The Lake Manasarovar (or Mapam Yumco) is one of three famous sacred lakes in Tibet. The lake is very important globally, because of its special religious status. However, because of several limitations, including religious traditions and geographical conditions such as high altitude, the scientific information of this area is very scarce. The first measurements of the Lake were carried out in 1907 by Sven Hedin, a Swedish geographer, who reported that the maximum and average depths of the lake were 81.8 m and 46 m, respectively, and that it is situated at an altitude of 4586 m above sea level (Wang and Dou, 1998). He also established that the Lake Manasarovar is one that has the most abundant fresh water sources in the high altitude region, with a water storage capacity of 200×108 m3. The Tibetan Plateau Comprehensive Scientific Expedition, CAS, carried out another survey of the Manasarovar Basin in 1976, obtaining some valuable data about the physical and chemical properties of lake and river waters (Guan et al., 1984). Yao et al. (2009) analyzed the characteristics of the water cycle in the Manasarovar Basin using the stable isotopes δD and δ18O, proving that the level of evaporation of the lake water is very high. Wang et al. (2013) measured the depth, water quality, and modern sedimentation rates of the Lake Manasarovar and revealed that the maximum depth and water storage of the lake in the period 2009-2012 were 72.6 m and 46×108 m3, respectively, much lower than the values recorded in 1907. In addition, glacier area reduction, lake area shrinkage, and water level decline in the basin have also been reported recently (Guo et al., 2007; Liao et al., 2013; Zhang et al., 2014). Climate warming is considered the main cause for these changes (Li et al., 2014; Ye et al., 2008). In this study, based on actual measurements conducted during different periods, an extensive analysis has been conducted in order to determine the ion chemical characteristics of lake, rivers, and precipitation waters in the Manasarovar Basin. The spatial-temporal patterns of main ion chemistry and the sources of ions in the surface waters were also identified. Therefore, this study is very important from a scientific and practical point of view, enriching the knowledge of lake water chemistry in a little-studied plateau area and helping to protect the Tibetan sacred lake.

2 Study area

The Lake Manasarovar is an inland fresh water lake, located in Burang County, Ngari Prefecture of Tibet. It lies between 30°34′-30°47′N and 81°22′-81°37′E, and has an average altitude of 4588 m. The lake water is clear, and the surface area of the lake is about 412 km2, with a perimeter of about 83 km (Figure 1). The drainage basin of the lake is situated between the Transhimalaya in the north and the Himalayas in the south, and covers a total area of 4560 km2. Mountains Kailash and Gurla Mandhata consist of glaciers and areas covered by perennial snow. Therefore, besides precipitation, glaciers and snowmelt constitute another important water source for the lake and its inflowing rivers.
Figure 1 Drainage system of the Manasarovar Basin and the sampling sites
The Manasarovar Basin is characterized by an alpine sub-frigid arid climate zone, with no meteorological station in it. According to the reports from Burang weather station and previous studies (La et al., 2012; Wan et al., 2008; Ye et al., 2008), the average annual temperature of the basin is about 0-3.6°C, and the average annual precipitation is approximately 130-170 mm. Precipitation in the basin is mainly concentrated from June to August, and decreases from east to west and from south to north (Yao et al., 2009). The basin experiences large climate extremes within a year and, as a result, the water inflow is unevenly distributed throughout the year. In winter, both the rivers and the ground are frozen, while during the summer, river runoff into the lake is abundant. Because the basin is situated in a low-lying area and is surrounded by high mountains, the terrain is relatively closed and the land-lake breeze is easily formed in the lake area. Therefore, the wind speed is high, with a mean value of 4.4 m/s, and a daily maximum wind speed of 9.0 m/s, according to a measurement done during the month of July, 1976 (Guan et al., 1984).

3 Sampling and analytical procedures

Field surveys were conducted in early August 2005 and late July 2012 near the lake area in the Manasarovar Basin. A total of 43 water samples were collected, including 18 lake water samples and 25 inflowing river water samples. Because no boat was available to reach the center of the lake, the lake water samples were taken from sites about 2-3 m away from the edge of the lake. In Figure 1, five lake sampling sites (L1, L3, L5, L8, and L10) were available for both two surveys, while the sites of L4 and L13 were only available in 2005, and other sites (L2, L6, L7, L9, L11, and L12) were available in 2012. Except R2 was only available in 2005, other river sampling sites (R1, R3-R10) which are located in the estuaries of the seven main inflowing rivers and the three seasonal rivers in 2005 were repeated in 2012. Additionally, 6 samples (R4-2, R5-2-R5-5, and R6-2) were taken from upper locations on the rivers in 2012. The samples were collected at a depth of 10 cm and stored in 100 ml pre-cleaned polyethylene bottles, free of air. In addition, 7 samples of precipitation water were collected with the help of local residents, from November 2004 to August 2006, including 3 snow samples.
In 2012, we collected samples from 35 sites and determined 11 parameters, such as pH, electrical conductivity (EC), dissolved oxygen (DO), turbidity (TURB), and total dissolved solids (TDS), in situ, using a U-50 Multiparameter Water Quality Meter (Horiba Corporation, Japan), after calibrations. Afterwards, the water samples were carried back to the lab and placed in the refrigerator for cryopreservation. Then, they were left to melt naturally at room temperature before chemical measurements. Major cation (K+, Na+, Ca2+, Mg2+, SiO2) concentrations were measured using an Inductively Coupled Plasma Optical Emission Spectrometer (ICP-OES) (PerkinElmer Corporation, USA). Anion concentrations (SO42-, Cl-, NO3-) were determined by high performance liquid chromatography (LC-10ADvp) (Shimadzu Corporation, Japan). Procedural blanks were measured in parallel to sample treatment, using identical procedures. Each calibration curve was assessed by analyzing quality control standards before, during, and after sample analysis. The precision was ±2% for cations and ±5% for anions. The alkalinity is represented by HCO3-, which was calculated using the ionic charge balance (Ju et al., 2010; Wu et al., 2008).

4 Results and discussion

4.1 Major ion chemistry in the basin

The water in the Manasarovar Basin is slightly alkaline, with an average pH ranging from 7.4 to 7.9. The lake water has higher pH than the rivers, which exhibits increasing trends from upstream to the estuaries (Table 1). The lake water is very clear, and the TURB measurements of most river samples are less than 5 NTU, with the exception of three samples from the estuaries of R6, R7 and R10, where turbidity is higher due to the impact of rainfall erosion. The DO measurements are in the range of 33.2-45.0 mg/l, and the mineralization is shown by the EC measurements varying from 205.3 to 447.8 μs/cm. The TDS of lake waters is much higher than that of river waters, ranging from 99.7 to 307.0 mg/l in the basin (year 2012). Compared to other large lakes in the Tibetan Plateau, the TDS concentration in the Lake Manasarovar is relatively low (Table 2).
Table 1 Average content of the main chemical components of waters in the Manasarovar Basin
K+ Ca2+ Na+ Mg2+ Cl- SO42- HCO3- SiO2 TDS pH
2005 measurements
Lake 4.76 35.72 49.54 32.68 14.03 33.24 347.54 - 343.7 -
River estuaries 0.84 16.47 4.70 4.18 1.68 23.69 52.28 - 77.7 -
Basin 2.80 26.10 27.12 18.43 7.85 28.47 199.91 - 210.7 -
2012 measurements
Lake 6.24 20.11 54.23 29.28 14.57 31.03 299.30 1.87 307.0 7.85
River estuaries 1.68 18.65 7.02 4.75 2.10 18.14 75.59 9.56 99.7 7.78
Upper rivers 1.19 23.64 14.69 6.95 7.95 15.08 115.42 7.88 135.1 7.42
Basin 3.04 20.80 25.31 13.66 8.21 21.42 163.44 6.44 180.6 7.68
Average levels between 2005-2012 measurements
Lake 5.50 27.91 51.89 30.98 14.30 32.14 323.42 - 325.36 -
River estuaries 1.26 17.56 5.86 4.46 1.89 20.92 63.94 - 88.70 -
Precipitation 2.66 10.54 3.19 1.36 4.16 9.27 32.76 - 47.56 -
Basin 2.92 23.45 26.22 16.04 8.03 24.94 181.67 - 195.65 -

Note: the units of TDS and ions concentration are mg/l.

Table 2 Comparison of chemical components for lakes in the Tibetan Plateau
Lake TDS K+ Na+ Ca2+ Mg2+ Cl- SO42- HCO3- Reference
Manasarovar 0.31 0.14 2.31 0.61 1.27 0.42 0.34 5.11 This study
Qinghai 18.05 4.24 191.8 0.57 33.44 226.4 29.52 29.16 Xu et al., 2010
Nam Co 1.2 0.89 13.91 0.18 3.28 3.65 2.15 13.8 Wang et al., 2010b
Tangra Yumco 11.1 - - - - - - - Wang et al., 2010a
Zhari Namco 7.74 - - - - - - - Wang et al., 2010a
Pumayum Co 0.1 0.45 - 1.12 1.03 0.05 0.81 1.75 Ju et al., 2010
Yamzhog Yumco 1.28 0.46 12.29 0.18 7.85 2.31 7.25 9.74 Sun et al., 2013
La'ang Co 0.49 0.52 7.65 0.32 4.48 1.94 1.12 13.34 Wang et al., 2013

Note: The unit of TDS concentration is g/l, and the units of main ions concentration are mmol/l.

In the lake water, Na+ is the most dominant cation, with a concentration of 27.38-82.84 mg/l, representing 46.8% of the total cation content. Mg2+ (10.13-52.32 mg/l) and Ca2+ (14.35-53.63 mg/l) are found in similar concentrations. K+ is the least abundant, with a concentration of 2.47-7.03 mg/l, accounting for 5.0% of the total cation content. HCO3- is the most abundant anion in the lake water, with a concentration of 150.19-504.07 mg/l, representing 75.3%-93.5% of the total anion content. In contrast, both SO42- and Cl- ions are less abundant, with concentrations of 15.84-57.44 and 6.52-30.34 mg/l, respectively.
The ion content of river waters is much lower than that of lake water (Table 1). The anion composition of river waters is similar with that of lake water, with anion concentrations decreasing in the order of HCO3- > SO42- > Cl-, (27.95-192.79, 3.99-51.14, and 0.32-4.95 mg/l, respectively). HCO3- represents 75.4% of the total anion content in the rivers. However, the cation composition of river waters is very different from that of lake water. In the river waters, Ca2+ is the most abundant cation, representing 59.6% of the total cation content, with a concentration of 3.85-38.23 mg/l. The concentration of Na+ is 1.10-14.68 mg/l, only accounting for 20.0% of the total cation content. Mg2+ and K+ represent 16.4% and 2.0% of the total cation content, respectively.
The relative amounts of different components in water samples are shown more clearly by the ternary plots (Figure 2). In the cation ternary diagram, the lake and river water samples cluster near the Na++K+ and Ca2+ end-members, respectively. However, all the water samples cluster near the HCO3- end-member in the anion ternary diagram, revealing the significant abundance of this ion. Therefore, the Lake Manasarovar has a similar ion composition characteristic with many inland lakes in Tibet (Table 2); meanwhile, the water chemistry of its inflowing rivers is consistent with the results of Tian et al. (2014), which indicated that Ca2+-HCO3- is the main chemical type of rivers located in southern Tibet. In addition, although the ion content is relatively low, the precipitation samples have similar ion compositions with river waters, clustering near the Ca2+ and HCO3- end-members, revealing the significant impact of precipitation on the chemistry of river waters in the basin.
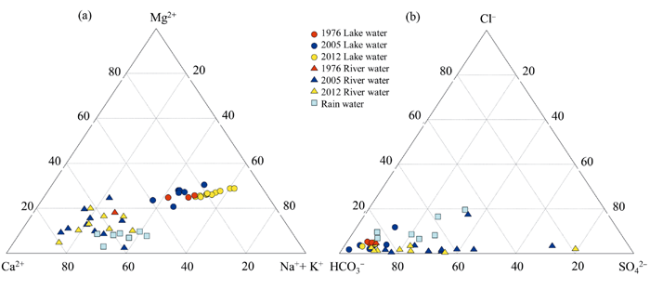
Figure 2 Ternary plots of (a) cations and (b) anions of the Lake Manasarovar, its inflowing rivers, and rain samples

4.2 Temporal and spatial variation of major ions

4.2.1 Long-term evolution
Guan et al. (1984) reported the main ion content for four sites in the Manasarovar Basin, which were measured in 1976. Because of the weaker interaction between the middle of the lake and the surrounding environment, the water chemistry of the lake center is relatively stable. The TDS value measured in 1976 was only 27.5 mg/l lower than the value reported by Wang et al. (2013) and taken in 2009-2010, and the average rate of change for each ion was 0.8%-13.6%, with the largest change registered for HCO3- and SO42- (Table 3). The sampling site on the lake periphery used in 1976 was close to the location of sample L1 from this study. By comparing the results of water chemistry in 1976, 2005, and 2012, we found that TDS increased significantly, and the ion concentrations increased 0.8-2.1 times on average during the last four decades. Besides increasing evaporative crystallization due to climate warming (Li et al., 2014; Yao et al., 2009), anthropogenic inputs could be another factor leading to an increase in ion contents (Li et al., 2009). The amounts of Ca2+, Mg2+ and HCO3- measured in 2012 were lower than those measured in .2005, but other ions exhibited an increasing trend. Because the main sources of Na+, Cl-, and are evaporites, it can be deduced that the processes of chemical weathering of evaporites are on the rise. By contrast, the effect of carbonate and silicate weathering, which mainly contributes to the HCO3- in waters, is on a decreasing trend.
The TDS measurements of inflowing river water have shown an increasing trend since 1976. However, the concentrations of each ion have fluctuated, which may be related to a change in hydrothermal conditions and river discharge in the basin. Taking the sample R5 as an example (Table 3), TDS increased by 21.9% and 81.8%, respectively, from 1976 to 2005 and 2012, but the contents of each ion, with the exception of , were slightly lower in 2005, and then increased significantly in 2012, with a rate between 30.4% (Ca2+) and 185.0% (Na+). During 2005-2012, the concentrations of most of the ions in the basin river waters increased dramatically, with an average TDS amplification of 51.8%, and a rate of increase for each ion ranging between 30.3% (Ca2+) and 124.8% (Na+).
Table 3 Main ions concentration in the Manasarovar Bain during different periods (mg/l)
K+ Ca2+ Na+ Mg2+ Cl- SO42- HCO3- TDS
Lake center
1976a 5.92 24.31 44.05 25.72 14.83 26.3 264.66 277.04
2009-2010b 5.97 26.86 49.09 28.73 13.83 29.73 300.71 304.57
Lake peripheries (L1 sample for 2005 and 2012)
1976a 3.23 22.13 24.21 16.35 9.6 15.75 178.03 182.88
2005 6.32 69.55 59.30 41.73 10.21 13.93 556.17 479.12
2012 7.75 35.08 65.21 36.35 14.62 28.41 415.61 395.22
River estuaries (R5 sample for 2005 and 2012)
1976a 1.65 16.13 6.35 5.33 3.68 8.06 67.69 80.60
2005 0.81 24.17 4.13 3.59 1.69 36.34 55.10 98.28
2012 1.17 31.50 11.77 8.77 4.31 15.88 146.12 146.46

Note: a the data is from the reference of Guan et al. (1984); b the data is from the reference of Wang et al. (2013)

4.2.2 Spatial pattern
The water exchange is insufficient in large lakes, resulting in a remarkable spatial variation of ion composition, which are impacted by the local geologic environment and the water quality of its inflowing rivers. In the Manasarovar Lake water, the spatial variation coefficient (CV) of TDS is 0.26, and the CV for each ion ranges from 0.25 (K+) to 0.46 (Ca2+). There are similar spatial distribution patterns for the Mg2+ and Na+ ions, showing an increasing trend from south to north in both the east and west side of the lake (Figure 3a). For example, the equivalents of these two cations in sample L13 are three times as much as in sample L7. The amount of Ca2+ in the eastern and northern lake waters is higher than in the samples taken from the west and south sides, while the concentration of K+ is slightly higher in northwest lake water samples. As the major anion, HCO3- is found in the highest concentrations in the northern lake water samples (L1 and L13), up to two times as much as in the samples taken from southern waters (L6-8) (Figure 3b). The concentration of SO42- is higher in the eastern lake water samples, with the highest values present in sample L13. The content of Cl- in the lake water is much lower, showing also a lower spatial variation.
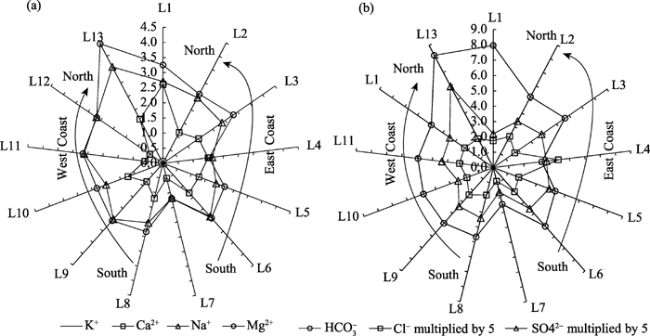
Figure 3 Concentration (meq/l) of (a) cations and (b) anions in different water samples of the Lake Manasarovar, showing the Cl- and content expanded by five times
Above all, the ion concentrations in the northern waters of the Lake Manasarovar are significantly higher than in the southern waters, with mean TDS values of 468.9 and 254.9 mg/l in the north and south, respectively. In addition, the spatial variation of ion composition in the eastern lake waters is more prominent than that in the western waters. There are several larger rivers inflowing to the lake from the north and east (Figure 1), which is a major reason for the high amount and marked difference in ion composition between the two sides of the lake. Not only does the water quality of rivers vary, but the rivers can also carry an abundance of dissolved solids with large discharge. Especially the rivers coming from the north can include melting waters from the glaciers and snowfields far away. More ions may be carried in the processes of riverbed erosion by melting waters. Located at the west of the Lake Manasarovar, Lake La’ang Co supplies no water to it, explaining the relatively consistent characteristics of lake water chemistry on this side.
The spatial variation of water chemistry between the rivers is much higher than that of lake water, because the rivers are impacted by several geographic and hydrologic factors, such as water sources, geological condition along the way, and the magnitude of discharge. The CV of TDS in the river estuaries in the Manasarovar Basin is 0.72, and the CV for each ion ranges between 0.56 (K+) and 1.06 (Mg2+). There are more ions in the north and northeast river waters. The average cation and anion content in the rivers R1-R5 can be 3.68 and 4.14 times as much as the concentrations recorded in the rivers R6-R10 (Figure 4). The spatial distribution pattern of the cations in rivers R1-R5 is consistent, with ion concentrations decreasing in the series R2 > R3 > R5 > R1 > R4, with the exception of the Na+ ion, whose concentration is slightly higher in R3 than in R2. In rivers R6-R10, the cation content registers the lowest levels in river R8. With the exception of Ca2+, which is found in relatively higher concentrations in rivers R9 and R10, all the other cations are found in the highest concentrations in river R6, which has the largest discharge and the biggest area of drainage. The consistency between the spatial distribution patterns of HCO3- and the cations in river waters is very high, with the maximum and minimum values present in rivers R2 and R8, respectively. Both equivalents of SO42- and Cl- are found in the highest concentrations in river R3, however, the SO42- content is relatively large in rivers R8 and R9 where the Cl- content is very low.
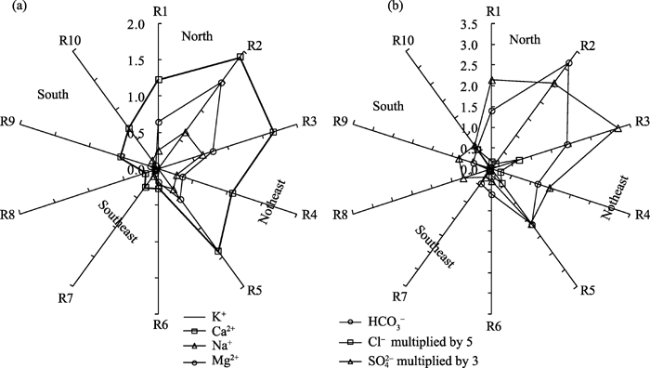
Figure 4 Equivalent (meq/l) of (a) cations and (b) anions in water samples of rivers in the Manasarovar Basin, showing the Cl- and SO42- content expanded by five and three times, respectively
In addition, according to the measurements of samples collected along river R5 in 2012, the ion contents are the highest in the upstream (R5-5) with a TDS of 205.8 mg/l, and the lowest in the midstream (R5-3) with a TDS of 109.7 mg/l. The ion content in river estuaries is higher than in the midstream, but lower than in the upstream. This is due to the fact that the impact of human activities such as farming and grazing is higher in upper sites and more ions are collected into the river estuaries from the tributaries. However, for a more in-depth analysis of the varying patterns of ion chemistry along the rivers, more sampling and analyses are necessary.

4.3 Sources of solutes

Gibbs (1970) provided a simple method to determine the relative importance of three natural factors which control surface water chemistry: evaporation and crystallization, rock weathering, and precipitation. This method is based on the relationship between TDS and Na+/(Na++Ca2+) or TDS and Cl-/(Cl-+ HCO3-). The water samples from the Manasarovar Basin are located in the middle part of the Gibbs plot (Figure 5), revealing that rock weathering is the dominant factor controlling the ion chemistry. The lake water samples are clustered in the upper right corner of the plot of the river samples, that is, the content of TDS and Na+ is higher in the lake water, indicating a higher effect of evaporative crystallization on lake chemistry. In addition, the lake samples taken in 2012 have a higher ratio between Na+ and (Na++Ca2+), which shows the growing influence of increasing evaporation on water chemistry in the basin (Yin et al., 2013).
Figure 5 The Gibbs plot of the Lake Manasarovar and its flowing rivers
4.3.1 Anthropogenic inputs
Human disturbances, such as agriculture and industry, are scarce in the Manasarovar Basin, due to geographical limitations and terrain conditions (Cong et al., 2010). However, the growth of tourism, religious or otherwise, might affect water chemistry in some parts of the basin. This could be the cause for the larger spatial variations in the EC measurements and ion compositions (Li et al., 2009). However, in 2012, NO3- was not detected in the half of water samples, and in the rest of samples, its average content was between 0.57-0.93 and 0.53-1.02 mg/l in the lake and river waters, respectively. Therefore, the NO3- concentration is much lower than the limit concentration stated by the National Drinking Water Standard (GB-5749) (10 mg/l). Additionally, the molar ratio of Cl-/Na+ in all samples from the basin is less than 1.0, with low spatial variations, indicating that currently the anthropogenic input in the basin is not serious (Grosbois et al., 2000; Li et al., 2009). The ions in the Lake Manasarovar and its inflowing rivers still originate mainly from natural processes such as atmospheric migration and chemical weathering.
4.3.2 Atmospheric inputs
The main source of Cl- in surface waters is the sea salt cycle. As a result, Cl- concentrations decline gradually with increasing distance from the sea (Stallard and Edmond, 1981). The Cl- ions in the Tibetan Plateau should originate mainly from evaporites weathering in the basin (Chen et al., 2002, Li et al., 2009). Based on the assumption that all the Cl- in the river sample in which the Cl- concentration is the lowest originates entirely from precipitation (Hren et al., 2007), the ion contribution from atmospheric inputs to the river waters can be calculated using equation (1) (Galy and France-Lanord, 1999). The results reveal that the contribution of K+ and Cl- from precipitation is relatively high, but the contribution rates of other ions are close to or lower than 10% (Table 4). Because lake water is subjected to strong evaporative crystallization, the ion contents are higher, and the impact of atmospheric inputs can be ignored.
[X]rain=[X/Cl]rain×[Cl]rain (1)
where X represents the cations and anions; [X]rain is the amount of each ion contributed to river waters from precipitation; [X/Cl]rain is the average molar ratio between each ion and Cl-; [Cl]rain is the contribution of Cl- to the river waters from precipitation.
Table 4 Contribution magnitude and percentage of main ions from atmospheric inputs to the river waters in the Manasarovar Basin
K+ Ca2+ Na+ Mg2+ SO42- HCO3- Cl-
Magnitude (μmol) 4.90 19.93 11.01 4.19 7.20 40.64 9.11
Max. percentage (%) 37.8 21.2 35.4 22.8 24.9 81.2 100.0
Mean percentage (%) 21.1 7.1 9.4 5.7 6.7 10.8 47.5
Min. percentage (%) 3.5 1.9 0.7 0.6 1.3 1.3 1.3
4.3.3 Chemical weathering inputs
Under natural conditions, chemical weathering of different parent rocks (e.g., carbonates, silicates, and evaporites) yields several combinations of dissolved ions in the surface water. Generally, the main sources of K+ and Na+ are evaporite and silicate weathering. Ca2+ and Mg2+ may be derived from evaporites, silicates, or carbonates. HCO3- originates mostly from silicates and silicate weathering, whereas Cl- and SO42- are derived mostly from weathering and dissolution of evaporites (Li et al., 2008; Meybeck, 1987).
The molar ratio of Na+ to Cl- in the lake and inflowing rivers is larger than 1.0 (Figure 6a), indicating that silicate weathering appears to have a more significant effect than halite weathering in the Manasarovar Basin. However, there are no significant correlations between Si and any of the Na+, K+, and HCO3- ions, revealing that the silicate contribution is also relatively low. The average ratios of alkaline earths (Ca2++Mg2+)/alkalis (Na++K+) in the lake and river waters are 1.61 and 5.05, respectively (Figure 6b), which point to a stronger process of carbonate rock weathering. This was verified by Sarin et al. (1989), who reported that silicate weathering releases less Ca2+ and Mg2+ than Na+ and K+. Meanwhile, all the major ions originate mainly from carbonate weathering, which is indicated by the relationship between HCO3- and Ca2+ (Figure 6c) and between HCO3- and (Ca2++Mg2+) (Figure 6d), with Ca2+, on average amounting to 25% and 85% of the HCO3- in the lake and rivers. However, (Ca2++Mg2+) basically balances with HCO3- in the rivers and balances with 74.4% of the HCO3- in the lake. The molar ratios of Ca2+/SO42- and Mg2+/SO42- are larger than 1.0, indicating that the contribution of sulfate weathering is not significant (Li and Zhang, 2008). However, both Ca2+ and Mg2+ have good positive correlations with SO42-, and the content of Mg2+ is lower than that of Ca2+ (Figure 6e), revealing that chemical weathering of sulfates such as gypsum has a certain impact on the river ion chemistry. There may be more sulfates distributing in the southeast and southern parts of the basin, as a result, the samples from rivers R6-R10 are situated on the line of (Ca2++Mg2+)=(HCO3- +SO42-) (Figure 6f).
Figure 6 Equivalent comparison between different ions in the study area, showing (a) Na+ vs. Cl-, (b) Na++K+ vs. Ca2++Mg2+, (c) Ca2+ vs. , (d) Ca2++Mg2+ vs. 
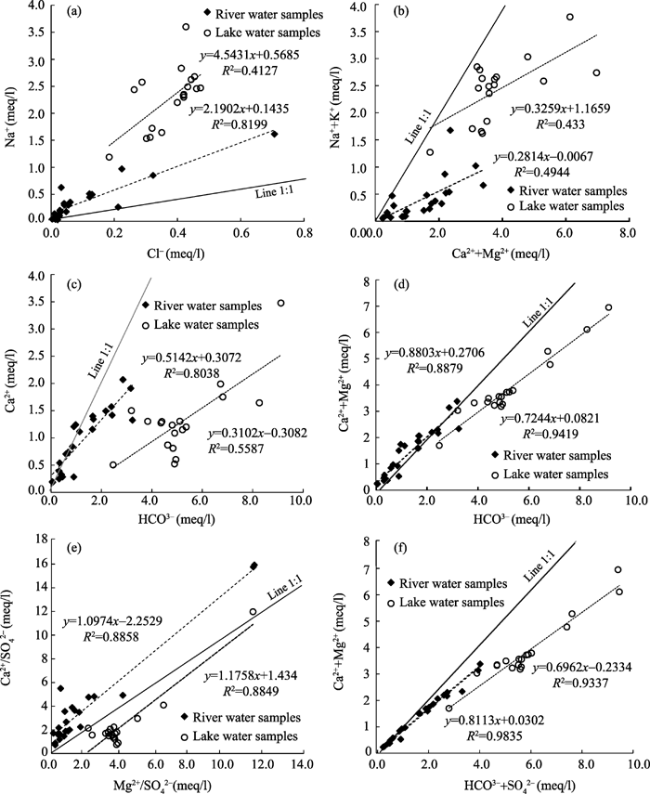
, (e) Ca2+/SO42 vs. Mg2+/SO42+ and (f) Ca2++Mg2+ vs. +SO42+

5 Conclusions

In this study, we have identified the spatial-temporal patterns of ion chemistry and the sources of main ions in the lake and inflowing rivers in the Manasarovar Basin. It aims to enrich the scientific understanding of the water chemistry and to protect the water resources in this sacred region. The main conclusions are listed below:
(1) The water in the Manasarovar Basin is slightly alkaline, with a pH ranging between 7.4-7.9. The lake water is very clear, with lower turbidity. The TDS in lake and river waters is about 325.4 and 88.7 mg/l, respectively, which is lower than in most of the surface waters in the Tibetan Plateau.
(2) Because of the long-term effect of evaporative crystallization, the concentrations of Na+ and HCO3- are higher in the lake water, representing 46.8% and 86.8% of the total cations and anions, respectively. The ion composition of the lake water is consistent with that of the inland lakes located in southern Tibet, such as the Lake Nam Co and Lake Yamzhog Yumco. The dominant ions in the inflowing rivers are Ca2+ and HCO3-, accounting for 59.6% and 75.4% of the total cations and anions.
(3) The water exchange among different regions of lake and inflowing rivers is insufficient, resulting in a remarkable spatial variation of ion composition. The average CV of TDS in the lake and river waters is 0.26 and 0.72, respectively. There are several large rivers inflowing into the lake from the north. Therefore, the ion concentrations in the north side of the lake waters are significantly higher than that on the other side, with a TDS of 468.9 and 254.9 mg/l, respectively. Under the influence of complicated surroundings, the spatial variations of river water chemistry are significant, with a higher ionic content present in the upstream part of the rivers.
(4) The major factors controlling the ion chemistry in the basin are the natural processes, such as rock weathering. The high concentrations of Ca2+, Mg2+, and HCO3- in the waters reveal that the dominant source of the ions is carbonate weathering. The atmospheric factor contributes only relatively more K+ and Cl+ to the river waters, with the contribution rate of 21.1% and 47.5%, respectively.
(5) Due to climate change, the ion contents in the surface waters in the basin have increased gradually. The TDS measurements performed after the year 2000 are 2.4 and 1.5 times as much as those of 1976, in the lake and river waters, respectively. Although the contribution of the anthropogenic inputs is not significant at the moment, the influence of human presence needs to be studied in more detail in the future.

The authors have declared that no competing interests exist.

1
Chen J, Wang F, Xia Xet al., 2002. Major element chemistry of the Changjiang (Yangtze River).Chemical Geology, 187: 231-255.

2
Cong Z, Kang S, Zheng Wet al., 2010. Modern process and historical reconstruction of Pb and Hg in remote areas: A critical review.Acta Geographica Sinica, 65(3): 351-360. (in Chinese)

3
Galy A, France-Lanord C, 1999. Weathering processes in the Ganges-Brahmaputra basin and the riverine alkalinity budget.Chemical Geology, 159: 31-60.

4
Gibbs R J, 1970. Mechanisms controlling world water chemistry.Science, 170(3962): 1088-1090.

5
Grosbois C, Negrel PH, Fouillac Cet al., 2000. Dissolved load of the Loire River: chemical and isotopic characterization.Chemical Geology, 170: 179-201.

6
Guan Zhihua, Chen Chuanyou, Qu Yuxiong, et al. (eds.), 1984. Rivers and Lakes of Tibet. Beijing: Science Press, 169-176. (in Chinese)

7
Guo L, Ye Q, Yao Tet al., 2007. The Glacial Landforms and the Changes of Glacier and Lake Area in the Manasarovar Basin in Tibetan Plateau Based on GIS.Journal of Glaciology and Geocryology, 29(4): 517-524. (in Chinese)

8
Hren M T, Chamberlain C P, Hilley G Eet al., 2007. Major ion chemistry of the Yarlung Tsangpo-Brahmaputra river: Chemical weathering, erosion, and CO2 consumption in the southern Tibetan plateau and eastern syntaxis of the Himalaya.Geochimica et Cosmochimica Acta, 71: 2907-2935.

9
Ju J, Zhu L, Wang Jet al., 2010. Water and sediment chemistry of Lake Pumayum Co, South Tibet, China: Implications for interpreting sediment carbonate.Journal of Paleolimnology, 43: 463-474.

10
La B, Bian D, Ci Zet al., 2012. Study on the change of lake area and its causes in the Mapangyong Co Basin in Tibet.Arid Zone Research, 29(6): 992-996. (in Chinese)

11
Li L, Li J, Yao Xet al., 2014. Changes of the three holy lakes in recent years and quantitative analysis of the influencing factors.Quaternary International, 349: 339-345.

12
Li S, Xu Z, Wang Het al., 2009. Geochemistry of the upper Han River basin, China: 3. Anthropogenic inputs and chemical weathering to the dissolved load.Chemical Geology, 264: 89-95.

13
Li S, Zhang Q, 2008. Geochemistry of the upper Han River basin, China: 1. Spatial distribution of major ion compositions and their controlling factors.Applied Geochemistry, 23: 3535-3544.

14
Liao J, Shen G, Li Y, 2013. Lake variations in response to climate change in the Tibetan Plateau in the past 40 years.International Journal of Digital Earth, 6: 534-549.

15
Meybeck M, 1987. Global chemical weathering of surficial rocks estimated from river dissolved loads.American Journal of Science, 287: 401-428.

16
Mitamura O, Seike Y, Kondo Ket al., 2003. First investigation of ultraoligotrophic alpine Lake Puma Yumco in the pre-Himalayas, China.Limnology, 4: 167-175.

17
Sarin MM, Krishnaswami S, Dilli Ket al., 1989. Major ion chemistry of the Ganga-Brahmaputra river system, Weathering processes and fluxes to the Bay of Bengal.Geochimica et Cosmochimica Acta, 53(5): 997-1009.

18
Stallard R F, Edmond J M, 1981. Geochemistry of the Amazon 1. Precipitation chemistry and the marine contribution to the dissolved load at the time of peak discharge.Journal of Geophysical Research, 86: 9844-9858.

19
Stallard R F, Edmond J M, 1983. Geochemistry of Amazon. 2 The influence of geology and weathering environment on the dissolved load.Journal of Geophysical Research, 88: 9671-9688.

20
Sun R, Zhang X, Zheng D, 2013. Spatial variation and its causes of water chemical property in Yamzhog Yumco Basin, South Tibet.Acta Geographica Sinica, 68(1): 36-44. (in Chinese)

21
Tian Y, Yu C, Luo Ket al., 2014. Water chemical properties and the element characteristics of natural water in Tibet, China.Acta Geographica Sinica, 69(7): 969-982. (in Chinese)

22
Wan W, Feng X, Xiao Pet al., 2008. Differences of lake color between Mapangyongcuo Lake and La'angcuo Lake based on remote sensing.Remote Sensing Technology and Application, 23(6): 667-671. (in Chinese)

23
Wang J, Peng P, Ma Qet al., 2010a. Modern limnological features of Tangra Yumco and Zhari Namco, Tibetan Plateau. Journal of Lake Sciences, 22(4): 629-632. (in Chinese)

24
Wang J, Peng P, Ma Qet al., 2013. Investigation of water depth, water quality and modern sedimentation rate in Manasarovar and La’ang Co, Tibet.Journal of Lake Sciences, 25(4): 609-616. (in Chinese)

25
Wang J, Zhu L, Wang Yet al., 2010b. Comparisons between the chemical compositions of lake water, inflowing river water, and lake sediment in Nam Co, Central Tibetan Plateau, China and their controlling mechanisms.Journal of Great Lakes Research, 36: 587-595.

26
Wang Sumin, Dou Hongshen, (eds.), 1998. China Lake Records. Beijing: Science Press, 403-404. (in Chinese)

27
Xiao J, Jin Z, Zhang Fet al., 2012. Solute geochemistry and its sources of the groundwaters in the Qinghai Lake catchment, NW China.Journal of Asian Earth Sciences, 52: 21-30.

28
Xu H, Hou Z, An Zet al., 2010. Major ion chemistry of waters in Lake Qinghai catchments, NE Qinghai-Tibet plateau, China.Quaternary International, 212: 9-9.

29
Yao Zhijun, Liu Jian, Huang Heqing, 2009. Characteristics of isotope in precipitation, river water and lake water in the Manasarovar basin of Qinghai-Tibet Plateau.Environmental Geology, 57: 551-556.

30
Ye Q, Yao T, Chen Fet al., 2008. Glacier and lake co-variations and their responses to climate change in the Mapam Yumco Basin on Tibet.Geographical Research, 27(5): 1178-1190. (in Chinese)

31
Yin Y, Wu S, Zhao Det al., 2013. Modeled effects of climate change on actual evapotranspiration in different eco-geographical regions in the Tibetan Plateau.Journal of Geographical Sciences, 23(2): 195-207.

32
Zhang Q, Kang S, Wang Fet al., 2008. Major ion geochemistry of Nam Co Lake and its sources, Tibetan Plateau.Aquatic Geochemistry, 14: 321-336.

33
Zhang X, Sun R, Zhu L, 2012. Chemical properties and quality evaluation of lake water in the Yamzhog Yumco Basin, South Tibet.Journal of Glaciology and Geocryology, 34(4): 950-958. (in Chinese)

34
Zhang X, Wu Y, Zhang X, 2014. Water level variation of inland lakes on the south-central Tibetan Plateau in 1972-2012.Acta Geographica Sinica, 69(7): 993-1001. (in Chinese)

35
Zhu L, Ju J, Wang Yet al., 2010. Composition, spatial distribution, and environmental significance of water ions in Pumayum Co catchment, southern Tibet.Journal of Geographical Sciences, 20: 109-120.

Outlines

/