
Journal of Geographical Sciences >
Hydrochemical characteristics and element contents of natural waters in Tibet, China
*Corresponding author: Yu Chengqun, Professor, E-mail:yucq@igsnrr.ac.cn; Luo Kunli, Professor, E-mail:luokl@igsnrr.ac.cn
Author: Tian Yuan (1991-), Graduate student in Institute of Geographic Sciences and Natural Resources Research, CAS, specialized in geology and health, environmental science. E-mail:tiany.13s@igsnrr.ac.cn
Received date: 2014-10-20
Accepted date: 2014-11-16
Online published: 2015-06-15
Supported by
National Key Technologies R&D Program in the 12th Five-Year Plan of China, No.2011BAD17B05-4, No.2011BAC09B03
National Key Basic Research Program of China (973 Program), No.2014CB238906
National Natural Science Foundation of China, No.40872210, No.41172310, No.40171006
Copyright
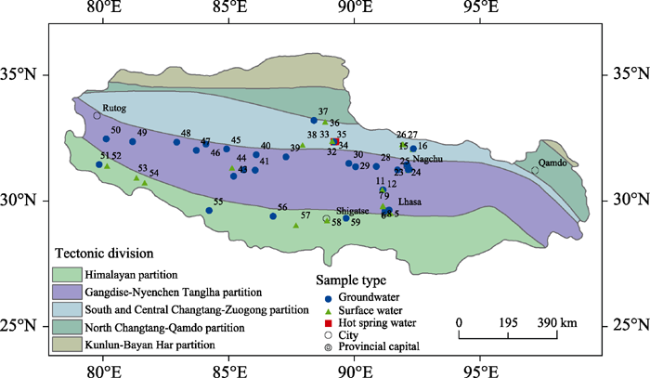
Sixty water samples (35 groundwater samples, 22 surface water samples and three hot-spring water samples) were collected at 36 points from villages and towns in Lhasa city, Nagchu (Nagqu) prefecture, Ali (Ngari) prefecture and Shigatse (Xigaze) prefecture (Tibet) in 2013 to study the hydrochemical characteristics and element contents of natural waters. The concentrations of elements were determined in the water samples and compared with the concentrations in water samples from other regions, such as southeast Qinghai, south Xinjiang, east Sichuan and west Tibet. The hydrochemical species in different areas were also studied. Water in most parts of Tibet reaches the requirements of the Chinese national standard and the World Health Organization international standard. The pH values of the water samples ranged from 6.75 to 8.21 and the value for the mean total dissolved solids was 225.54 mg/L. The concentration of arsenic in water from Ali prefecture exceeded the limit of both the Chinese national standard and the international standard and the concentration of fluoride in water from Shuanghu exceeded the limit of both the Chinese national standard and the international standard. The main hydrochemical species in water of Tibet is Ca (HCO3)2. From south to north, the main cation in water changes from Ca2+ to Na+, whereas the main anions in water change from HCO3- to Cl- and SO42-. The chemistry of river water and melt water from ice and snow is dominated by the rocks present at their source, whereas the chemistry of groundwater is affected by many factors. Tectonic divisions determine the concentrations of the main elements in water and also affect the hydrochemical species present.
Key words: element concentrations; hydrochemical species; water chemistry; water quality; Tibet
TIAN Yuan , YU Chengqun , LUO Kunli , ZHA Xinjie , WU Jianshuang , ZHANG Xianzhou , NI Runxiang . Hydrochemical characteristics and element contents of natural waters in Tibet, China[J]. Journal of Geographical Sciences, 2015 , 25(6) : 669 -686 . DOI: 10.1007/s11442-015-1195-6
Figure 1 Geographical location, tectonic divisions (based on Ma et al., 2002) and distribution of water sampling points in Tibet |
Table 1 Distribution of surface water sampling locations in Tibet |
| Sample No. | Date | Latitude (°) | Longitude (°) | Elevation (m) | Sample site | Sample type |
|---|---|---|---|---|---|---|
| 1 | 2013.04.27 | 29.566389 | 91.401144 | 4196 | No.7 team, Xincang village, Dazi county | River water |
| 2 | 2013.04.27 | 29.570000 | 91.393056 | 4287 | No.7 team, Xincang village, Dazi county | Ice/snow melt |
| 5 | 2013.07.13 | 29.604167 | 91.380833 | 3970 | No.6 team, Xincang village, Dazi county | River water |
| 6 | 2013.07.20 | 29.873056 | 91.093333 | 3972 | Bailang village, Linzhou county | River water |
| 7 | 2013.07.20 | 29.873056 | 91.093333 | 3972 | Bailang village, Linzhou county | River water |
| 8 | 2013.07.20 | 29.871667 | 91.092500 | 3954 | Bailang village, Linzhou county | River water |
| 9 | 2013.07.20 | 29.850000 | 91.092222 | 4041 | Bailang village, Linzhou county | River water |
| 12 | 2013.07.24 | 30.495000 | 91.069167 | 4317 | Dangxiong field station | Ice/snow melt |
| 14 | 2013.08.04 | 32.105833 | 92.285278 | 4645 | Nyainrong, Nyainrong county | River water |
| 15 | 2013.08.04 | 32.109722 | 92.302500 | 4634 | Nyainrong, Nyainrong county | Ice/snow melt |
| 21 | 2013.08.05 | 31.273333 | 92.102778 | 4450 | Kema village, Luoma town, Nagchu | River water |
| 26 | 2013.08.08 | 32.301111 | 91.868056 | 4683 | Amdo county | River water |
| 27 | 2013.08.08 | 32.303333 | 91.906944 | 4732 | Shenkagang village, Amdo county | River water |
| 35 | 2013.08.11 | 32.433056 | 89.081111 | 4791 | Duoma township, Shuanghu county | River water |
| 36 | 2013.08.11 | 33.206944 | 88.798611 | 4981 | Shuanghu county | Ice/snow melt |
| 38 | 2013.08.12 | 32.286944 | 87.901944 | 4754 | Cuozheluoma town, Shuanghu county | River water |
| 44 | 2013.08.17 | 31.370000 | 85.091667 | 4728 | Gerze county | River water |
| 52 | 2013.08.21 | 31.451111 | 80.120556 | 4675 | Alzadar county | River water |
| 53 | 2013.08.21 | 30.970278 | 81.285000 | 4679 | Baga town, Burang county | Ice/snow melt |
| 54 | 2013.08.22 | 30.776389 | 81.613611 | 4625 | Huoer town, Burang county | Ice/snow melt |
| 57 | 2013.08.22 | 29.088611 | 87.637778 | 4048 | Lhatse county | River water |
| 58 | 2013.18.23 | 29.278889 | 88.879167 | 3777 | Shigatse | River water |
Table 2 Distribution of groundwater sampling locations in Tibet |
| Sample number | Date | Latitude (°) | Longitude (°) | Elevation (m) | Sample site | Depth (m) |
|---|---|---|---|---|---|---|
| 3 | 2013.04.28 | 29.642406 | 91.180731 | 3666 | Tibet University, Lhasa | - |
| 4 | 2013.04.28 | 29.642950 | 91.180108 | 3666 | Tibet University, Lhasa | 6 |
| 10 | 2013.07.23 | 30.476389 | 91.099722 | 4297 | Damxung county | 5 |
| 11 | 2013.07.23 | 30.477500 | 91.103056 | 4281 | Damxung county | 30 |
| 13 | 2013.08.03 | 31.475908 | 92.062089 | 4521 | Nagchu town, Nagqu county | - |
| 16 | 2013.08.04 | 32.110000 | 92.303611 | 4612 | Nyainrong | 10 |
| 17 | 2013.08.04 | 31.465556 | 92.062778 | 4508 | Nagchu town, Nagchu | 10 |
| 18 | 2013.08.05 | 31.468611 | 92.059167 | 4534 | Nagchu town, Nagchu | - |
| 19 | 2013.08.05 | 31.271944 | 92.158611 | 4471 | Kema village, Luoma town, Nagqu county | 10 |
| 20 | 2013.08.05 | 31.271944 | 92.160000 | 4439 | Kema village, Luoma town, Nagqu county | 5 |
| 22 | 2013.08.05 | 31.469167 | 92.047500 | 4523 | Nagchu town, Nagqu county | 27 |
| 23 | 2013.08.05 | 31.275833 | 92.105278 | 4459 | Nagqu field station, Nagqu county | 10 |
| 24 | 2013.08.06 | 31.471944 | 92.047500 | 4506 | Nagqu Agriculture Bureau, Nagqu county | - |
| 25 | 2013.08.07 | 32.264050 | 91.681160 | 4685 | Amdo county | - |
| 28 | 2013.08.09 | 31.405278 | 90.835278 | 4606 | Baila town, Baingoin county | 6 |
| 29 | 2013.08.09 | 31.395000 | 90.007778 | 4703 | Baingoin county | 15 |
| 30 | 2013.08.10 | 31.523333 | 89.741111 | 4576 | Mendang town, Baingoin county | 4 |
| 31 | 2013.08.10 | 32.390000 | 89.218889 | 4703 | Duoma town, Shuanghu county (40ºC) | - |
| 32 | 2013.08.10 | 32.386667 | 89.149167 | 4701 | Duoma township, Shuanghu county (50ºC) | - |
| 33 | 2013.08.10 | 32.388056 | 89.149722 | 4708 | Duoma township, Shuanghu county (60ºC) | - |
| 34 | 2013.08.10 | 32.384444 | 89.145278 | 4705 | Duoma town, Shuanghu county | 15 |
| 37 | 2013.08.12 | 33.233056 | 88.352222 | 4811 | Jiacuo, Shuanghu county | 4 |
| 39 | 2013.08.13 | 31.786111 | 87.234722 | 4553 | Nyima county | - |
| 40 | 2013.08.15 | 31.876944 | 86.061667 | 4797 | Asuo town, Nyima county | 6 |
| 41 | 2013.08.15 | 31.253056 | 86.014722 | 4726 | Juncang town, Nyima county | 8 |
| 42 | 2013.08.16 | 31.263333 | 85.563056 | 4690 | Cishi town, Cuoqin county | 10 |
| 43 | 2013.08.16 | 31.018056 | 85.153889 | 4649 | Cuoqin county | 10 |
| 45 | 2013.08.17 | 32.098611 | 84.878889 | 4433 | Dongco, Gerze county | - |
| 46 | 2013.08.17 | 32.300000 | 84.055278 | 4447 | Gerze county | 11 |
| 47 | 2013.08.18 | 32.040697 | 83.669022 | 4398 | Marm, Gerze county | 5 |
| 48 | 2013.08.19 | 32.371667 | 82.891111 | 4474 | Wenbudangsang town, Geji county | - |
| 49 | 2013.08.19 | 32.388333 | 81.143333 | 4542 | Geji county | 5 |
| 50 | 2013.08.20 | 32.503333 | 80.090000 | 4308 | Seng-ge Kambab | - |
| 51 | 2013.08.21 | 31.481389 | 79.801111 | 3755 | Tholing, Zanda county | 35 |
| 55 | 2013.08.22 | 29.652169 | 84.181464 | 4602 | Laozhongba town, Zhongba county | 6 |
| 56 | 2013.08.22 | 29.419006 | 86.724014 | 4632 | Sangsang town, Ngamring county | 10 |
| 59 | 2013.18.23 | 29.346667 | 89.635833 | 3752 | Dazhu village, Shigatse | 15 |
| 60 | 2013.08.24 | 29.676389 | 91.344722 | 3699 | Dazi county Lhasa field station | 30 |
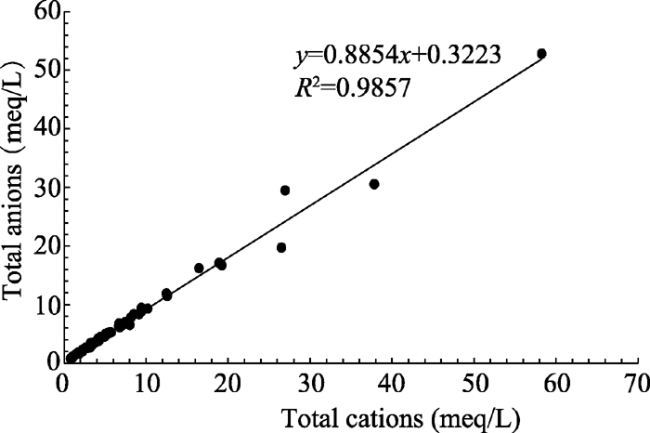
Figure 2 Total cations versus total anions in water samples from Tibet |
Table 3 Hydrochemical characteristics and element concentrations in surface water samples from Tibet |
| Sample number | pH | Eh (mV) | Ec (μs/cm) | TDS (mg/L) | TH (mg/L) | Ca2+ (mg/L) | Mg2+ (mg/L) | Na+ (mg/L) | K+ (mg/L) | HCO3 (mg/L) | SO42- (mg/L) | Cl- (mg/L) | SiO2 (mg/L) |
|---|---|---|---|---|---|---|---|---|---|---|---|---|---|
| 1 | 7.62 | 336 | 179 | 90 | 84 | 28.9 | 2.8 | 2.2 | 0.7 | 39.7 | 32.6 | 11.0 | 6.8 |
| 2 | 7.30 | 293 | 197 | 99 | 105 | 40.2 | 1.2 | 1.9 | 0.3 | 91.5 | 10.6 | 6.1 | 10.2 |
| 5 | 7.36 | 220 | 151 | 76 | 77 | 26.6 | 2.6 | 2.4 | 0.4 | 54.9 | 3.2 | 12.8 | 12.6 |
| 6 | 7.45 | 224 | 96 | 48 | 44 | 13.6 | 2.4 | 2.7 | 0.7 | 15.3 | 12.0 | 8.7 | 6.5 |
| 7 | 7.38 | 217 | 80 | 40 | 37 | 11.3 | 2.0 | 1.4 | 0.5 | 9.2 | 11.5 | 9.0 | 5.7 |
| 8 | 7.29 | 235 | 95 | 47 | 44 | 13.6 | 2.4 | 2.8 | 0.7 | 21.4 | 12.2 | 10.1 | 6.6 |
| 9 | 7.31 | 227 | 76 | 38 | 36 | 11.2 | 1.9 | 1.4 | 0.5 | 10.7 | 11.9 | 6.6 | 5.8 |
| 12 | 7.15 | 226 | 133 | 66 | 68 | 21.5 | 3.5 | 1.3 | 0.8 | 39.7 | 21.5 | 8.8 | 4.5 |
| 14 | 7.77 | 202 | 263 | 131 | 133 | 38.3 | 9.0 | 9.7 | 1.5 | 122.0 | 7.8 | 7.2 | 9.1 |
| 15 | 7.55 | 209 | 348 | 174 | 186 | 53.0 | 12.8 | 9.7 | 1.2 | 155.6 | 12.6 | 34.3 | 10.4 |
| 21 | 7.37 | 213 | 187 | 93 | 78 | 20.8 | 6.3 | 13.9 | 1.6 | 73.2 | 12.3 | 10.0 | 8.8 |
| 26 | 7.65 | 185 | 529 | 265 | 268 | 67.1 | 24.1 | 27.1 | 3.0 | 268.5 | 59.8 | 14.4 | 7.6 |
| 27 | 7.81 | 175 | 401 | 200 | 217 | 69.8 | 10.1 | 14.6 | 2.0 | 253.2 | 8.6 | 9.6 | 11.0 |
| 35 | 7.80 | 185 | 1530 | 765 | 443 | 73.0 | 62.5 | 218.7 | 3.9 | 192.2 | 521.0 | 98.9 | 8.7 |
| 36 | 8.02 | 172 | 344 | 172 | 180 | 26.3 | 27.5 | 11.9 | 3.7 | 125.1 | 32.8 | 27.5 | 9.1 |
| 38 | 8.21 | 168 | 278 | 139 | 158 | 45.4 | 10.6 | 4.7 | 1.3 | 94.6 | 44.3 | 12.4 | 8.5 |
| 44 | 7.90 | 188 | 368 | 184 | 196 | 58.6 | 11.8 | 11.8 | 1.8 | 155.6 | 56.3 | 13.6 | 11.8 |
| 52 | 7.72 | 209 | 595 | 298 | 352 | 75.8 | 38.9 | 9.0 | 4.3 | 167.8 | 158.5 | 17.5 | 9.7 |
| 53 | 7.90 | 200 | 172 | 86 | 89 | 23.8 | 7.0 | 4.4 | 0.7 | 18.3 | 39.3 | 21.9 | 4.7 |
| 54 | 7.96 | 207 | 90 | 45 | 43 | 12.8 | 2.6 | 3.1 | 0.9 | 3.1 | 12.3 | 20.3 | 6.2 |
| 57 | 7.64 | 219 | 226 | 113 | 121 | 40.3 | 4.9 | 4.6 | 0.8 | 79.3 | 30.7 | 15.4 | 9.4 |
| 58 | 7.73 | 225 | 355 | 178 | 194 | 50.9 | 15.9 | 8.9 | 0.5 | 128.1 | 43.6 | 18.3 | 18.3 |
Table 4 Hydrochemical characteristics and element contents in groundwater samples from Tibet |
| Sample number | pH | Eh (mV) | Ec(μs/ cm) | TDS (mg/L) | TH (mg/L) | Ca2+ (mg/L) | Mg2+ (mg/L) | Na+ (mg/L) | K+ (mg/L) | HCO3- (mg/L) | SO42- (mg/L) | Cl- (mg/L) | SiO2 (mg/L) |
|---|---|---|---|---|---|---|---|---|---|---|---|---|---|
| 3 | 7.28 | 262 | 250 | 125 | 119 | 38.1 | 5.6 | 7.0 | 1.3 | 91.5 | 21.3 | 8.5 | 12.7 |
| 4 | 7.31 | 244 | 261 | 131 | 124 | 38.6 | 6.5 | 7.4 | 1.5 | 85.4 | 27.2 | 9.5 | 9.6 |
| 10 | 6.95 | 245 | 279 | 139 | 134 | 39.9 | 8.1 | 10.5 | 1.5 | 103.7 | 10.4 | 15.8 | 16.9 |
| 11 | 7.11 | 233 | 161 | 81 | 83 | 24.3 | 5.3 | 3.2 | 1.0 | 64.1 | 6.4 | 10.0 | 11.1 |
| 13 | 7.10 | 252 | 1587 | 793 | 605 | 131.4 | 66.5 | 152.2 | 7.8 | 485.1 | 156.0 | 182.1 | 10.0 |
| 16 | 7.37 | 213 | 600 | 300 | 320 | 112.3 | 9.4 | 13.7 | 1.8 | 280.7 | 29.6 | 26.6 | 10.6 |
| 17 | 7.28 | 230 | 1399 | 699 | 563 | 102.4 | 73.8 | 112.0 | 4.0 | 515.6 | 143.7 | 152.8 | 9.0 |
| 18 | 7.81 | 205 | 404 | 202 | 165 | 31.7 | 20.6 | 33.7 | 3.7 | 155.6 | 44.1 | 16.3 | 6.8 |
| 19 | 7.37 | 220 | 467 | 233 | 237 | 69.1 | 15.4 | 19.7 | 3.2 | 192.2 | 35.3 | 18.1 | 25.5 |
| 20 | 6.93 | 235 | 458 | 229 | 227 | 61.9 | 17.4 | 18.6 | 4.1 | 167.8 | 46.0 | 16.2 | 33.1 |
| 22 | 7.07 | 243 | 2480 | 124 | 667 | 151.4 | 69.2 | 292.0 | 13.6 | 167.1 | 95.5 | 860.6 | 12.6 |
| 23 | 7.34 | 222 | 732 | 366 | 216 | 52.2 | 20.5 | 103.2 | 5.0 | 378.3 | 44.3 | 32.0 | 9.4 |
| 24 | 7.20 | 220 | 1055 | 528 | 445 | 134.0 | 26.4 | 77.6 | 5.4 | 387.5 | 94.5 | 89.7 | 15.4 |
| 25 | 7.37 | 207 | 554 | 277 | 282 | 69.2 | 26.1 | 23.3 | 2.9 | 259.3 | 49.5 | 17.2 | 9.6 |
| 28 | 7.86 | 191 | 337 | 168 | 169 | 33.2 | 20.6 | 15.8 | 1.5 | 198.3 | 12.0 | 10.5 | 10.6 |
| 29 | 7.56 | 210 | 804 | 402 | 389 | 126.2 | 17.5 | 34.5 | 3.6 | 405.8 | 52.7 | 15.6 | 15.4 |
| 30 | 7.79 | 195 | 307 | 154 | 148 | 32.6 | 15.9 | 16.7 | 2.5 | 61.0 | 19.3 | 65.0 | 10.1 |
| 31 | 6.75 | 245 | 1999 | 1000 | 472 | 144.4 | 26.7 | 363.3 | 20.8 | 970.2 | 86.4 | 35.3 | 25.9 |
| 32 | 7.46 | 226 | 4360 | 2180 | 182 | 48.7 | 14.5 | 1171.0 | 53.4 | 2785.6 | 196.3 | 57.5 | 31.5 |
| 33 | 7.19 | 220 | 2970 | 1487 | 183 | 57.3 | 9.5 | 732.3 | 33.8 | 1424.8 | 137.8 | 40.1 | 89.9 |
| 34 | 7.55 | 180 | 972 | 486 | 315 | 81.6 | 26.5 | 131.5 | 8.5 | 585.8 | 43.0 | 18.1 | 22.9 |
| 37 | 7.77 | 189 | 693 | 346 | 336 | 79.6 | 32.8 | 35.3 | 7.4 | 231.9 | 146.6 | 40.9 | 9.3 |
| 39 | 7.89 | 187 | 669 | 334 | 169 | 26.1 | 25.0 | 98.1 | 5.6 | 195.3 | 64.6 | 50.7 | 13.7 |
| 40 | 7.84 | 193 | 540 | 270 | 224 | 56.8 | 19.8 | 45.2 | 6.5 | 286.8 | 49.5 | 21.6 | 11.6 |
| 41 | 7.89 | 185 | 340 | 170 | 171 | 59.5 | 5.3 | 16.4 | 1.8 | 146.4 | 9.5 | 39.9 | 15.2 |
| 42 | 7.64 | 201 | 814 | 407 | 368 | 102.5 | 26.7 | 43.7 | 4.8 | 106.8 | 154.5 | 119.7 | 17.4 |
| 43 | 7.93 | 193 | 266 | 133 | 134 | 36.5 | 10.2 | 10.0 | 3.0 | 109.8 | 24.8 | 19.4 | 16.7 |
| 45 | 7.55 | 208 | 793 | 397 | 428 | 100.3 | 42.6 | 33.3 | 4.2 | 347.8 | 93.0 | 37.8 | 16.6 |
| 46 | 7.73 | 199 | 628 | 314 | 210 | 38.1 | 27.5 | 71.0 | 4.0 | 207.5 | 76.0 | 51.4 | 17.4 |
| 47 | 7.64 | 223 | 72 | 36 | 315 | 51.4 | 44.9 | 59.8 | 16.2 | 205.9 | 122.1 | 79.0 | 36.8 |
| 48 | 7.73 | 202 | 433 | 217 | 206 | 44.3 | 23.0 | 24.4 | 3.5 | 183.1 | 49.8 | 25.1 | 12.0 |
| 49 | 7.81 | 199 | 270 | 135 | 107 | 35.7 | 4.3 | 21.0 | 2.7 | 85.4 | 29.9 | 21.6 | 17.3 |
| 50 | 7.62 | 208 | 578 | 289 | 243 | 66.2 | 18.6 | 42.6 | 3.9 | 231.9 | 48.8 | 44.0 | 17.2 |
| 51 | 7.81 | 202 | 311 | 155 | 163 | 40.2 | 15.0 | 10.2 | 2.5 | 97.6 | 53.0 | 13.6 | 13.5 |
| 55 | 7.46 | 230 | 770 | 385 | 362 | 124.1 | 12.4 | 18.2 | 2.3 | 238.0 | 39.9 | 86.7 | 13.7 |
| 56 | 7.55 | 222 | 457 | 229 | 233 | 69.8 | 14.1 | 12.0 | 1.2 | 112.9 | 36.2 | 61.9 | 15.6 |
| 59 | 7.81 | 223 | 300 | 150 | 178 | 29.9 | 24.7 | 3.3 | 0.7 | 137.3 | 5.5 | 17.7 | 21.1 |
| 60 | 7.72 | 233 | 211 | 106 | 107 | 35.7 | 4.4 | 5.7 | 1.5 | 42.7 | 26.9 | 27.7 | 11.9 |
Table 5 Concentrations of trace elements in surface water samples from Tibet |
| Sample number | Li (μg/L) | Sr (mg/L) | B (mg/L) | Zn (μg/L) | Se (μg/L) | F (mg/L) | U (μg/L) | Rb (μg/L) | Ba (μg/L) | Co (μg/L) | Cs (μg/L) | Ga (μg/L) | V (μg/L) |
|---|---|---|---|---|---|---|---|---|---|---|---|---|---|
| 1 | 0.25 | 0.10 | 0.01 | 1.48 | 0.00 | 0.02 | 0.20 | 0.36 | 4.43 | 0.04 | 0.00 | 0.20 | 0.08 |
| 2 | 0.87 | 0.09 | 0.01 | 0.36 | 0.20 | 0.04 | 0.15 | 0.05 | 0.42 | 0.06 | 0.01 | 0.01 | -0.11 |
| 5 | 0.16 | 0.07 | 0.01 | 7.77 | 0.00 | 0.04 | 0.24 | 0.28 | 1.56 | 0.03 | 0.46 | 0.08 | 0.77 |
| 6 | 2.29 | 0.05 | 0.09 | 3.48 | 0.00 | 0.04 | 0.03 | 0.62 | 3.16 | 0.06 | 0.10 | 0.17 | 0.11 |
| 7 | 0.33 | 0.04 | 0.01 | 2.16 | 0.00 | 0.04 | 0.02 | 0.31 | 1.86 | 0.04 | 0.03 | 0.10 | -0.12 |
| 8 | 2.20 | 0.05 | 0.10 | 1.97 | 0.03 | 0.04 | 0.04 | 0.51 | 2.65 | 0.07 | 0.06 | 0.13 | 0.04 |
| 9 | 0.38 | 0.04 | 0.01 | 1.12 | 0.00 | 0.04 | 0.02 | 0.37 | 1.92 | 0.05 | 0.04 | 0.11 | -0.06 |
| 12 | 0.92 | 0.06 | 0.01 | 1.86 | 0.00 | 0.06 | 0.71 | 0.77 | 3.26 | 0.03 | 0.03 | 0.17 | -0.06 |
| 14 | 12.6 | 0.14 | 0.12 | 0.57 | 0.01 | 0.25 | 5.57 | 0.65 | 11.97 | 0.07 | 0.04 | 0.54 | -0.07 |
| 15 | 10.2 | 0.49 | 0.09 | 1.17 | 0.08 | 0.36 | 3.28 | 1.99 | 7.77 | 0.07 | 0.83 | 0.38 | -0.07 |
| 21 | 8.23 | 0.09 | 0.11 | 3.06 | 0.02 | 0.17 | 0.18 | 1.42 | 5.74 | 0.10 | 0.17 | 0.36 | 0.31 |
| 26 | 42.5 | 0.37 | 0.25 | 0.92 | 0.07 | 0.16 | 1.13 | 5.10 | 50.22 | 0.08 | 2.22 | 2.24 | -0.30 |
| 27 | 14.4 | 0.26 | 0.22 | 0.55 | 0.01 | 0.16 | 3.37 | 0.57 | 25.26 | 0.10 | 0.03 | 1.10 | -0.16 |
| 35 | 140 | 3.05 | 1.50 | 2.91 | 0.52 | 0.58 | 10.85 | 0.42 | 13.08 | 0.10 | 0.18 | 0.56 | 0.27 |
| 36 | 18.3 | 0.30 | 0.18 | 57.33 | 0.25 | 0.15 | 0.93 | 1.84 | 29.23 | 0.03 | 0.69 | 1.28 | 0.28 |
| 38 | 8.87 | 0.25 | 0.24 | 1.97 | 0.11 | 0.13 | 1.58 | 0.50 | 7.19 | 0.05 | 0.10 | 0.32 | -0.23 |
| 44 | 162 | 0.24 | 0.52 | 1.72 | 0.18 | 0.18 | 1.20 | 6.96 | 16.13 | 0.05 | 18.83 | 0.69 | -0.36 |
| 52 | 22.3 | 0.69 | 0.34 | 4.18 | 0.85 | 0.04 | 1.35 | 7.76 | 12.15 | 0.06 | 12.05 | 0.50 | -0.43 |
| 53 | 2.48 | 0.18 | 0.07 | 5.80 | 0.13 | 0.15 | 0.31 | 0.66 | 13.27 | 0.09 | 0.28 | 0.60 | -0.43 |
| 54 | 2.59 | 0.08 | 0.14 | 3.70 | 0.19 | 0.07 | 0.08 | 0.78 | 5.95 | 0.03 | 0.07 | 0.24 | -0.36 |
| 57 | 2.67 | 0.12 | 0.10 | 2.46 | 0.22 | 0.24 | 0.52 | 0.17 | 1.29 | 0.04 | 0.03 | 0.05 | -0.41 |
| 58 | 7.3 | 0.29 | 0.21 | 1.45 | 0.45 | 0.14 | 0.95 | 0.27 | 5.07 | 0.05 | 0.09 | 0.21 | -0.09 |
Table 6 Concentrations of trace elements in groundwater samples from Tibet |
| Sample number | Li (μg/L) | Sr (mg/L) | B (mg/L) | Zn (μg/L) | Se (μg/L) | F (mg/L) | U (μg/L) | Rb (μg/L) | Ba (μg/L) | Co (μg/L) | Cs (μg/L) | Ga (μg/L) | V (μg/L) |
|---|---|---|---|---|---|---|---|---|---|---|---|---|---|
| 3 | 48.9 | 0.15 | 0.18 | 55.80 | 0.00 | 0.09 | 2.39 | 6.08 | 6.49 | 0.05 | 5.45 | 0.30 | 0.15 |
| 4 | 50.3 | 0.15 | 0.20 | 7.68 | 0.00 | 0.12 | 2.41 | 6.49 | 11.98 | 0.06 | 9.06 | 0.58 | 0.09 |
| 10 | 2.97 | 0.15 | 0.13 | 1.16 | 0.00 | 0.04 | 0.30 | 0.09 | 33.48 | 0.07 | 0.02 | 1.66 | -0.08 |
| 11 | 1.15 | 0.09 | 0.02 | 21.54 | 0.00 | 0.06 | 0.21 | 0.07 | 25.74 | 0.04 | 0.16 | 1.33 | -0.16 |
| 13 | 105 | 1.03 | 0.37 | 7.14 | 0.04 | 0.38 | 5.54 | 4.49 | 87.75 | 0.58 | 0.99 | 4.22 | 0.38 |
| 16 | 12.7 | 0.27 | 0.15 | 3.40 | 0.00 | 0.08 | 1.95 | 0.57 | 64.37 | 0.31 | 0.03 | 3.10 | 0.21 |
| 17 | 95.3 | 1.40 | 0.49 | 1.47 | 0.05 | 0.48 | 5.83 | 0.88 | 24.06 | 0.41 | 0.02 | 1.07 | 0.32 |
| 18 | 54.4 | 0.31 | 0.31 | 0.99 | 0.03 | 0.26 | 2.15 | 5.88 | 21.20 | 0.07 | 2.06 | 0.98 | 0.32 |
| 19 | 60.6 | 0.29 | 0.18 | 2.06 | 0.01 | 0.43 | 1.49 | 4.53 | 18.29 | 0.10 | 0.03 | 0.85 | -0.27 |
| 20 | 85.0 | 0.27 | 0.18 | 10.43 | 0.00 | 0.27 | 0.24 | 5.68 | 53.84 | 0.65 | 0.02 | 2.54 | -0.26 |
| 22 | 79.8 | 0.80 | 0.36 | 4.40 | 0.05 | 0.22 | 4.09 | 9.31 | 71.36 | 0.36 | 0.64 | 3.12 | 2.19 |
| 23 | 121.77 | 0.28 | 0.41 | 3.24 | 0.00 | 0.33 | 0.93 | 2.87 | 8.80 | 0.06 | 0.03 | 0.38 | -0.04 |
| 24 | 24.6 | 0.45 | 0.32 | 2.00 | 0.03 | 0.10 | 2.93 | 1.01 | 60.78 | 0.34 | 0.01 | 2.70 | 0.20 |
| 25 | 39.9 | 0.88 | 0.22 | 4.79 | 0.08 | 0.19 | 1.65 | 2.14 | 73.71 | 0.09 | 0.04 | 3.24 | -0.12 |
| 28 | 10.4 | 0.25 | 0.21 | 24.22 | 0.07 | 0.20 | 1.48 | 0.38 | 42.85 | 0.06 | 0.01 | 1.92 | 0.34 |
| 29 | 37.4 | 0.63 | 0.22 | 22.15 | 0.05 | 0.19 | 22.77 | 0.46 | 41.98 | 0.23 | 0.01 | 1.81 | -0.06 |
| 30 | 35.7 | 0.26 | 0.31 | 2.90 | 0.05 | 0.33 | 1.44 | 1.19 | 26.70 | 0.05 | 0.04 | 1.18 | 0.13 |
| 31 | 745 | 1.64 | 2.92 | 18.34 | 0.04 | 3.05 | 0.42 | 82.40 | 94.15 | 0.28 | 85.13 | 4.50 | -0.58 |
| 32 | 2658 | 1.96 | 8.61 | 1.94 | 0.13 | 7.24 | 0.06 | 190.64 | 75.57 | 0.10 | 428.09 | 3.33 | 0.10 |
| 33 | 1495 | 1.77 | 5.35 | 1.80 | 0.06 | 3.56 | 0.31 | 125.09 | 102.19 | 0.05 | 144.69 | 4.69 | -0.22 |
| 34 | 295 | 0.86 | 1.18 | 2.47 | 0.15 | 1.34 | 1.45 | 33.29 | 104.00 | 0.11 | 48.34 | 4.75 | 0.81 |
| 37 | 29.9 | 0.47 | 0.60 | 6.76 | 0.75 | 0.27 | 13.46 | 2.93 | 33.63 | 0.10 | 15.38 | 1.44 | -0.09 |
| 39 | 96.5 | 0.51 | 1.62 | 6.16 | 0.22 | 0.32 | 4.74 | 1.46 | 43.89 | 0.13 | 0.07 | 1.96 | 2.06 |
| 40 | 142 | 0.67 | 1.05 | 1.76 | 0.16 | 0.33 | 3.75 | 18.55 | 104.26 | 0.09 | 7.65 | 4.64 | 3.42 |
| 41 | 18.98 | 0.23 | 0.43 | 2.12 | 0.08 | 0.14 | 1.93 | 0.35 | 43.80 | 0.08 | 0.07 | 1.97 | 0.13 |
| 42 | 64.7 | 0.71 | 1.06 | 3.44 | 0.10 | 0.26 | 11.61 | 0.57 | 28.43 | 0.20 | 0.08 | 1.23 | 0.13 |
| 43 | 27.7 | 0.19 | 0.77 | 2.91 | 0.09 | 0.24 | 1.30 | 1.19 | 11.28 | 0.05 | 0.11 | 0.49 | -0.23 |
| 45 | 55.0 | 0.79 | 0.60 | 2.59 | 0.24 | 0.39 | 2.71 | 3.17 | 25.84 | 0.09 | 1.66 | 1.11 | -0.13 |
| 46 | 49.5 | 0.55 | 1.11 | 0.99 | 0.49 | 0.33 | 2.29 | 1.09 | 24.86 | 0.05 | 0.07 | 1.09 | 0.55 |
| 47 | 458 | 0.45 | 2.11 | 428.69 | 0.53 | 1.20 | 9.08 | 51.88 | 23.02 | 0.08 | 119.46 | 0.98 | 1.84 |
| 48 | 116 | 0.79 | 0.96 | 68.11 | 0.57 | 0.19 | 1.86 | 14.48 | 36.96 | 0.05 | 70.10 | 1.64 | 0.28 |
| 49 | 33.0 | 0.16 | 1.39 | 15.97 | 0.14 | 0.14 | 1.26 | 5.20 | 12.03 | 0.05 | 0.99 | 0.52 | 0.43 |
| 50 | 159 | 0.41 | 2.32 | 6.95 | 0.09 | 0.14 | 3.41 | 6.22 | 30.70 | 0.17 | 6.99 | 1.33 | 0.34 |
| 51 | 30.3 | 0.41 | 0.58 | 5.94 | 0.24 | 0.11 | 1.72 | 2.06 | 39.20 | 0.04 | 0.77 | 1.72 | -0.01 |
| 55 | 14.2 | 0.46 | 0.07 | 3.80 | 0.11 | 0.04 | 2.27 | 0.25 | 9.52 | 0.15 | 0.04 | 0.39 | -0.23 |
| 56 | 7.49 | 0.33 | 0.10 | 3.35 | 0.90 | 0.06 | 0.86 | 0.68 | 17.18 | 0.10 | 0.78 | 0.76 | -0.25 |
| 59 | 3.12 | 0.12 | 0.09 | 1.19 | 0.18 | 0.07 | 0.43 | 0.43 | 6.84 | 0.04 | 0.45 | 0.28 | -0.29 |
| 60 | 31.9 | 0.13 | 0.15 | 24.38 | 0.18 | 0.11 | 1.14 | 3.75 | 6.17 | 0.04 | 5.46 | 0.26 | -0.47 |
Table 7 Concentrations of toxic elements in surface water samples from Tibet |
| Sample number | Al (μg/L) | As (μg/L) | Be (μg/L) | Cr (μg/L) | Cu (μg/L) | Fe (μg/L) | Mn (μg/L) | Mo (μg/L) | Ni (μg/L) | Pb (μg/L) | Se (μg/L) |
|---|---|---|---|---|---|---|---|---|---|---|---|
| 1 | 3.26 | 1.10 | 0.05 | 6.77 | 0.31 | 76.00 | 0.09 | 1.56 | 0.71 | 0.00 | 0.00 |
| 2 | 0.37 | 2.05 | 0.04 | 10.71 | 0.21 | 106.38 | 0.06 | 0.72 | 0.93 | 0.01 | 0.20 |
| 5 | 0.59 | 89.38 | 0.06 | 9.79 | -0.05 | 66.10 | 0.04 | 0.21 | 0.57 | 0.00 | 0.00 |
| 6 | 87.74 | 0.90 | 0.03 | 4.90 | 0.64 | 68.68 | 0.65 | 0.23 | 0.55 | 0.06 | 0.00 |
| 7 | 16.93 | 0.30 | 0.03 | 2.96 | 0.54 | 36.31 | 0.13 | 0.23 | 0.53 | 0.02 | 0.00 |
| 8 | 60.61 | 0.76 | 0.09 | 3.10 | 0.57 | 60.99 | 2.44 | 0.24 | 0.54 | 0.05 | 0.03 |
| 9 | 26.73 | 0.31 | 0.04 | 2.58 | 0.51 | 43.60 | 0.41 | 0.25 | 0.44 | 0.04 | 0.00 |
| 12 | 3.57 | 10.59 | 0.01 | 4.97 | 0.09 | 51.28 | 0.11 | 0.61 | 0.50 | 0.00 | 0.00 |
| 14 | 1.34 | 0.68 | 0.05 | 5.65 | 0.94 | 97.90 | 1.45 | 0.71 | 2.08 | 0.02 | 0.01 |
| 15 | 0.80 | 1.74 | 0.03 | 4.83 | 0.16 | 121.11 | 0.36 | 1.58 | 1.19 | 0.04 | 0.08 |
| 21 | 385.72 | 0.86 | -0.02 | 6.87 | 0.78 | 251.87 | 2.75 | 0.27 | 1.23 | 0.25 | 0.02 |
| 26 | 4.52 | 1.51 | -0.06 | 2.42 | 0.26 | 134.14 | 0.04 | 0.33 | 1.54 | 0.01 | 0.07 |
| 27 | 2.00 | 1.36 | -0.04 | 2.01 | 0.38 | 167.27 | 0.34 | 1.06 | 2.02 | 0.02 | 0.01 |
| 35 | 0.98 | 1.63 | -0.04 | 2.39 | 1.52 | 140.65 | 0.09 | 2.80 | 1.95 | 0.01 | 0.52 |
| 36 | 0.30 | 2.22 | -0.04 | 6.03 | 0.86 | 50.03 | 0.11 | 0.80 | 0.51 | 0.05 | 0.25 |
| 38 | 2.20 | 2.96 | -0.01 | 1.18 | 0.18 | 87.86 | 0.05 | 0.58 | 0.91 | 0.00 | 0.11 |
| 44 | 0.99 | 3.44 | -0.07 | 1.09 | -0.02 | 109.53 | 0.16 | 0.64 | 1.02 | 0.01 | 0.18 |
| 52 | 1.45 | 1.81 | 0.00 | 1.91 | -0.03 | 146.57 | 0.13 | 0.34 | 1.86 | 0.01 | 0.85 |
| 53 | 84.26 | 0.73 | -0.02 | 0.67 | 0.37 | 75.09 | 6.62 | 0.52 | 1.06 | 0.05 | 0.13 |
| 54 | 42.07 | 6.97 | 0.02 | 0.62 | 0.13 | 44.11 | 0.55 | 1.51 | 0.54 | 0.07 | 0.19 |
| 57 | 1.08 | 1.20 | -0.05 | 1.08 | -0.07 | 75.46 | 0.27 | 0.88 | 0.73 | 0.01 | 0.22 |
| 58 | 0.70 | 2.00 | -0.08 | 8.40 | 0.08 | 91.71 | 0.11 | 0.44 | 0.87 | 0.01 | 0.45 |
Table 8 Concentrations of toxic elements in groundwater samples from Tibet |
| Sample number | Al (μg/L) | As (μg/L) | Be (μg/L) | Cr (μg/L) | Cu (μg/L) | Fe (μg/L) | Mn (μg/L) | Mo (μg/L) | Ni (μg/L) | Pb (μg/L) | Se (μg/L) |
|---|---|---|---|---|---|---|---|---|---|---|---|
| 3 | 0.19 | 1.96 | -0.02 | 10.35 | -0.04 | 98.39 | 0.07 | 0.96 | 0.77 | 0.01 | 0.00 |
| 4 | 0.46 | 3.10 | -0.04 | 10.63 | 0.02 | 100.00 | 0.02 | 0.80 | 0.82 | 0.00 | 0.00 |
| 10 | 99.64 | 0.48 | 0.06 | 9.66 | 0.23 | 96.70 | 0.39 | 0.10 | 0.86 | 0.01 | 0.00 |
| 11 | 0.55 | 1.06 | -0.04 | 8.46 | -0.01 | 59.88 | 0.83 | 0.08 | 0.53 | 0.03 | 0.00 |
| 13 | 0.95 | 0.38 | 0.00 | 13.97 | 1.55 | 344.86 | 242.76 | 0.59 | 5.75 | 0.09 | 0.04 |
| 16 | 1.10 | 0.54 | 0.04 | 18.13 | 1.07 | 257.68 | 0.11 | 0.16 | 2.71 | 0.01 | 0.00 |
| 17 | 7.28 | 0.58 | -0.01 | 12.06 | 0.88 | 238.17 | 0.09 | 0.39 | 2.61 | 0.01 | 0.05 |
| 18 | 33.97 | 5.09 | 0.05 | 3.48 | 0.62 | 78.13 | 0.30 | 0.67 | 1.60 | 0.02 | 0.03 |
| 19 | 0.75 | 0.64 | -0.01 | 7.97 | 0.19 | 148.33 | 0.23 | 0.24 | 1.46 | 0.01 | 0.01 |
| 20 | 0.49 | 0.61 | -0.07 | 16.32 | 0.04 | 143.27 | 514.97 | 0.21 | 1.84 | 0.01 | 0.00 |
| 22 | 1.15 | 1.05 | -0.03 | 6.78 | 3.35 | 320.31 | 19.15 | 0.41 | 5.85 | 0.02 | 0.05 |
| 23 | 0.49 | 0.63 | -0.03 | 4.62 | 0.50 | 112.17 | 0.55 | 0.15 | 1.13 | 0.01 | 0.00 |
| 24 | 0.30 | 0.47 | 0.02 | 4.87 | 0.84 | 269.51 | 0.11 | 0.10 | 3.46 | 0.01 | 0.03 |
| 25 | 0.26 | 1.20 | -0.08 | 2.86 | 0.31 | 140.86 | 0.03 | 0.51 | 1.40 | 0.00 | 0.08 |
| 28 | 1.19 | 0.87 | 0.00 | 2.98 | 0.15 | 65.05 | 0.08 | 0.20 | 0.75 | 0.01 | 0.07 |
| 29 | 4.38 | 3.21 | -0.08 | 3.77 | 0.59 | 246.08 | 0.55 | 0.91 | 2.45 | 0.02 | 0.05 |
| 30 | 0.44 | 1.54 | -0.02 | 2.00 | 0.12 | 62.22 | 0.06 | 0.99 | 0.66 | 0.02 | 0.05 |
| 31 | 0.67 | 46.19 | 0.14 | 60.90 | 2.51 | 333.99 | 2.82 | 2.25 | 4.22 | 0.02 | 0.04 |
| 32 | 2.13 | 333.92 | 0.07 | 19.04 | 7.56 | 125.91 | 5.81 | 0.11 | 1.64 | 0.07 | 0.13 |
| 33 | 0.63 | 219.94 | 0.23 | 33.60 | 4.51 | 110.92 | 6.62 | 0.30 | 1.03 | 0.02 | 0.06 |
| 34 | 0.47 | 2.46 | -0.03 | 9.48 | 0.82 | 155.70 | 0.20 | 0.58 | 1.60 | 0.02 | 0.15 |
| 37 | 0.45 | 1.29 | 0.00 | 3.63 | 0.94 | 156.06 | 0.06 | 2.19 | 1.79 | 0.01 | 0.75 |
| 39 | 0.62 | 6.81 | -0.04 | 6.45 | 1.16 | 45.64 | 0.07 | 2.19 | 0.74 | 0.01 | 0.22 |
| 40 | 1.35 | 4.42 | -0.05 | 1.84 | 0.53 | 107.69 | 0.04 | 0.59 | 1.25 | 0.01 | 0.16 |
| 41 | 1.27 | 3.77 | -0.03 | 1.49 | 0.17 | 107.52 | 0.00 | 0.47 | 1.10 | 0.01 | 0.08 |
| 42 | 0.67 | 2.22 | 0.05 | 1.64 | 0.84 | 190.51 | 0.01 | 2.36 | 2.07 | 0.05 | 0.10 |
| 43 | 0.49 | 4.46 | -0.04 | 1.20 | 0.13 | 65.08 | 0.01 | 0.54 | 0.65 | 0.01 | 0.09 |
| 45 | 0.47 | 1.28 | 0.04 | 3.68 | 0.04 | 188.20 | 0.04 | 1.06 | 1.89 | 0.01 | 0.24 |
| 46 | 0.43 | 3.03 | -0.02 | 7.20 | 0.29 | 64.15 | 0.42 | 1.02 | 0.70 | 0.01 | 0.49 |
| 47 | 0.31 | 163.55 | -0.06 | 1.50 | 0.74 | 89.59 | 0.94 | 6.02 | 0.98 | 0.02 | 0.53 |
| 48 | 0.68 | 57.96 | -0.10 | 2.07 | 0.20 | 80.98 | 0.02 | 1.28 | 0.81 | 0.01 | 0.57 |
| 49 | 7.98 | 56.21 | -0.03 | 0.81 | 0.06 | 64.30 | 0.00 | 0.98 | 0.65 | 0.01 | 0.14 |
| 50 | 0.91 | 17.48 | 0.02 | 1.61 | 0.30 | 122.64 | 0.13 | 0.59 | 1.82 | 0.01 | 0.09 |
| 51 | 0.63 | 1.09 | -0.03 | 1.62 | 0.00 | 74.42 | 0.02 | 0.72 | 0.73 | 0.01 | 0.24 |
| 55 | 0.86 | 1.51 | -0.04 | 5.66 | 0.12 | 238.44 | 0.11 | 0.36 | 2.18 | 0.01 | 0.11 |
| 56 | 21.45 | 3.56 | -0.03 | 2.78 | 0.25 | 133.97 | 2.34 | 0.64 | 1.44 | 0.02 | 0.90 |
| 59 | 0.97 | 2.50 | 0.01 | 4.65 | 0.09 | 53.98 | 0.00 | 0.18 | 0.92 | 0.02 | 0.18 |
| 60 | 1.55 | 1.87 | -0.03 | 1.02 | 0.00 | 65.49 | 0.62 | 1.34 | 0.75 | 0.01 | 0.18 |
Table 9 Major and trace element test standards for water quality |
| Parameter | Standards for Drinking Water Quality (MOHC, 2006) | Guidelines for Drinking Water Quality (WHO, 2004) | Drink Natural Mineral Water (AQSIQ, 2008) |
|---|---|---|---|
| pH | 6.5-8.5 | 6.5-9.5 | – |
| TDS (mg/L) | 1000 | 1000 | ≥1000 |
| TH (mg/L) | 450 | 500 | – |
| Na+ (mg/L) | 200 | 200 | – |
| SO42- (mg/L) | 250 | 500 | – |
| Cl- (mg/L) | 250 | 250 | – |
| H2SiO3 (mg/L) | – | – | ≥25.0 |
| Li (μg/L) | – | – | ≥200 |
| Sr (mg/L) | – | – | ≥0.2 |
| B (mg/L) | 0.5 | 0.5 | <5 |
| Zn (μg/L) | 1000 | 3000 | ≥200 |
| Se (μg/L) | 10 | 10 | ≥10 |
| F (mg/L) | 1 | 1.5 | <1.5 |
| U (μg/L) | – | 15 | – |
| Ba (μg/L) | 700 | 700 | <700 |
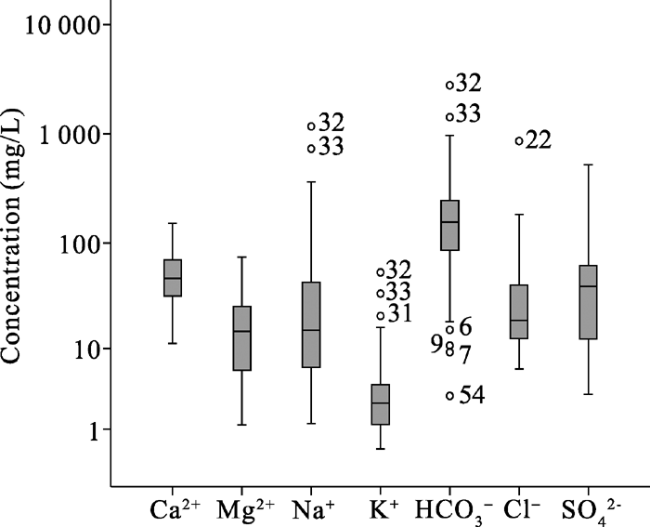
Figure 3 Box and whisker plots showing the variation of major ion concentrations in water samples from Tibet |
Table 10 Harmful element test standards for water quality |
| Element (μg/L) | Standards for Drinking Water Quality (MOHC, 2006) | Guidelines for Drinking-Water Quality (WHO, 2004) | Drink Natural Mineral Water (AQSIQ, 2008) |
|---|---|---|---|
| Ag | 50 | 100 | <50 |
| Al | 200 | 200 | – |
| As | 10 | 10 | <10 |
| Be | 2 | – | – |
| Cd | 5 | 3 | <3 |
| Cr | 50 | 50 | <50 |
| Cu | 1000 | 2000 | <1000 |
| Fe | 300 | 300 | – |
| Hg | 1 | 1 | <1 |
| Mn | 100 | 400 | <400 |
| Mo | 70 | 70 | – |
| Ni | 20 | 20 | <20 |
| Pb | 10 | 10 | <10 |
| Se | 10 | 10 | <50 |
| Tl | 0.1 | – | – |
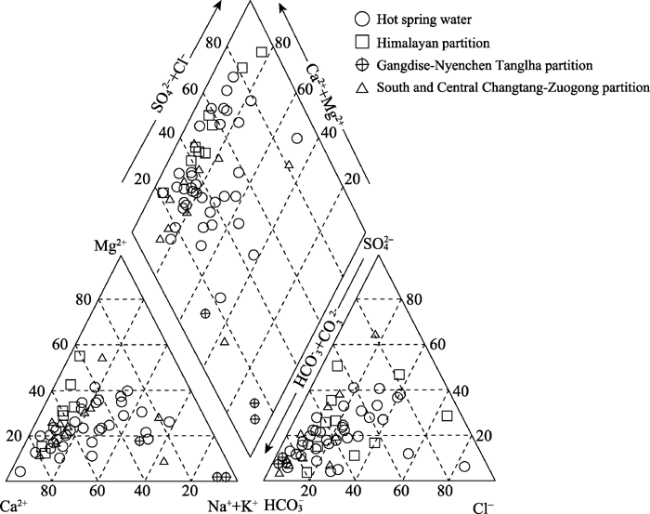
Figure 4 Piper diagram showing the major concentrations of cations and anions in waters of Tibet by geological setting |
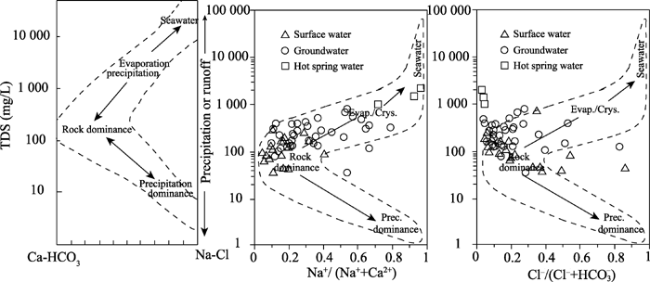
Figure 5 Plots of the major ions within the Gibbs boomerang envelope for waters in Tibet |
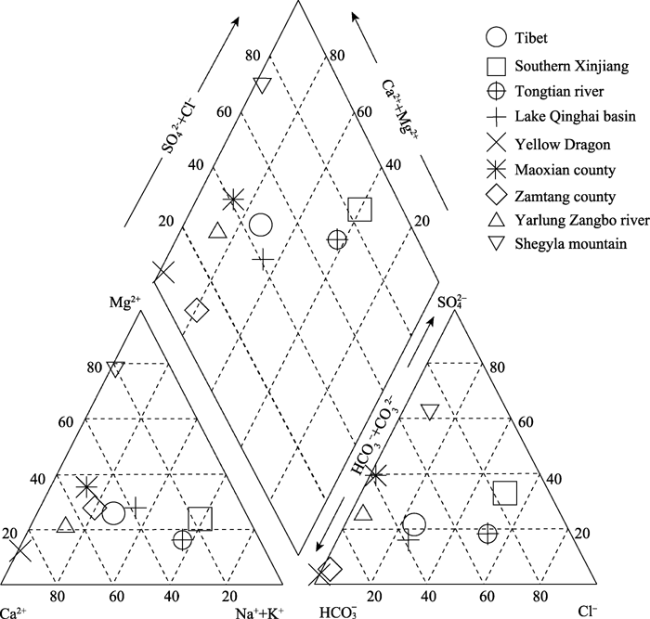
Table 11 Hydrochemical characteristics in different regions of western China |
| Tibet | Southern Xinjiang | Tongtian River | Qinghai Lake Basin | Huanglong | Maoxian county | Zamtang county | Yarlung Zangbo River between Lhasa-Nyingchi | Shegyla Mountain | |
|---|---|---|---|---|---|---|---|---|---|
| Number of samples | 57 | 154 | 9 | 75 | 9 | 63 | 423 | 62 | 9 |
| pH | 7.55 | 7.64 | 8.09 | 8.09 | 6.59 | 7.7 | 7.43 | 7.74 | 7.46 |
| K+ | 3.09 | 17.87 | 6.77 | 1.87 | 0.4 | 2.36 | 14.25 | 3.16 | 0.14 |
| Na+ | 34.93 | 336.97 | 118.02 | 36.42 | 3.14 | 19.12 | 4.89 | 0.03 | |
| Ca2+ | 55.25 | 90.1 | 51.77 | 37.38 | 253.78 | 70.36 | 33.77 | 29.74 | 1.6 |
| Mg2+ | 18.69 | 73.78 | 18.82 | 16.04 | 20.94 | 28.38 | 10.4 | 5.56 | 3.82 |
| Cl- | 47.67 | 509.41 | 179.88 | 47 | 0.73 | 7.37 | 3.9 | 3.87 | 7.41 |
| SO42- | 54.68 | 429.08 | 83.34 | 39.35 | 23.2 | 119.6 | 8.05 | 25.83 | 62.52 |
| HCO3- | 169.67 | 260.28 | 170.63 | 183.37 | 777.44 | 226.27 | 171.21 | 90.28 | 33.9 |
| Reference | This study | Liu et al. (2014), Pang et al. (2010), Zhang et al. (1995) | Su et al. (1987) | Xu et al. (2010) | Wang et al. (2009) | Du (2011) | Cao (2011) | Liu (2011) | Ren et al. (2002) |
Figure 6 Piper diagram showing major ion compositions of natural water in different regions of western China |
 . The main hydrochemical types of Tibetan water are Ca-HCO3, Ca-Mg-HCO3 and Ca-Mg-HCO3-SO4. From south to north, the main cation in water changes from Ca2+ to Na+, whereas the main anions in water change from
  to Cl- and
  .
.The authors have declared that no competing interests exist.
| 1 |
|
| 2 |
|
| 3 |
|
| 4 |
|
| 5 |
|
| 6 |
|
| 7 |
|
| 8 |
|
| 9 |
|
| 10 |
|
| 11 |
|
| 12 |
|
| 13 |
|
| 14 |
|
| 15 |
|
| 16 |
|
| 17 |
|
| 18 |
|
| 19 |
|
| 20 |
|
| 21 |
|
| 22 |
|
| 23 |
|
| 24 |
|
| 25 |
|
| 26 |
|
| 27 |
|
| 28 |
|
| 29 |
|
| 30 |
|
| 31 |
|
| 32 |
|
| 33 |
|
| 34 |
|
| 35 |
|
| 36 |
|
| 37 |
|
| 38 |
|
| 39 |
|
| 40 |
|
| 41 |
|
| 42 |
|
| 43 |
|
| 44 |
|
| 45 |
|
/
| 〈 |
|
〉 |