Orginal Article

Evidence for a recent warming and wetting in the source area of the Yellow River (SAYR) and its hydrological impacts

  • TIAN Hui , 1, 2 ,
  • LAN Yongchao , 1, * ,
  • WEN Jun 1 ,
  • JIN Huijun 1 ,
  • WANG Chenghai 2 ,
  • WANG Xin 1 ,
  • KANG Yue 1
Expand
  • 1. Key Laboratory of Land Surface Process and Climate Change in Cold and Arid Regions, CAS, Lanzhou 730000, China
  • 2. College of Atmospheric Sciences, Lanzhou University, Lanzhou 730000, China

*Corresponding author: Lan Yongchao (1957-), Professor, E-mail:

Author: Tian Hui (1970-), PhD, specialized in land surface processes observation and remote sensing, climate change and water resources. E-mail:

Received date: 2014-08-20

  Accepted date: 2015-01-10

  Online published: 2015-06-15

Supported by

The Key Deployment Project of the Chinese Academy of Sciences, No.Y322G73001

National Natural Science Foundation of China, No.91225302, No.91437217, No.41375022, No.41175027

Copyright

Journal of Geographical Sciences, All Rights Reserved

Abstract

Climate change investigation at a watershed-scale plays a significant role in revealing the historical evolution and future trend of the runoff variation in watershed. This study examines the multisource hydrological and meteorological variables over the source area of the Yellow River (SAYR) from 1961 to 2012 and the future climate scenarios in the region during 2006-2100 based on the CMIP5 projection data. It recognizes the significant characteristics of the recent climate change in the SAYR and predicts the change trend of future flow in the region. It is found that (1) The climate in the SAYR has experienced a significant warm-wet change since the early 2000s, which is very different from the antecedent warm-dry trend since the late 1980s; (2) The warm-wet trend in the northwestern SAYR (the headwater area of the Yellow River (HAYR), is more obvious than that in the whole SAYR; (3) With precipitation increase, the runoff in the region also experienced an increasing process since 2006. The runoff variations in the region are sensitive to the changes of precipitation, PET and maximum air temperature, but not very sensitive to changes in mean and minimum air temperatures; (4) Based on the CMIP5 projection data, the warm-wet climate trend in SAYR are likely to continue until 2049 if considering three different (i.e. RCP2.6, RCP4.5 and RCP8.5) greenhouse gas emission scenarios, and the precipitation in SAYR will not be less than the current level before 2100; however, it is estimated that the recent flow increase in the SAYR is likely to be the decadal change and it will at most continue until the 2020s; (5) The inter-annual variations of the East Asian winter monsoon are found to be closely related to the variations of annual precipitation in the region. Meanwhile, the increased precipitation as well as the increase of potential evapotranspiration (PET) being far less than that of precipitation in the recent period are the main climate causes for the flow increase in the region.

Cite this article

TIAN Hui , LAN Yongchao , WEN Jun , JIN Huijun , WANG Chenghai , WANG Xin , KANG Yue . Evidence for a recent warming and wetting in the source area of the Yellow River (SAYR) and its hydrological impacts[J]. Journal of Geographical Sciences, 2015 , 25(6) : 643 -668 . DOI: 10.1007/s11442-015-1194-7

1 Introduction

Over the past several decades, climate changes have resulted in the notable changes in hydrological processes in many basins globally, especially a series of water resources problems in different regions (Zhang et al., 2001; Li et al., 2007). At the same time, a number of investigations have been implemented to discover the intrinsic relationship between climate changes and water resources and improve the existing management measures of water environment (Westmacott and Burn, 1997; Abdul Aziz and Burn, 2006). Therefore, the spatial-temporal patterns of climate variables and their impacts on multi-scale water cycles have become one of the hot topics in the field of hydrology. For instance, many scholars (Coulibaly, 2006; daSilva, 2004; Andreo et al., 2006) used hydrometeorological variables such as precipitation, temperature, evaporation and runoff to diagnose the climate changes and reveal the relevant hydrological responses at the regional and global scales.
In China, in the recent years there were a number of studies focusing on the relationship between the land surface water resources and climate changes in the Yellow River watershed including its upper and middle and lower reaches (Zhao et al., 2007; Huang et al., 2009; Wang, 2009; Cuo et al., 2013; Yao et al., 2013).
The relationship between the climate and water resources in the source area of the Yellow River (SAYR) is also getting more and more attention. Li et al. (2004) analyzed the hydrometeorological patterns in the SAYR by using the 1961-2002 station-based hydrometeorological data. They argued that the decrease in precipitation, especially its decease in summer, is the direct cause for the decrease in the flow in the SAYR. Therefore, they drew a conclusion that precipitation is the main climate factor to control flow in the region. Zhang et al. (2004) evaluated the regional water balance status in the headwater area of the Yellow River (HAYR) by using the 1956-1999 hydrometeorological data (especially the corrected evaporation pan data). They found that the hydrologic cycle in the region has experienced an outstanding change since the 1990s; the flow in the region obviously decreased while the precipitation kept almost invariant in the same period. They came to a conclusion that the rising evaporation should be the main cause for the significant decrease in the flow in the HAYR. Therefore, based on the lasting increase in air temperature, they predicted that the flow will continue to decrease in the 21st century in the region. Chang et al. (2007) also investigated the influencing factors of the flow change in the HAYR from 1955 to 2005 through the land surface water balance model. Their analyses indicated that in the HAYR the sensitivity of the flow to precipitation is much higher than that to air temperature; the discharge has shown a declining trend in the past 50 years especially since the 1990s, which is mainly due to the persistent increase in evaporation.
In their latest research, Li et al. (2012) used the much longer term (<xref ref-type="bibr" rid="b0">i.e. from 1956 to 2010</xref>) hydrometeorological data to determine the climate factors of the flow variations in the SAYR. They reported that the annual mean flow has showed a decreasing trend in the recent 50 years, for which the decreasing precipitation, the rising evaporation and the degraded frozen soil should be responsible. They also added that the decrease of precipitation in the region is due to the weakened South China Sea summer monsoon; according to the regional climate model PRECIS prediction, the flows in the region are likely to decrease generally in the future 20 years. Lan et al. (2010) analyzed the characteristics of the runoff in the SAYR by using the 1960-2002 station-measured hydrometeorological data. They found that the runoff has decreased continually since the end of the 1980s because the mean temperature has risen and precipitation has decreased; the increasing magnitude of runoff in future several decades may be more than that of precipitation because of the synchronously increasing supply of meltwater from snow, glacier, and frozen soils. They also provided the possible changes of the runoff in the region under a suppositional future climate change scenario.
Although previous studies are of important value in understanding the variations of the climate and the land surface water balance in the SAYR, the attention of most of them is mainly absorbed in the second half of the 20th century (from the late 1950s to 2000 or so), and researches about the latest trends of climate and water resources changes in the recent decade are seldom reported. All these previous studies agree that the climate changes in the SAYR (including the HAYR) during the past several decades exhibited a warm-dry trend, i.e. the lasting increase in air temperature and evaporation and the decrease in precipitation and flow; the trend has become increasingly significant since the 1990s. Therefore, it can be concluded according to these studies that the principal climate cause for the decrease in the land surface water resources in the region is the long-term warming and drying. However, can the warm-dry trend reported in the previous studies reflect the recent characteristics of climate change in the SAYR?
In addition, an obvious defect in the previous studies is that they only used the ground-measured &#x0201c;point&#x0201d; data such as records collected at the meteorological and hydrological stations. This may be one of the causes for the uncertainties in the studies about the climate changes and hydrological processes in the SAYR where topography is very complicated and climate is simultaneously controlled by different circulation systems. The station-based &#x0201c;point&#x0201d; data can not provide the exact spatial description of the studied area, which leads to the lack of the full understanding of the spatial patterns of the hydrological processes and variables in the region.
In this paper, the authors focus on the SAYR and try to find its latest characteristics of the variations in the regional climate and runoff and aim to predict the possible trend of the future flow by using not only the traditional station-measured hydrometeorological data but also the spatial grid data such as the multisource-merged ITPCAS atmosphere forcing precipitation data and satellite-based TRMM precipitation data. The authors also try to investigate the future climate change trend and its impacts on water resources over the SAYR by using the CMIP5 projection of future climate in the region. This work is expected to help to understand the hydrologic mechanisms and improve the existing water resources managements in the SAYR under the auspices of the Key Deployment Project of the Chinese Academy of Sciences (Grant No.Y322G73001).

2 Study area and data processing

2.1 Study area

The Yellow River (Huanghe in Chinese) is the second largest river in China (Figure 1). The Yellow River Watershed directly supports a population of 107 million people (McVicar et al., 2007) and 13% of the total cultivated areas in China (Cai and Rosegrant, 2004). The source area of the Yellow River (SAYR), the catchment above the Tangnag Hydrological Station, on the northeastern Qinghai-Tibet Plateau (QTP), contributes approximately 34.5% of the multi-year average of the total annual runoff, in disproportion to its 16.2% areal extent, of the Yellow River Watershed during the past 50 years (Lan et al., 2010). Therefore, the SAYR is often called the water tower of the Yellow River.
The SAYR covers an area of 121,972 km2 and yields an annual average runoff of 617.5 m3/s (an equivalent runoff depth of about 159.7 mm/a) during 1961-2012. The elevation in the SAYR varies from the southwest (above 6200 m a. s. l.) to the northeast (below 2500 m a. s. l.). The main landscapes in the SAYR are alpine meadows and steppes. There are thousands of lakes in the region, among which the two largest are Eling (Ng&#x000f6;ring, 610 km2 in water surface area) and Zhaling (Gyaring, 550 km2). There are also modern glaciers and permafrost. Unlike the middle and down-streams of the Yellow River Basin (below the Tangnag Hydrological Station), the SAYR is subject to minor human activities since there are no large reservoirs and irrigation projects. The climate in the southern and southeastern SAYR is cold and semi-humid, but that in the northern and western SAYR is cold and arid to semi-arid. The mean annual air temperature (MAAT) varies between -4 and +2&#x000b0;C from the northwest to the southeast. The mean annual precipitation is approximately 530 mm, of which more than 75% falls in the warm-wet season from May to September. The annual runoff in the SAYR, as recorded at the Tangnag Hydrological Station has large seasonal fluctuations with two peaks in July and September and a trough in February. The runoff from June to October contributes about 71.7% of the total annual runoff.
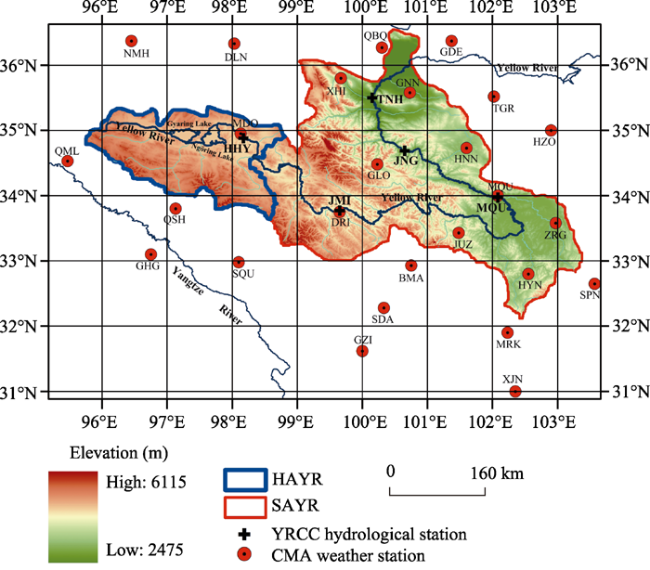
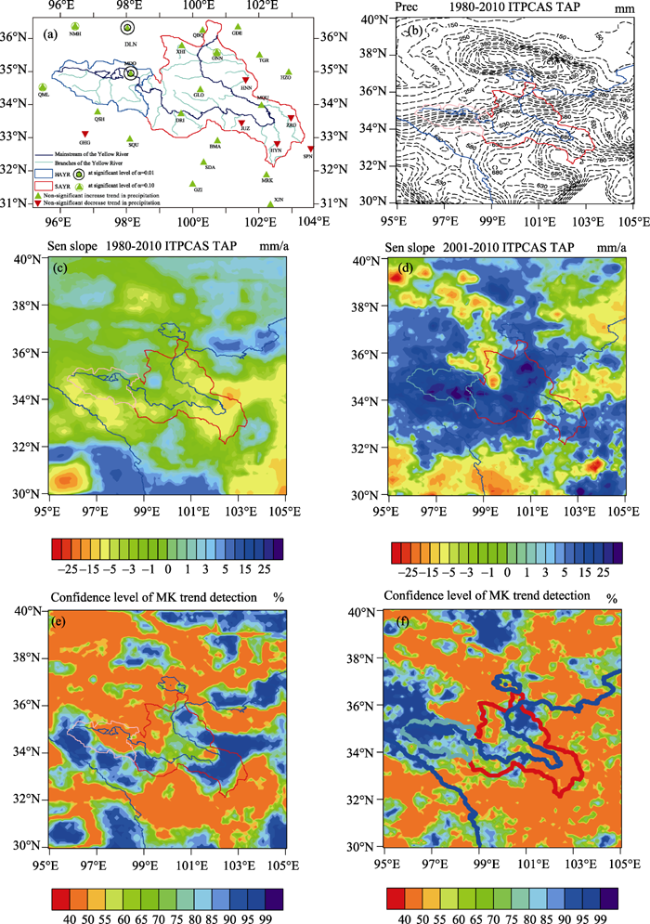
Figure 1 26 weather stations operated by China Meteorological Administration (CMA) and 5 hydrological stations operated by Yellow River Conservancy Commission (YRCC) in the source area of the Yellow River (SAYR) and the headwaters area of the Yellow River (HAYR)

2.2 Data sources

The data used in the paper include station data and spatial data such as ITPCAS and TRMM data as well as CMIP5 projection data. Both ITPCAS and TRMM data can provide the detailed spatial characteristics of regional precipitation in the historical period. CMIP5 projection data are used to predict the future climate and runoff changes.
Station data
The 1961-2012 meteorological data used in the paper are the total annual precipitation (TAP) and mean annual air temperature (MAAT) from 26 weather stations (10 in the SAYR and 16 in its surrounding areas, shown in Figure 1 and Table 1) controlled by the China Meteorological Administration (CMA). In addition, for lacking the actual evapotranspiration data over the SAYR, the potential evapotranspiration (PET) based on the Penman method (Penman, 1948, 1963) and Hargreaves method (Hargreaves and Samani, 1985) are derived from the CMA weather-station daily data to obtain monthly and annual total PET in order to replace the actual evapotranspiration in runoff change analysis. The wind, air temperature, relative humidity, air pressure and sunshine data from the 26 stations are used to calculate Penman-PET and only the maximum and minimum and mean air temperature are used to compute Hargreaves-PET.
Table 1 China Meteorological Administration (CMA) weather stations located in SAYR and its bordering areas
Name and location of station Mean annual values
Elevation
(m a.s.l.)
Name Abbreviation Lat.
(&#x000b0;N)
Long.
(&#x000b0;E)
Precip.
(mm)
Air temp.
(&#x000b0;C)
2791
3192
2836
2238
3324
3202
3145
4176
3682
4273
4418
4201
3720
3969
3501
3630
3473
3441
2911
3394
3530
3896
2666
3493
2369
2852
Nuomuhong
Dulan
Qiabuqia
Guide
Xinghai
Guinan
Tongren
Qumalai (Qumal&#x000e9;b)
Yushu (Ghegu)
Maduo (Madoi)
Qingshuihe
Shiqu
Guoluo
Dari
Henan
Jiuzhi
Maqu
Ruoergai (Zo&#x000ee;g&#x000e9;)
Hezuo
Ganzi
Banma
Seda
Maerkang
Hongyuan
Xiaojin
Songpan
NMH
DLN
QBQ
GDE
XHI&#x0002A;
GNN&#x0002A;
TGR
QML
GHG
MDO&#x0002A;
QSH
SQU
GLO&#x0002A;
DRI&#x0002A;
HNN&#x0002A;
JUZ&#x0002A;
MQU&#x0002A;
ZRG&#x0002A;
HZO
GZI
BMA
SDA
MRK
HYN&#x0002A;
XJN
SPN
36.37
36.33
36.27
36.37
35.80
35.58
35.52
34.53
33.10
34.95
33.80
32.98
34.48
33.75
34.73
33.43
34.00
33.58
35.00
31.62
32.93
32.28
31.90
32.80
31.00
32.65
96.45
98.03
100.30
101.37
99.67
100.73
102.02
95.47
96.75
98.13
97.13
98.10
100.23
99.65
101.60
101.48
102.08
102.97
102.90
100.00
100.75
100.33
102.23
102.55
102.35
103.57
46.7
203.8
319.1
255.7
366.9
415.8
414.5
418.0
486.7
321.7
516.5
569.6
515.8
553.8
587.4
746.4
603.7
652.6
542.2
643.3
661.0
662.3
778.6
750.2
616.0
717.1
5.0
3.4
4.2
7.5
1.4
2.4
5.9
-2.0
3.4
-3.6
-4.5
-0.6
-0.2
-0.7
-0.2
0.8
1.7
1.2
4.1
6.3
4.2
0.7
9.0
1.6
12.1
6.4

Note: The data period in the table is 1961-2012. &#x0002A; The weather stations which are located within SAYR.

The hydrological data are provided by 5 hydrologic stations (Huangheyan, Jimai, Maqu, Jungong and Tangnag, hereafter referred to as &#x0201c;HHY&#x0201d;, &#x0201c;JMI&#x0201d;, &#x0201c;MQU&#x0201d;, &#x0201c;JNG&#x0201d; and &#x0201c;TNH&#x0201d;, shown in Figure 1) controlled by the Yellow River Conservancy Commission (YRCC). The 1920-2012 annual runoff data recorded at TNH and the 1981-2012 monthly runoff data recorded at above-mentioned five stations are really used in the paper.
The arithmetic average method is used to derive two regional mean series (hereafter referred to as the 10-station series and the 26-station series) for TAP, MAAT and PET, respectively. The 10-station series is to represent an average of the SAYR and the 26-station series is to represent an average of the SAYR and its surrounding areas.
ITPCAS precipitation data
The 1980-2010 ITPCAS atmosphere forcing precipitation data are provided by the Hydrometeorological Research Group at the Institute of Tibetan Plateau Research, Chinese Academy of Sciences (He, 2010). Three precipitation data sets are merged into the dataset, including the Tropical Rainfall Measuring Mission (TRMM) 3B42 precipitation products, precipitation observations from 740 CMA weather stations, and the Asian Precipitation - High Resolution Observational Data Integration Toward Evaluation of the Water Resources (APHRODITE) precipitation data (Chen et al., 2011). The spatial and temporal resolutions of the data are 3 hours and 0.25&#x000b0;&#x000D7;0.25&#x000b0;, respectively. To compare with the above-mentioned 10-station and 26-station TAP series, two 1980-2010 regional average series for the SAYR and HAYR are respectively derived from the ITPCAS data. The validation shows that the ITPCAS annual precipitation data has a good agreement with the weather-station data in the SAYR, with a mean correlation coefficient of 0.875 and a mean root-mean-square error (RMSE) of 52.4 mm.
TRMM precipitation data
The 1998-2012 Tropical Rainfall Measuring Mission (TRMM) 3B43 data are the satellite-based and spatially-gridded monthly precipitation products at 0.25&#x000D7;0.25&#x000b0; spatial resolution within the spatial coverage 50&#x000b0;N to 50&#x000b0;S. In the paper the TRMM 3B43V7 monthly precipitation data are used (Huffman et al., 2013). For more details of the product, please see ftp://meso-a.gsfc.nasa.gov/pub/trmmdocs/3B42_3B43_doc.pdf. Similarly, to compare with the above-mentioned 10-station and 26-station TAP series, two 1998-2012 regional average series for the SAYR and HAYR are respectively derived from the TRMM 3B43 data. The validation shows that the TRMM annual precipitation data agrees well with the weather-station data in the SAYR, with a mean correlation coefficient of 0.957 and a mean RMSE of 47.9 mm.
CMIP5 climate projection data
The program for climate model diagnosis and Intercomparison (PCMDI) and the world climate research programme&#x02019;s (WCRP&#x02019;s) the Fifth Phase of the Coupled Model Intercomparison Project (CMIP5) has provided many global climate models&#x02019; (GCMs&#x02019;) output for supporting the fifth assessment report (AR5) of the Intergovernmental Panel on Climate Change (IPCC). In this paper, the arithmetic averages of 21 CMIP5 GCMs&#x02019; historical data (1961-2005) and projection (2006-2100) of mean, maximum and minimum monthly air temperature and precipitation in the SAYR are provided by National Climate Center of China (NCCC). These data are provided under the low, moderate and high greenhouse gas emission scenarios, i.e. the Representative Concentration Pathways-RCP2.6, RCP4.5 and RCP8.5, respectively.
In this paper, the projection data of CMIP5 are corrected by using the base period (1960-1990) CMA weather-station data in the SAYR following the Hay&#x02019;s Delta method (Hay et al., 2000). The areal averages of TAP and MAAT, MaxAAT and MinAAT from the corrected CMPI5 data in the period 2006-2100 are shown in Figure 2.
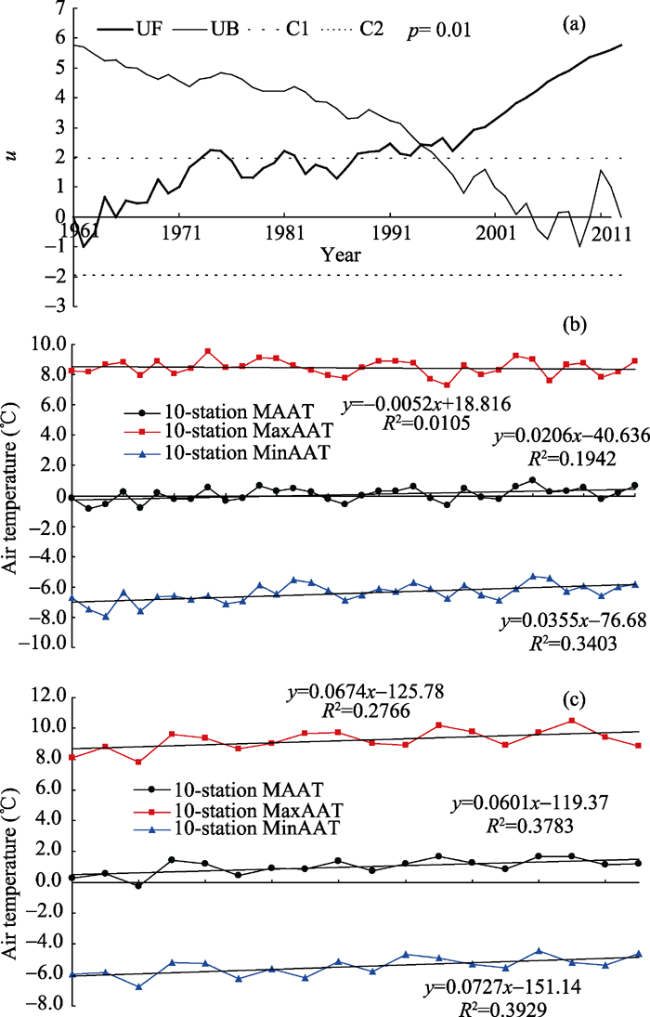
Figure 2 MK abrupt change detection of the 1961-2012 mean annual air temperature (MAAT) in the SAYR (a). C1 and C2 are confidence lines at confidence level of p = 0.05. UF and UB are forward and backward time series of the dimensionless variable u of MK abrupt change detection, respectively. Time series of MAAT, maximum annual air temperature (MaxAAT) and minimum annual air temperature (MinAAT) in the SAYR in the period 1961-1994 (b). As Figure 2b shows, but in the period 1995-2012 (c)

2.3 Method for detection of climate change

Cumulative anomaly approach
Cumulative anomaly (CA) approach is used to directly judge the long-term trends of time series data without any particular hypothesis. For the term xi in time series data at time i, CAi is computed as
where 
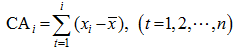
, n is sample size of data time series. When CA curve goes upward along with time, it means the positive anomaly is increasing; on the contrary, it means the negative anomaly is increasing.
Mann-Kendall trend test
The time series of the total annual precipitation, mean annual air temperature and runoff data are analyzed by using the Mann-Kendall (MK) nonparametric trend analysis and abrupt test approach (Mann, 1945; Kendall, 1970). The MK trend test can be used to detect long-term trends of data time series without any particular distribution hypothesis. The standardized test statistic Z for MK trend test follows the standard normal distribution with mean of zero and variance of one. In the MK test, the null hypothesis H0 states that data time series is a sample of n independent and identically distributed random variables with no climate change. The alternative hypothesis H1 of a two-side test is that the distribution of xk and xj are not identical for all k, j&#x02264;n with k&#x2260;j. The null hypothesis H0 is rejected or Z is statistically significant if or if .Moreover, a positive value of Z indicates an increasing trend while a negative value means a decreasing trend. The null hypothesis H0 i.e. no trend is rejected if
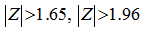
 and at the significant levels of a=0.10, 0.05 and 0.01, respectively.
The magnitude of the slope of trend is estimated using the approach by Sen (1968). The slope is estimated by
where &#x003b2; is the estimate of the slope of trend and xl is the lth observation. The slope determined by equation (2) is a robust estimate of the magnitude of monotonic trend.
Mann-Kendall abrupt change detection
The MK abrupt change detection can be used to detect the precipitation shifts at climate scales (Mohammad and Sayemuzzaman, 2014) and obtain the specific abrupt times. This test considers only the relative values of all terms in the time series under analysis. The normalized MK rank statistic u is distributed as a standard normal distribution. The null hypothesis i.e. no trend will be rejected at a confidence level of &#x003b1; if . A typical confidence level of 95% is used in the paper.
Moving t-test approach
The moving t-test (MTT) approach is used to test the difference between two sub-series before and after the climate jump (shift) point with equivalent sample size (persistence time scale or duration) n = n1 = n2. For a sample which is uncorrelated and normally distributed with mean &#x003bc;, standard deviation and sample size n, the t-statistic is estimated following Maidment (1993) as
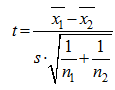
where x1 and x2 are two sub-series, n1 and n2 are the sizes of the sub-series and , and 
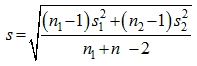
, are the estimated means and variances of two sub-series. The null hypothesis Ho of &#x003bc;1 = &#x003bc;2 is rejected if t &#x0003E; where is the 1-&#x003b1;/2 quantile of the Student&#x02019;s t distribution with degrees of freedom of v = n - 2 at the significant level of &#x003b1;. Modifications of the test are available when the variances in each group are different and when the data exhibit some significant serial correlation.
Timing of the center of mass of the annual runoff
The timing of the center of mass of the annual runoff (CT) representing the mid-point of runoff during a 1-year period was calculated following the method of Stewart et al. (2005) as
where ti is time in months from the beginning of the hydrological year, and qi is the corresponding runoff for month i.
Prediction of the future runoff changes
Firstly, the periodic mean superposition approach is used to simulate and assess the changes of river runoff in the SAYR in the coming decades. Its fundamental principle is that the hydrological time series is separated into several periodic waves which will keep invariant in the coming decades, and the prediction results are derived by extrapolating the known periodic waves and linear superposition (Zhu, 1981).
Secondly, the future river runoff changes in the SAYR are forecasted by using CMIP5 data. Runoff and evapotranspiration are in a competing relationship in the distribution of precipitation. Considering the conclusion of the previous studies (Zhang et al., 2004; Li et al., 2012) that the river runoff is influenced simultaneously by precipitation, air temperature and PET in the SAYR, the future runoff can be estimated by using two statistic regression models as follows
where P is TAP, PET is the annual total Hargreaves-PET, Tmax is the maximum annual air temperature (MaxAAT), and R is the annual runoff depth equivalently converted from the river runoff by the area of the SAYR. The model parameters k, l, a, b, c and d can be obtained by regression analysis based on the 1961-2012 weather station data and CMIP5 data.

3 Results

3.1 Changes in air temperature

Figure 2a displays the MK abrupt change detection of the 10-station MAAT series from 1961 to 2012. The detected abrupt change time is 1994. Additionally, both the abrupt change times of MAAT series detected by MTT method (with a sub-series length of 10 years) and CA method are 1997. Different detection methods have their own merits and limitations and may give slightly different results, and these methods should be applied according to the appropriate assumptions and applicable conditions.
According to the result of MK abrupt change detection, the 10-station series of MAAT, maximum annual air temperature (MaxAAT) and minimum annual air temperature (MinAAT) in 1961-1994 and 1995-2012 are shown in Figures 2b and 2c, respectively. The linear regression slopes shown in Figures 2b and 2c are slightly different from the Sen slopes estimated by equation 2. For the 1961-1994 and 1995- 2012 MAAT (MaxAAT/MinAAT) series, the estimated Sen slopes are 0.021 (-0.003/ 0.033)&#x000b0;C/a and 0.056 (0.070/ 0.072)&#x000b0;C/a, respectively. The standardized test statistic Z of MK trend detection are 2.40 (-0.148/3.291) and 2.045 (1.970/2.500), respectively. Therefore, both of the MAAT series in the periods before and after the abrupt change have significantly (at 95% confidence level) shown an increasing trend. However, the Sen slope for MAAT series after the abrupt change is more than double the one for MAAT series before the abrupt change. The results also show that both the MaxAAT series in the periods before and after the abrupt change have presented a non-significant decreasing trend and a significant (at 95% confidence level) increasing trend, respectively; both the MinAAT series before and after 1994 have presented a significant (at 99% confidence level) increasing trend and a significant (at 95% confidence level) increasing trend, respectively. Just like MAAT series, MinAAT series&#x02019; Sen slope after 1994 is more than twice that before 1994. These results can reconfirm the climate warming in the SAYR reported by previous studies (Zhao et al., 2007, 2008). It is clear that the warming in the SAYR has accelerated since the mid- and late 1990s because of the higher rate of increase (here means linear slope) of air temperature.

3.2 Changes in precipitation

3.2.1 Spatial changes of precipitation
The MK-trends of the 1961-2012 TAP series at 26 CMA stations are detected to determine the spatial changes of precipitation in the SAYR. It is seen from Figure 3a that most of the stations (i.e. 20 out of 26) have exhibited an increasing trend in the last 52 years. Five CMA stations having a significant increasing trend are NMH, DLN, GNN, QML and MDO. They are located in the west or north parts of the SAYR, where climate is arid or semi-arid (Figure 3b). All the 52-year average values of TAP for the five stations (i.e. 46.7 mm, 203.8 mm, 415.8 mm, 418.0 mm and 321.7 mm) are below the ones for 26-station and 10-station TAP series (i.e. 550.7 mm and 513.2 mm). Meanwhile, six stations have generally exhibited a non-significant decreasing trend. They are GHG, HNN, JUZ, ZRG, HYN and SPN. They are located in the south or east parts of the SAYR, where climate is semi-humid (Figure 3b). Their 52-year average values of TAP are 486.7 mm, 587.4 mm, 746.4 mm, 652.6 mm, 750.2 mm and 717.1 mm, respectively. All the values except that of GHG are above those of 26-station and 10-station TAP series.
However, the results of MK trend detection show that since the early 2000s, the precipitation variations at 26 CMA stations have differed markedly in trend. The 2001-2012 TAP series of GHG, HNN, JUZ, ZRG, HYN and SPN have presented an increasing trend, though the Z statistic values of MK trend detection are at 85% confidence level only at HNN and HYN. The stations having a significant variation trend in precipitation (i.e. at more than 90% confidence level) have become from five to six after the recent precipitation abrupt change, they are GNN, QML, MDO, QSH, GLO and BMA. The stations having a decreasing trend in precipitation since the early 2000s are only QBQ and XJN, with the Z statistic values of MK trend detection of -0.343 and -0.617, respectively.
Furthermore, it is seen from Figures 3c and 3d that the precipitation variations are very different at the various geographic positions of the SAYR and its surroundings. On the whole, the spatial distribution of estimated Sen slope and confidence level corresponding with the standardized test statistic Z of MK trend detection for the spatially gridded ITPCAS-TAP data indicate that the annual precipitation had the significant (at high confidence level) decreasing trends in the northeast and southeast parts of the SAYR in the period 1980-2000; the TAPs in the central and western parts of the SAYR had weak decreasing or increasing trends at the lower confidence level in the same period (Figures 3c and 3e). As for the period 2001-2010, except for the southeast part of the SAYR, the rest regions in the SAYR presented an increasing trend of precipitation at the higher confidence level. Meanwhile, the southeast part of the SAYR presented a weak increasing trend at the lower confidence level (Figures 3d and 3f). It should be noted that the southeast part of the SAYR is the main water-yielding catchments of the SAYR.
3.2.2 Inter-annual changes of precipitation
Figure 4a shows two similar variation trends in the 10-station and 26-station TAP series from 1961 to 2012, with the averages of 550.7 mm and 513.2 mm, respectively. The cumulative anomaly (CA) curves of the two series (Figures 4b and 4c) indicate that TAPs in the SAYR and its peripheries have experienced a long-term fluctuation from the 1960s to 1980s and then a continuous decrease from the late 1980s to 2000; a significant increase has oc curred since the early 2000s. The moving t-test (MTT) at 0.01 significant level is also applied to the 10-station and 26-station TAP series for the detection of climate change (Figures 4d and 4e). CA method and MTT method consistently find that the abrupt change time is 2002. It should be noted that MK method fails to identify the recent abrupt change.
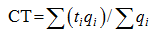
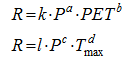
Figure 3 MK trends of the 1961-2012 total annual precipitation (TAP) series of 26 CAM weather stations (a); The 1980-2010 average of TAPs in the SAYR based on the ITPCAS data (b); Spatial distribution of estimated Sen slope (c-d) and spatial distribution of confidence level corresponding with the standardized test statistic Z of MK-Trend detection for the ITPCAS TAP in the SAYR (e-f) and its surrounding areas in the periods of1980-2000 (c, e) and 2001-2010 (d, f)
Based on above-mentioned detected abrupt change time, the averages for the period before the abrupt (PBA) and the period after the abrupt change (PAA) are computed for 10- station and 26-station TAP series, respectively. For the 10-station (26-station) series, the difference in average between PBA and PAA is 38.3 mm (35.6 mm), jumping from 543.3 (506.6 mm) mm to 581.6 mm (542.2 mm), and the averages in PBA and PAA are 7.4 mm (6.6 mm) below and 30.9 mm (29.0 mm) above its 52-year average, respectively. Figure 4a shows the contrary variation trends in PBA and PAA the 10-station TAP series having, with the linear regression slopes of -10.8 mm/decade and 42.4 mm/decade, respectively. Figure 4a also shows the similar trend variation for the 26-station series, with the smaller linear regression slopes of -4.4 mm/decade and 40.2 mm/decade, respectively. On the other hand, based on the MK trend detection, the values of standardized test statistic Z in PBA and PAA for the 10-station (26-station) TAP series are -1.300 (-0.650) and 1.713 (1.401), respectively. The corresponding Sen slope for the 10-station (26-station) series in PBA and PAA are -12.49 mm/decade (-2.68 mm/decade) and 113.93 mm/decade (90.58 mm/decade), respectively.
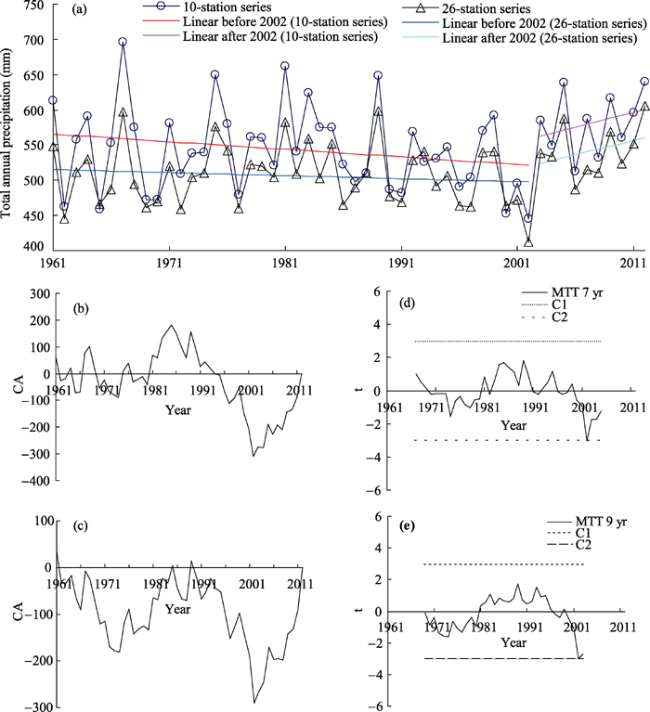
Figure 4 The 10-station mean and 26-station mean annual precipitation time series (a), the cumulative anomaly (CA) of the 10-station mean annual precipitation series (b), the CA of the 26-station mean annual precipitation series (c), MTT change detection for the 10-station precipitation series (d), and MTT change detection for the 26-station precipitation series (e). C1 and C2 in (d) and (e) are confidence lines at the significant level of 0.01.
Additionally, it should be noted that in the recent decade the maximum for the 52-year (1961-2012) annual precipitation series occurred at 7 out of 26 weather stations. Likewise, the second maximum for the 52-year precipitation records also occurred at 7 (slightly different) out of 26 stations in the decade.
The above-mentioned analyses of station precipitation data prove that the TAPs in the SAYR have experienced a significant change since the early 2000s.
Figure 5 shows that the TRMM- based 1998-2012 TAP series for the SAYR and the HAYR have generally presented an increasing trend since the early 2000s. The two series have the linear slopes of 66.8 mm/decade and 78.7 mm/decade for the period 1998-2012 and 69.8 mm/decade and 131.7 mm/decade for the recent decade, respectively. In addition, based on the MK trend detection, the Z statistic values of two TRMM-based TAP series during 2002-2012 are 2.803 and 2.491, respectively. The corresponding Sen slopes are 97.70 mm/decade and 135.27 mm/decade, respectively.
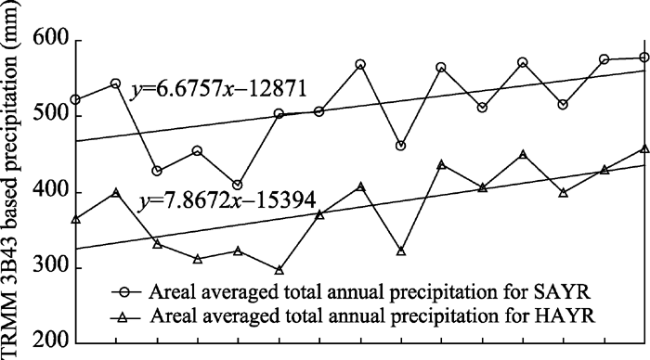
Figure 5 TRMM 3B43 based areal averaged annual precipitation series in SAYR and HAYR during 1998-2012
Therefore, the analyses on TRMM precipitation data support the appearance of the wetting in the SAYR since the early 2000s.
Based on the ITPCAS data, both of the areal average TAP series for the SAYR and the HAYR have shown the contrary variation trends in two periods of 1980-2000 and 2001-2010. According to MK trend detection, the Z statistic values for the ITPCAS-SAYR (ITPCAS-HAYR) TAP series in the two period are -1.849 (-0.815) and 0.730 (1.968), respectively. The estimated Sen slopes are -28.48 mm/decade (-11.15 mm/decade) and 133.52 mm/decade (259.00 mm/decade), respectively. These results show the significant (at 90% confidence level) decreasing trend in the period before 2000 and the non-significant increasing trend since 2001 for the TAPs in the SAYR. They also show the non-significant decreasing trend in the period before 2000 and the significant (at 95% confidence level) increasing trend since 2001 for the TAPs in the HAYR.
Two CA curves for the ITPCAS-SAYR and ITPCAS-HAYR TAP series consistently recognize an abrupt change in the early 2000s (Figures 6c and 6d). The MK tests identify (Figures 6a and 6b) the little later abrupt change times for the ITPCAS-SAYR and ITPCAS-HAYR series, i.e. 2005 and 2004. Additionally, the MTT tests (Figures 6e and 6f) also recognize 2002 and 2003 as the abrupt change times for the SAYR and HAYR series.
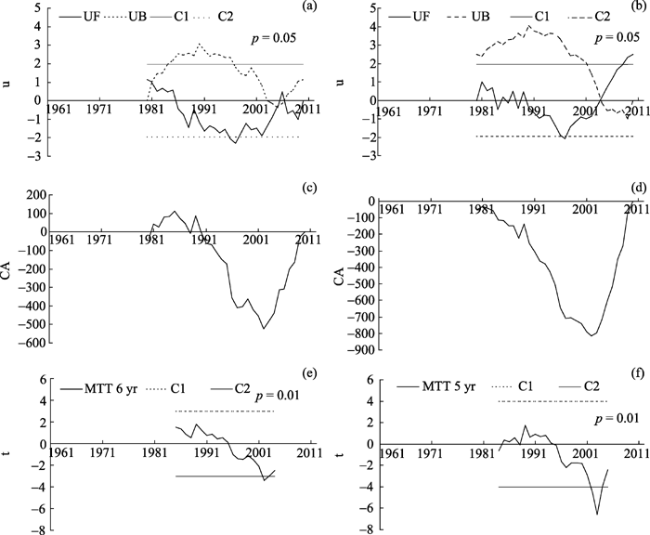
Figure 6 Abrupt change detection for the 1980-2010 ITPCAS-based TAP series in the SAYR (left) and the HAYR (right) by MK approach (a-b), CA approach (c-d) and MTT approach (e-f)
In summary, according to the aforementioned analyses on the air temperature and precipitation, it can be concluded that an obvious warm-wet trend in the SAYR has occurred since the early 2000s, in spite of the little different abrupt change times given by different change detection methods; meanwhile, according to calculation, the linear slope of the 10-station TAP series since the early 2000s is 42.4 mm/decade, while the slope for the MDO TAP series in the same period is 89.1 mm/decade. MDO is the only CMA weather station in the HAYR (Figure 1) and its data can reflect the basic trend in precipitation variation in the northwest part of SAYR. As for two TRMM-based TAP series, they also present the differences in linear or Sen slopes and significant levels of precipitation variation between the SAYR and the HAYR. Furthermore, the linear regression slopes of the ITPCAS-SAYR and ITPCAS-HAYR TAP series for the period 2002-2010 are 24.0 mm/decade and 111.7 mm/decade, respectively. All these facts prove that the recent warm-wet trend appears to be stronger in the HAYR than in the whole SAYR.
3.2.3 Seasonal variations of precipitation
Furthermore, the variations in seasonal precipitation over the SAYR are explored by using the 10-station average monthly precipitation series from 1961 to 2012. The abrupt change points detected by different test approaches (CA, MK and MTT) are different. Based on a synthesis of all these results, the trends in seasonal precipitation change are obtained (Table 2). For the precipitation series in December, no significant or persistent trend can be recognized because of the frequent oscillations around its long-term average since 1987. Therefore, no trend for December is listed in Table 2. Seasonally, before the recent precipitation abrupt change, except for non-significant increasing trend in November, all other months (from January to October) have exhibited their decreasing trends in monthly precipitation series; after the recent abrupt change, except for the decreasing trends in May, September and October, all other months have presented the increasing trends. From January to April, the averages of monthly precipitation for the PAA are less than the ones for the PBA. However, from May to November, the averages of monthly precipitation for PAA are greater than those for PBA. Therefore, based on the differences in the averages of monthly precipitation between PAA and PBA, it can be concluded that the recent precipitation increase over the SAYR should occur mainly in summer and autumn.
Table 2 Climate trends in the seasonal precipitation variability based on the 10-station monthly precipitation series for 1961-2012
Month Abrupt
point
PBA PAA Average
for PBA
(mm)
Average
for PAA
(mm)
Average
of 1961-
2012 (mm)
Line slope
for PBA
(mm/yr)
Line slope
for PAA
(mm/yr)
CC for
PBA
CC for
PAA
Jan 2000 1993-2000 2001-2012 5.4 4.7 4.0 -1.319 0.209 0.918 0.457
Feb 2002 1989-2002 2003-2012 7.1 6.4 5.7 -0.455 0.103 0.755 0.108
Mar 2002 1993-2002 2003-2012 15.0 13.3 12.8 -0.960 0.330 0.592 0.195
Apr 2002 1994-2002 2003-2012 27.7 24.9 25.8 -1.880 0.343 0.563 0.168
May 2000 1985-2000 2001-2012 66.4 70.6 66.3 -0.857 -1.188 0.319 0.262
Jun 2001 1987-2001 2002-2012 96.8 101.5 95.8 -2.516 1.358 0.419 0.256
Jul 2000 1989-2000 2001-2012 109.6 116.5 112.0 -1.210 5.228 0.220 0.752
Aug 2002 1981-2002 2003-2012 87.4 104.8 96.8 -0.444 0.093 0.135 0.165
Sep 2000 1984-2000 2001-2012 73.3 85.0 85.6 -1.526 -0.346 0.440 0.126
Oct 2002 1988-2002 2003-2012 38.9 41.4 38.0 -1.094 -1.344 0.328 0.454
Nov 2003 1989-2003 2004-2012 4.9 6.5 5.6 0.004 0.391 0.000 0.281

CC is correlation coefficient. PBA is the period before abrupt change point. PAA is the period after abrupt change point.

3.3 Response of river runoff to climate change

Figure 7 shows the annual runoff records at TNH from 1961 to 2012 and the corresponding inter-annual and seasonal climate change detections. From the 10-year, 15-year and 20-year moving averages of annual runoff, a clear increasing trend from the 1960s to the 1980s can be found, then a persistent decreasing trend from the early 1990s to around 2006 can also be recognized. Since 2006, the rising trend occurred again (Figure 7, upper panel). The CA curve for annual runoff at TNH indicates that a steady increasing trend has occurred since 2008 (Figure 7, lower panels, a). The MK test curves for the annual runoff series recognize an abrupt climatic change in 2009.
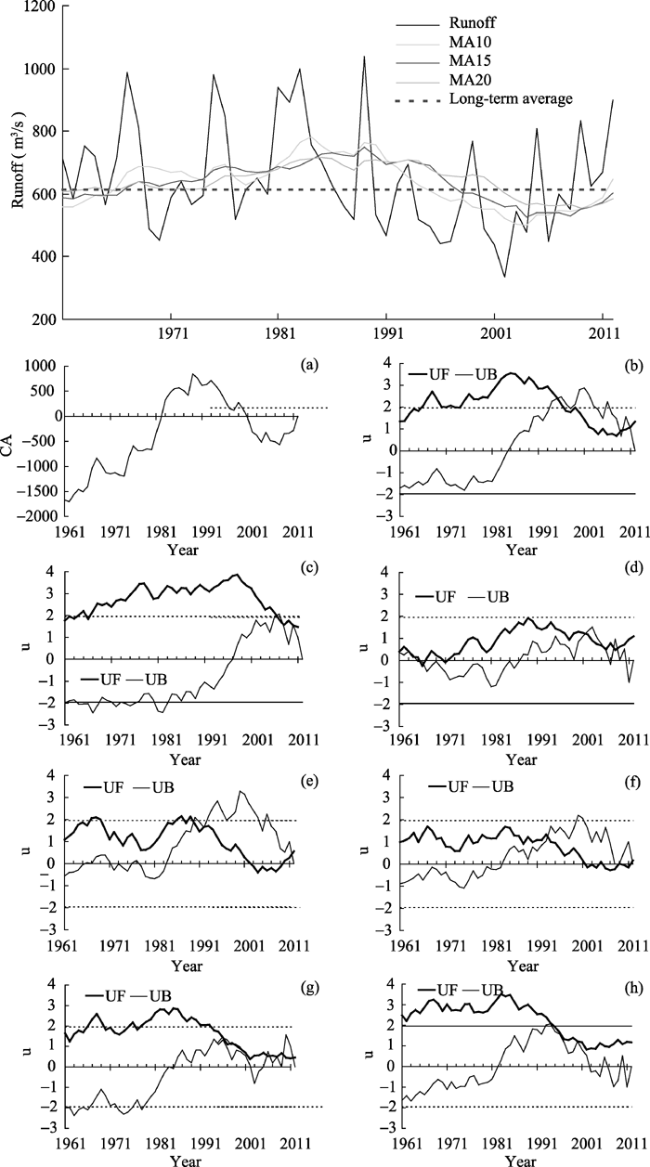
Figure 7 (Upper panel) The 1961-2012 annual runoff series at TNH. MA10 denotes the 10-year moving average, and so on. (Lower panel) abrupt climate change detection for the 1961-2012 annual runoff series at TNH by CA approach (a) and by MK approach (b), and MK abrupt change detection for the monthly runoff series in May (c), June (d), July (e), August (f), September (g) and October (h) at &#x003b1; = 0.05 significant level
Seasonally, the MK test for the monthly runoff series at TNH in May suggests a climate change in 2006. Similarly, the abrupt changes in June, July, August, September can be recognized in 2002, 2011, 2009, 2006, respectively (Figure 7, lower panels). For the precipitation in October, no significant climate abrupt change can be detected in the recent period. Different from the MK detection results, the simple statistics for the monthly runoff series at TNH show that in May, most of the monthly runoff have been above their long-term (1961-2012) averages after 2009. However, no such a year can be determined for the runoff in September. The corresponding statistics for each monthly runoff are listed in Table 3.
Table 3 The year for each monthly runoff series at TNH since then the monthly runoff in most years was above the long-term (1961-2012) average
Season Jan Feb Mar Apr May Jun Jul Aug Sep Oct Nov Dec
Year 2006 2009 2006 2008 2009 2007 2005 2009 - 2008 2008 2005
The above-mentioned abrupt change times detected for TNH runoff series are generally later than those for precipitation over the SAYR, which indicates that the runoff variations, i.e. the responses of runoff to climate change may lag behind the precipitation change in the SAYR.
Furthermore, the linear regression analyses between the annual runoff at TNH and the (10-station, 26-station, ITPCAS-based and TRMM-based) TAP series, those between the annual runoff at TNH and the 10-station MAAT series and those between the annual runoff at TNH and the Hargreaves-PET and Penman-PET series in the SAYR are conducted for the period 1961-2012 (figure omitted). All the correlation coefficients except for the one between the annual runoff and MAAT series reach the 99% confidence level. Only the correlation between the annual runoff and MAAT series does not pass the 0.05 significant test. It is found that there are the significant and positive linear correlation between the annual runoff and the TAP (correlation coefficients are 0.826, 0.778, 0.656 and 0.868 for 10-staion, 26-station, ITPCAS-SAYR and TRMM-SAYR TAP series, respectively), the no-significant (no-significant/significant) negative correlation between the annual runoff and the 10-station MAAT (MinAAT/MaxAAT) (correlation coefficient are -0.157, -0.104 and -0.364, respectively), and the significant negative correlation between the annual runoff and the PET in the SAYR (correlation coefficients are -0.556 and -0.562 for 10-station Penman-PET and Hargreaves-PET series, respectively). Therefore, it can be concluded that inter-annual runoffchanges in the region are very sensitive to the changes of precipitation, PET and annual max air temperature and not very sensitive to the inter-annual changes of mean and minimum air temperatures in the region.
Additionally, climate abrupt change detections for the timing of the center of mass of annual runoff (CT) are applied to the 1961-2012 runoff series at HHY, JMI, MQU, JNG and TNH. Various test approaches present slightly different results (Figure 8). Based on a synthesis of these results, the abrupt changes in the CT series are obtained from the YRCC hydrological stations data in the SAYR (Table 4). The CT can directly reflect the time mid-point of the runoff process during a 1-year period and is often considered as the nominal peak of annual runoff from the mass perspective. It is seen from Table 4 that the CT series have exhibited a clear delayed trend (about 0.26 month or 7.7 days) in the recent decade, agreeing well with the aforementioned variation trend in seasonal precipitation, i.e. that monthly precipitation data increased mainly in summer and autumn in the recent period.
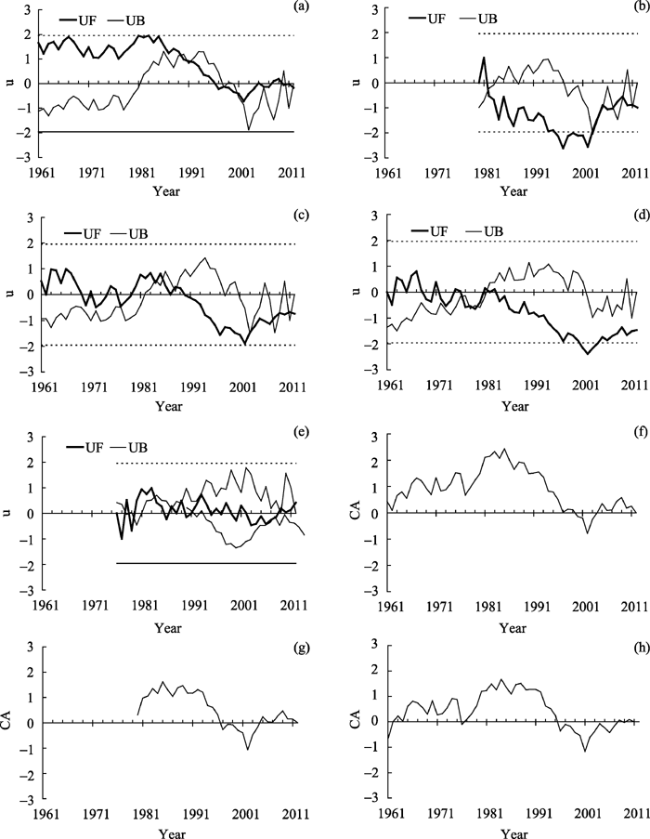
Figure 8 Abrupt climate change detection for CT series by MK approach at TNH (a), JNG (b), MQU (c), JMI (d), HHY (e) and by CA approach at TNH (f), JNG (g) and MQU (h) at &#x003b1;= 0.05 significant level
Table 4 Climatic abrupt changes of CT series in the recent decade at 5 YRCC hydrological stations
YRCC
station
Recent abrupt
point
PBA PAA Average for
PBA (month)
Average for PAA (month)
HHY 2006 1981-2006 2007-2012 7.35 7.73
JMI 2002 1981-2002 2003-2012 7.27 7.46
MQU 2002 1988-2002 2003-2012 7.30 7.57
JNG 2002 1983-2002 2003-2012 7.31 7.52
TNH 2002 1985-2002 2003-2012 7.29 7.53

3.4 Variations and trend prediction of future runoff

According to the aforementioned analyses, a warm-wet climate change in the SAYR has occurred since the early 2000s. On the other hand, many previous studies found that the runoff changes in the region were related closely to the changes of precipitation and evapotranspiration and air temperature in the past several decades (Chang et al., 2007; Lan et al., 2010; Cuo et al., 2013). For the better understanding of climate&#x02019;s impacts on the hydrological processes in the coming decades, it is necessary to investigate the trend in the future climate change in the SAYR, particularly to research whether or not the recent warming and wetting will continue (or disappear) in the coming century.
It is seen from Figure 9 that the warming and wetting in the SAYR will remarkably continue until the 2100s under the high emission scenario (RCP8.5), with the linear slopes of 0.61&#x000b0;C/decade and 12.1 mm/decade for MAAT and TAP, respectively. Under the moderate emission scenario (RCP4.5), the warming and wetting will also last in the next century in the region; somewhat differently, the trend slopes of the MAAT and TAP in the first half of the next century (2006-2055) will be 0.37&#x000b0;C/decade and 9.54 mm/decade, which are obviously more than the ones in the second half of the next century (2056-2100), i.e. 0.10&#x000b0;C/decade and 4.63 mm/decade. However, under the low emission scenario (RCP2.6), the variation trends of future climate will be very different from the ones under the high and moderate emission scenario. The warming and wetting will continue only in the period 2006-2049, with the trend slopes of 0.25&#x000b0;C/decade and 9.22 mm/decade, respectively. After then, a cold and arid climate will appear again in the region in the second half of the next century, with the trend slopes of -0.07&#x000b0;C/decade and -0.33 mm/decade for MAAT and TAP, respectively.
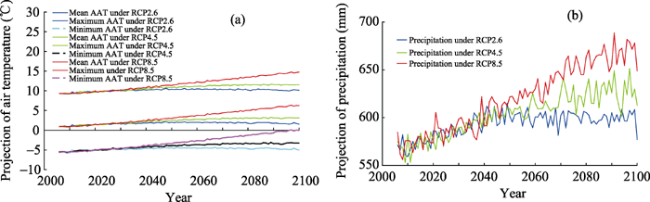
Figure 9 The projection of mean, maximum, minimum annual air temperature (AAT) (a), annual precipitation (b) over the SAYR in the period 2006-2100 derived from the NCCC-provided CMIP5 data over China. The correction for the original data is based on the Delta method (Hay et al., 2000) by using the reference period (1961-1990) CMA weather-station data over the SAYR.
Under the recent warming and wetting background, how long will the high-flow status of river runoff in the SAYR continue? Based on the prediction of the periodic mean superposition approach, it is seen (Figure 10) that the average runoffs during 2013-2022, 2023- 2032, 2033-2042, 2043-2052, and 2053-2062 will be 687, 657, 581, 594, and 662 m3/s, respectively. These equal 110%, 105%, 93%, 95% and 105% of the historical (1920-2012) average of the annual runoff, respectively. The average annual runoff during 2013-2062 in the SAYR will be more than that during 1920-2012. On the whole, the runoff before the 2030s will be at the high-flow status compared to the historical average of the runoff in the SAYR. However, the runoff after the 2030s will be at the low-flow status.
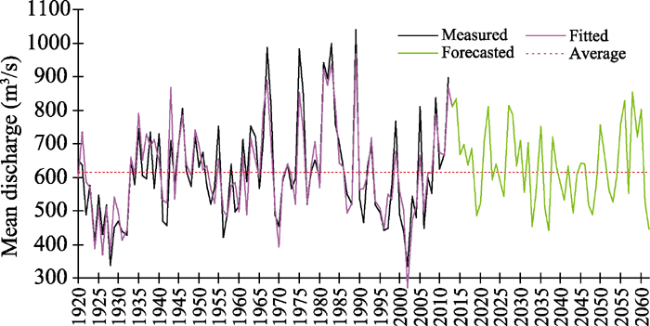
Figure 10 Observed, simulated, and forecasted and average annual runoff rates in the SAYR during 1920-2060
Considering the competing relationship between the runoff and evapotranspiration in the distribution of precipitation at the annual scale over the SAYR, Figure 11 shows the negative correlation between the ratio of annual runoff to TAP (R/P) and that of annual PET to TAP (PET/P) in the period 1961-2012. For comparison purposes, the annual runoff in Figure 11 is converted equivalently to the annual runoff depth by using the area of the SAYR and its unit is mm. Figures 11a and 11b clearly indicate the competition between the runoff and evapotranspiration in the consumption of precipitation. At the same time, Figure 11c demonstrates that the Hargreaves-PET computed only from the air temperature data has a good agreement with the Penman-PET computed from more weather data in the SAYR.
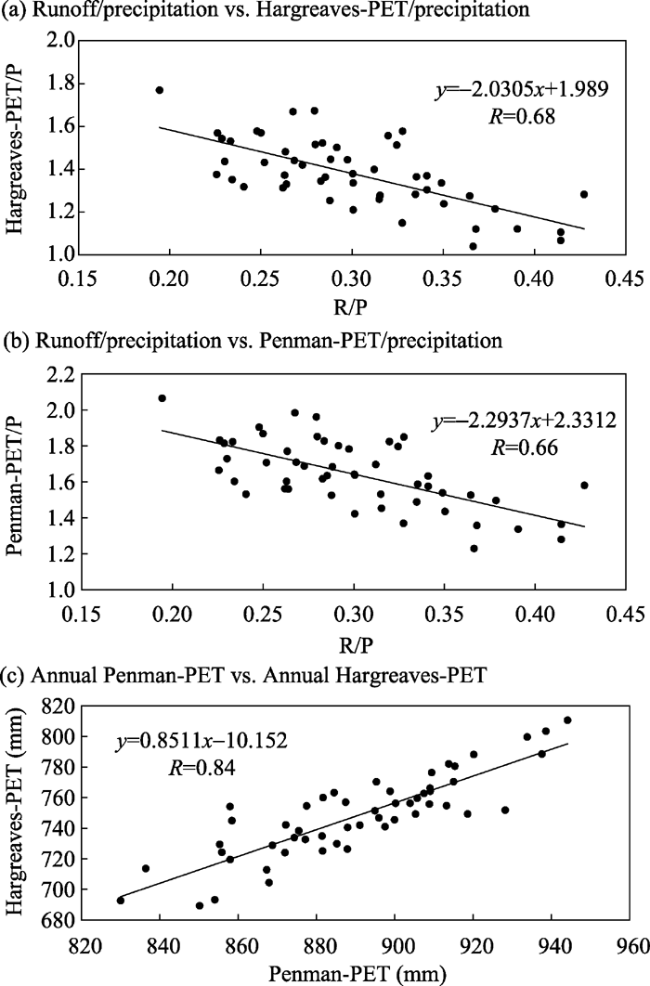
Figure 11 The competing relationship between the runoff and Hargreaves potential evapotranspiration (PET) (a), Penman PET (b) in the distribution of precipitation at the annual scale over the SAYR during the period 1961-2012. For lacking the regional actual evapotranspiration observation over the SAYR, Penman PET and Hargreaves PET series are used to replace the actual evapotranspiration. (c) Linear correlation between the Penman-PET and Hargreaves-PET series during the period 1961-2012 in the SAYR.
Considering that the NCCC- CMIP5 data only consist of air temperature and precipitation data as well as in the historical period (1961-2012) Penman-PET and Hargreaves-PET series have shown a good positive correlation in the SAYR (Figure 11c), the annual Hargreaves-PETs for the future period (2006-2100) are derived from the projection data of the MAAT, MaxAAT and MinAAT and used to analyze the changes of the future runoff in the SAYR (Figure 12). It is seen clearly from Figures 9 and 12 that in the SAYR the projected trends in air temperature, precipitation and Hargreaves-PET are all alike under three different RCP emission scenarios, respectively. All the same, the future runoff predicted by two statistic regression models (Equation 6) still present different variation trends under different future emission scenarios.
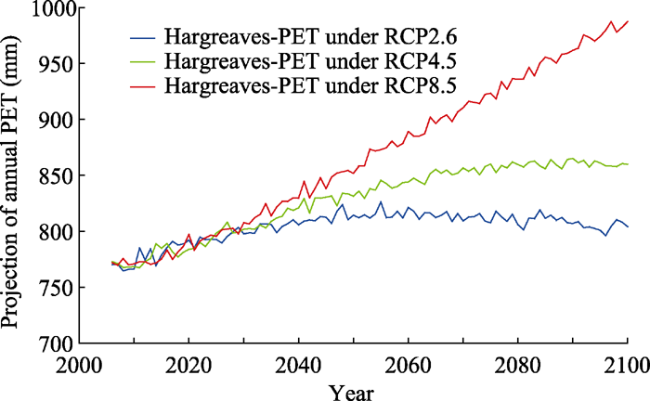
Figure 12 Projection of the 2006-2100 Hargreaves-PET followed by (Hargreaves and Samani, 1985) derived from the NCCC-provided CMIP5 projection of average, maximum and minimum annual air temperature over the SAYR
If considering the different impacts of precipitation and PET on runoff, it is seen from Figure 13a that according to the runoff predictions from precipitation and PET, the runoff level in the recent period (2006-2012) in the SAYR will at least continue until the 2020s under three emission scenarios. After the 2020s, the runoff will continue to decline under the high (i.e. RCP8.5) emission scenario. Similarly, the runoff will decrease under the moderate (RCP4.5) and low (RCP2.6) emission scenarios after the 2020s, and then it will basically keep steady during the period 2040s-2100s. However, if considering the impacts of precipitation and maximum air temperature on runoff, it is seen from Figure 13b that the recent runoff level in the SAYR will continue until the 2030s under three different emission scenarios. After the 2030s, the runoff will continue to decline under the high emission scenario (i.e. RCP8.5). Under the moderate emission scenario (RCP4.5) the runoff will slightly decrease during the 2040s-2070s, then it will experience a larger interannual variability with a long-term (2070s-2100s) average similar to the recent level. Under the low emission scenario (RCP2.6), however, the runoff will experience the abrupt increase after the mid-2030s and then it will have a larger long-term average as well as interannual variability during the period 2040s-2100s compared to the recent runoff level.
In view of the current international commitments from all the major economies on emission reductions and the present state of the consumption of the global fossil fuels, the moderate and high emission scenarios will be more likely than the low emission scenario in the next decades. Therefore, it is estimated that the time scale of the recent warm-wet changes of climate in the SAYR are probably at the century scale, while the recent runoff changes are probably the decadal variability. This means that the warm-humid climate will continue in the coming decades in the SAYR while the runoff increase in the recent period will only continue until the mid-2020s.
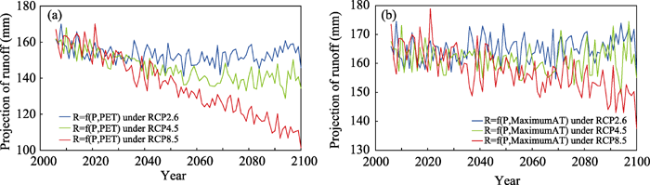
Figure 13 The projection of the runoff depth over the SAYR based on the formula R=k&#x000b7;Pa&#x000b7;PETb (a), and (b) using the NCCC-provided CMIP5 projection of the annual precipitation and Hargreaves-PET in the period 2006-2100

4 Discussion

What are the main causes for the recent climate changes in the SAYR? The inter-annual variations of the monsoon systems influencing the region should be considered now that China is one of the most significant monsoon zones in the world and most parts of China have a pronounced monsoon climate. The main monsoon systems influencing China region are the East Asian monsoon system (EAMS) and the South Asian monsoon system (SAMS). The EAMS can also be divided into the South China Sea monsoon system (SCSMS) and the East Asian Subtropical monsoon system (EASMS). The SAYR lies at the northwest edge of the EAMS and its climate also has a close relationship with the variations in strength and paths of the EAMS (Hu and Qian, 2007).
In this paper, the correlations between the 10-station and 26-station TAP series in the SAYR and several NCCC-provided monsoon indices are analyzed respectively. The used monsoon indices are the South China Sea summer monsoon index (SCSSMI) (He, 1997), the East Asian summer monsoon index (EASMI) defined by Zhang et al. (2003), the normalized East Asian winter monsoon index (EAWMI) defined by <xref ref-type="bibr" rid="b39">Zhu (2008)</xref>, normalized winter intensity index of the Siberia High (SH), the normalized index of ocean-land pressure difference (IWE) defined by <xref ref-type="bibr" rid="b9">Guo (1994)</xref>, the East Asian winter monsoon index (LSWM) defined by <xref ref-type="bibr" rid="b22">Liu (2007)</xref>, Winter Arctic Oscillation Index (WAO) as well as the South Asian monsoon index (SAMI), SAMI1, SAMI2, and the East Asian monsoon index (EAMI) defined by <xref ref-type="bibr" rid="b18">Li and Zeng (2003)</xref>.
The results show that the EAWMI has the highest correlation with the two TAP series, with the correlation coefficients of 0.391 (at 99% confidence level) and 0.365 (at 99% confidence level), respectively; secondly the LSWM has the higher correlation with the two TAP series, with the correlation coefficients being 0.344 (95% confidence level) and 0.351 (95% confidence level), respectively; the correlation coefficients between the SH index and two TAP series are 0.314 (at 95% confidence level) and 0.301 (at 95% confidence level), respectively. Other indices have no significant correlation with the two TAP series.
The above-mentioned 26 CMA stations can be divided into two groups. The North-10-station TAP series represents the average precipitation of NMH, DLN, QBQ, XHI, GDE, GNN, TGR, HZO, MDO and QML. The South-16-station TAP series represents the average precipitation of QSH, GHG, SQU, DRI, GLO, HNN, MQU, JUZ, ZRG, HYN, SPN, BMA, SDA, GZI, MRK and XJN. Then the correlations between the North-10-station (South-16-station) TAP series and the above-mentioned monsoon indices are analyzed respectively. The two group average series have the highest correlation with the LSWM, with the correlation coefficients of 0.273 (95% confidence level) and 0.352 (95% confidence level), respectively. Secondly, they have the higher correlation with EAWMI, with the correlation coefficients being 0.289 (95% confidence level) and 0.348 (95% confidence level), respectively. Next, the correlation coefficients between the two TAP series and the SH index are 0.227 (non-significant) and 0.329 (95% confidence level), respectively. The South-16-station series also has the negative correlation with the SCSSMI, with the correlation coefficients being -0.182 (non-significant); it also has the non-significant correlation with the IWE, with the correlation coefficient being 0.176. At the same time, the North-10-station series has non-significant correlation with the EASMI, with the correlation coefficient being 0.175.
It is seen from Figures 14 and 4a that the weak winter monsoon conditions correspond to the less precipitation in the SAYR; conversely, the strong winter monsoon conditions may mean the more precipitation in the region. Therefore, the main circulation cause for the recent warming and wetting in the SAYR may be the enhanced winter monsoon in the East Asian accompanying with the global warming. This conclusion may be contrary to the previous researches (Li et al., 2012). It is easy to think that the TAP in the region should be influenced directly by the interannual variations of the South China Sea or East Asian summer monsoon systems because of the fact that annual precipitation in the SAYR concentrated in the summer (JJA). However, the correlation analyses show that both of the annual precipitations in the north and the south parts of the SAYR are positively related to the interannual variations of the East Asian winter monsoon; even the TAPs in the south and north parts of the region indistinctively have the negative correlations with the SCSSMI, with the correlation coefficients being -0.182 and -0.045, respectively. In a word, the authors of this paper think that at least at current moment more studies are required to deeply reveal the cause for the climate change in the SAYR.
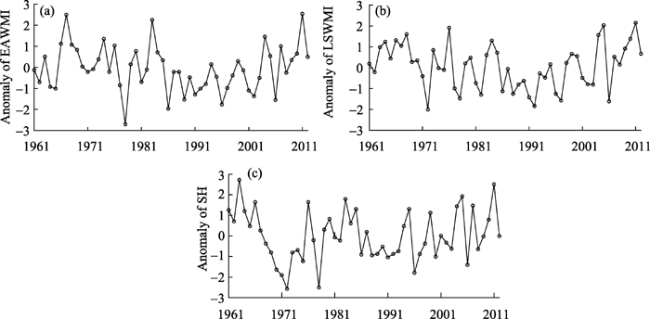
Figure 14 Anomaly series of EAWMI (a), LSWM (b) and SH (c) indexes in the period 1961-2012
On the other hand, which climate factors should be responsible for the recent runoff changes in the region? Li et al. (2004) thought that the precipitation decrease is the direct cause for the flow decrease in the SAYR. Zhang et al. (2004) argued that the rising evaporation is the main cause for the flow decrease in the region. Chang et al. (2007) indicated that the importance of precipitation to the flow is much higher than that of air temperature in the region. Li et al. (2012) stated that precipitation decrease, evapotranspiration increase as well as permafrost degeneration should be collectively responsible for the flow decrease in the region. In this paper, the recent linear trends of the 10-station TAP and PET_PM series and the ratio of runoff to TAP and the one of PET_PM to TAP are analyzed (Figure 15). It is clear that in the recent period the precipitation (PET) in the SAYR has presented a significant (non-significant) increase trend (Figure 15a). Meanwhile, the ratio of runoff to TAP has a significant increase trend and the ratio of PET to TAP has a significant decrease trend (Figure 15b). The results show that although both precipitation and PET have increased concurrently in the recent period, the precipitation increase (the slope is 100.5 mm/decade) was obviously more than the PET increase (the slope is 2.2 mm/decade). Therefore, the recent increase of runoff in the SAYR should be firstly attributed to the precipitation increase. Secondly, the increase of precipitation being more than that of PET in the region has made a significant contribution to the recent high-flow status. It can be concluded that in the recent decade the runoff has won the competition between itself and PET for the distribution of precipitation. As for mean air temperature, its impact on the runoff variation is much less than that of precipitation in the SAYR. According to analysis, the annual runoff series indistinctively had a negative correlation with the 10-station MAAT series in the period 1961-2012, with the correlation coefficient being -0.156. Only in the HAYR where the permafrost is widely distributed and sensitive to the temperature variations, the impact of air temperature variation on the runoff maybe counts for as much as that of precipitation. However, the runoff in the HAYR only makes up a small proportion of the annual runoff in the whole SAYR. In fact, according to the analyses, the negative correlation between the annual runoff at HHY and MAAT at MDO in the period 1961-2012 was very weak, with the correlation coefficient of 0.182, and this value is obviously less than the correlation between the annual runoff at HHY and TAP at MDO in the same period. The latter has a correlation coefficient of 0.478 (at 99% confidence level).
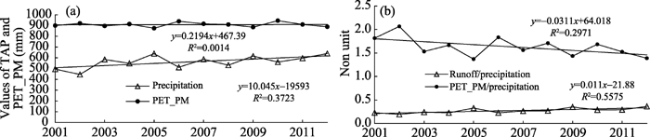
Figure 15 The 10-station TAP and PET_PM series in 2001-2012 (a), and the ratio of annual runoff to TAP and that of PET_PM to TAP in 2001-2012 (b)

5 Conclusions

(1) The climate in the SAYR experienced a significant change toward warming and wetting since the early 2000s. The regional air temperature experienced an abrupt change in 1994. The estimated Sen slope of mean air temperature variation after the abrupt change is more than double the one before the abrupt change. They are 0.56 oC/decade and 0.21 oC/decade, respectively. Meanwhile, the annual precipitation in the region presented the contrary variation trends before and after the early 2000s, with the linear regression slopes of -10.8 mm/decade and 42.4 mm/decade, respectively. The detected warm-wet signal in the northwest part of the SAYR is more obvious than that in the whole SAYR. Meanwhile, the recent precipitation increasing in the SAYR occurred mainly in summer and autumn.
(2) Accompanying the increase of precipitation, the runoff in the region also experienced an increasing process since 2006 and has exceeded its long-term average after the mid- and late 2000s. The historical changes of the runoff in the region are sensitive to the changes of precipitation, PET and max air temperature. However, they are not very sensitive to changes in mean and minimum air temperatures. The timing of the center of mass of annual runoff (CT) in the SAYR exhibited a clear delayed trend (about 0.26 month or 7.7 days) in the recent decade, which agrees well with the variation trend in seasonal precipitation in the region.
(3) Based on the CMIP5 projection data, the warm-wet climate trend in the SAYR will continue until 2049 if synthetically considering three different future greenhouse gas emission scenarios, and the annual precipitation in the SAYR will be not less than its current level before 2100. However, it is estimated that the recent flow increase in the SAYR is likely to be the decadal change and it will at most continue until the 2020s.
(4) The inter-annual variations of the East Asian winter monsoon are found to be closely related to the variations of annual precipitation in the SAYR. The enhanced winter monsoon may be the circulation cause for the annual precipitation increase in the SAYR. The increased precipitation as well as the increase of evaporation being less than that of precipitation in the recent period are the main climate causes for the flow increase in the region.

The authors have declared that no competing interests exist.

1
Abdul Aziz O I, Burn D H, 2006. Trends and variability in the hydrological regime of the Mackenzie River basin.Journal of Hydrology, 319: 282-294.

2
Andreo B, Jime&#x000b4;nez P, Dura&#x000b4;n J Jet al., 2006. Climatic and hydrological variations during the last 117-166 years in the south of the Iberian Peninsula, from spectral and correlation analyses and continuous wavelet analyses.Journal of Hydrology, 324: 24-39.

3
Cai X, Rosegrant M W, 2004. Optional water development strategies for the Yellow River basin: Balancing agricultural and ecological water demands. Water Resources Research, 40, W08S04. doi: 10.1029/ 2003WR002488.

4
Chang G G, Li L, Zhu X Det al., 2007. Changes and influencing factors of surface water resources in the source region of the Yellow River.Acta Geographica Sinica, 62(3): 312-320. (in Chinese)

5
Chen Y, Yang K, He Jet al., 2011. Improving land surface temperature modeling for dry land of China.Journal of Geophysical Research, 116, D20104, doi: 10.1029/2011JD015921.

6
Coulibaly P, 2006. Spatial and temporal variability of Canadian seasonal precipitation (1900-2000).Advances in Water Resources, 29: 1846-1865.

7
Cuo L, Zhang Y X, Gao Y Het al., 2013. The impacts of climate change and land cover/use transition on the hydrology in the upper Yellow River basin, China.Journal of Hydrology, 502: 37-52.

8
DaSilva V P R, 2004. On climate variability in Northeast of Brazil.Journal of Arid Environments, 58:575-596.

9
Guo Q Y, 1994. Relationship between the variations of East Asian winter monsoon and temperature anomalies in China.Journal of Applied Meteorology, 5(2): 218-225. (in Chinese)

10
Hargreaves G H, Samani Z A, 1985. Reference crop evapotranspiration from temperature.Applied Engineering in Agriculture, 1(2): 96-99.

11
Hay L E, Wilby R L, Leavesley G H, 2000. A comparison of delta change and downscaled GCM scenarios for three mountainous basins in the United States.JAWAR Journal of the American Water Resources Association, 36(2): 387-397.

12
He J, 2010. Development of surface meteorological dataset of China with high temporal and spatial resolution [D]. Beijing: Institute of Tibetan Plateau Research, CAS. (in Chinese)

13
He M, 1997. Summer monsoon and Yangtze river basin precipitation (Abstract), Preprint of Abstracts of Papers for the First WNO International Workshop on Monsoon Studies, WNO/TD-No.786.2, 67-67B.

14
Hu H R, Qian W H, 2007. Confirmation of northern edge of the East Asian summer monsoon.Chinese Journal of Progress in Natural Science, 17(1): 57-65. (in Chinese)

15
Huffman G J, Stocker E F, Bolvin D Tet al., 2013. TRMM Version7: 3B42 and 3B43 Data Sets. Greenbelt, MD: NASA/GSFC.

16
Kendall M G, 1970. Rank Correlation Measures. London: Griffin.

17
Lan Y C, Zhao G H, Zhang Y Net al., 2010. Response of runoff in the source region of the Yellow River to climate warming.Quaternary International, 226: 60-65.

18
Li J P and Zeng Q C, 2003. A new monsoon index and the geographical distribution of the global monsoons.Advances in atmospheric sciences, 20(2): 299-302.

19
Li L, Shen H Y, Dai Set al., 2012. Response of runoff to climate change and its future tendency in the source region of Yellow River.Journal of Geographical Sciences, 22(3): 431-440.

20
Li L, Wang Q C, Zhang G Set al., 2004. The influence of climate change on surface water in the upper Yellow River.Acta Geographica Sinica, 59(5): 716-722. (in Chinese)

21
Li L J, Zhang L, Wang Het al., 2007. Assessing the impact of climate variability and human activities on streamflow from the Wuding River basin in China.Hydrological Processes, 21: 3485-3491.

22
Liu S, 2007. A method for determining intensity index of East Asian Winter Monsoon.Scientia Geographica Sinica, 27(Suppl.): 10-18. (in Chinese)

23
Mann H B, 1945. Nonparametric tests against trend.Econometrica, 13, 245-259.

24
McVicar T R, Van Niel T G, Li L Tet al., 2007. Spatially distributing monthly reference evapotranspiration and pan evaporation considering topographic influences.Journal of hydrology, 338: 196-220.

25
Mohammad S, Manoj K J, 2014. Seasonal and annual precipitation time series trend analysis in North Carolina, United States.Atmospheric Research, 137: 183-194.

26
Penman H L, 1948. Natural evaporation from open water, bare soil and grass.Proceedings of the Royal Society A, 193: 120-146.

27
Penman H L, 1963. Vegetation and Hydrology. Harpenden, England: Commonwealth Agricultural Bureaux.

28
Sen P K, 1968. Estimates of the regression coefficient based on Kendall's tau.Journal of the American Statistical Association, 63: 1379-1389.

29
Stewart I T, Cayan D R, Dettinger M D, 2005. Changes toward earlier streamflow timing across western north America.Journal of Climate, 18: 1136-1155.

30
Wang G Q, 2009. Detection for climate variation trends in the upper Yellow River and its impact on eco-hydrology. Nanjing: Nanjing Hydraulic Research Institute. (in Chinese)

31
Westmacott J R, Burn D H, 1997. Climate change effects on the hydrologic regime within the Churchill-Nelson River basin.Journal of Hydrology, 202: 263-279.

32
Yao Y B, Wang R Y, Yang J Het al., 2013. Changes in terrestrial surface dry and wet conditions on the Loess Plateau (China) during the last half century.Journal of Arid Land, 5(1): 15-24.

33
Zhang L, Dawes W R, Walker G R, 2001. The response of mean annual evapotranspiration to vegetation changes at catchment scale.Water Resources Research, 37:701-708.

34
Zhang Q Y, Tao S Y, Chen L T, 2003. The inter-annual variability of East Asian summer monsoon indices and its association with the pattern of general circulation over East Asia.Acta Meteorologica Sinica, 61(4): 559-568. (in Chinese)

35
Zhang S F, Jia S F, Liu C Met al., 2004. Law of the changes of the water cycles in the sources region of the Yellow River and its impacts.Science in China Ser. E Technological Sciences, (Suppl. I): 117-125. (in Chinese)

36
Zhao F F, Xu Z X, Huang J X, 2007. Long-term trend and abrupt change for major climate variables in the upper Yellow River Basin.Acta Meteorologica Sinica, 21(2): 204-214.

37
Zhao F F, Xu Z X, Huang J Xet al., 2008. Monotonic trend and abrupt changes for major climate variables in the headwater catchment of the Yellow River basin.Hydrological Processes, 22: 4587-4599.

38
Zhu B C, 1981. Statistical Weather Forecast. Shanghai: Shanghai Scientific and Technical Publishers, 317-320. (in Chinese)

39
Zhu Y F, 2008. An index of East Asian winter monsoon applied to description the Chinese mainland winter temperature changes.Acta Meteorologica Sinica, 22(4): 522-529.

Outlines

/