Orginal Article

The relationships between land use change and demographic dynamics in western Jilin province

  • LI Fei , 1, 2 ,
  • ZHANG Shuwen , 1, 2, * ,
  • BU Kun 2 ,
  • YANG Jiuchun 2 ,
  • WANG Qing 1 ,
  • CHANG Liping 2
Expand
  • 1. College of Earth Science, Jilin University, Changchun 130061, China
  • 2. Northeast Institute of Geography and Agroecology, CAS, Changchun 130102, China

*Corresponding author: Zhang Shuwen, specialized in land system science. E-mail:

Author: Li Fei (1989-), PhD, specialized in land resource management. E-mail:

Received date: 2014-10-18

  Accepted date: 2015-01-05

  Online published: 2015-05-15

Supported by

Strategic Priority Research Program of the Chinese Academy of Sciences, No.XDA05090310

Development Program of Science and Technology Department of Jilin Province, No.2014020327NY

National Natural Science Foundation of China, No.41401660, No.41271416

Copyright

Journal of Geographical Sciences, All Rights Reserved

Abstract

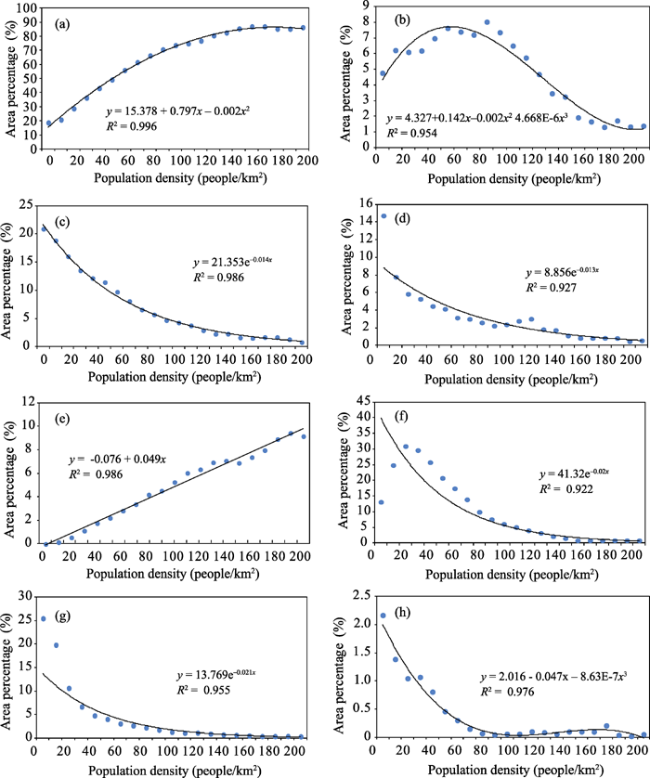
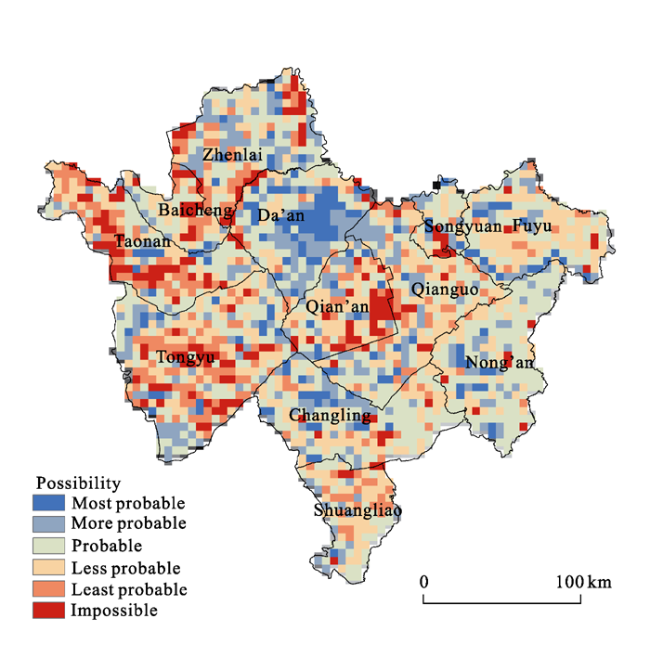
Demographic change was thought to be the most major driver of land use change although there were several interacting factors involved, especially in the developing countries. In this paper, we selected western Jilin province in China as the study area to provide a case study for understanding the relationship between spatial-temporal pattern of the land use change and population dynamics from 1975 to 2010. The results showed that the change of farmland area percentage could be modeled well by using a quadratic function, the least area percentage of farmland was 15.4% in areas where the population density was 0 people/km2, and farmland area percentage had a greatest value of 94.8% when population density was 199.25 people/km2. The area percentage of grassland, water body and wetland decreased exponentially with population density increased. The relationship between land use degree and population density could be modeled well by using a logistic regression models. Due to economic growth and technological progress and the existence of Hollow Village phenomenon, land use degree still increased in areas where population density was negative growth. In addition, land use dynamics increased exponentially with population density change. Land use relative change of woodland, grassland, built-up land and wetland were proportional to population density change. According to the simulation results of the land use structure and land use degree, Da’an and Zhenlai had the greatest possibility to be further reclaimed. As sensitive and fragile areas, it was of significance to study environmental protection and ecologic construction on Tongyu and Qian’an.

Cite this article

LI Fei , ZHANG Shuwen , BU Kun , YANG Jiuchun , WANG Qing , CHANG Liping . The relationships between land use change and demographic dynamics in western Jilin province[J]. Journal of Geographical Sciences, 2015 , 25(5) : 617 -636 . DOI: 10.1007/s11442-015-1191-x

1 Introduction

Land use change is an important component of the transformation that has taken place in areas with a long history of human occupation (DeFries et al., 2004; Bonilla-Moheno et al., 2012). The conversion of grassland, woodland and wetland into cropland and pasture during the last few decades has risen dramatically in worldwide (Lambin et al., 2003; Shiferaw et al., 2011; Showqi et al., 2014). Globally, it has altered the provision of ecosystem services, affected the global climate, and led to vast increases in production of food, timber, housing, and other commodities but at the cost of reductions in many ecosystem services and biodiversity (Tekle and Hedlund, 2000; Wang et al., 2012; Qasim et al., 2013). Therefore, understanding the driving forces and mechanism of land use change is a crucial issue in land change science (DeFries et al., 2007; Turner et al., 2007). This issue is not only a key aspect to understanding those phenomena concerning land use change, but a basis in solving socio-economic and environmental problems induced by land use change (DeFries and Eshleman, 2004; Foley et al., 2005), and also land use planning and sustainable use of land resources (Randolph, 2004).
However, land use is a dynamic system of high complexity and is the result of complex interactions among socio-economic (such as population growth, urbanization, economic development, institutional changes, technological advances, traffic-condition improvements, and even culture transitions) and environmental factors (such as climate change, land degradation, natural disasters) occurring at multiple temporal and spatial scales (Lambin et al., 2001; Geist and Lambin, 2001, 2002).
From the facts revealed in many published case studies, a perception has emerged suggesting that land use change is the result of people’s adaptation to natural and socio-economic changes (Lambin et al., 2001). However, this perception differs from many of the facts. Some phenomena such as the over-returning of farmland to woodlands in China, farmland abandonment, and urban expansion are not totally the result of passive adaptation, but are choices of human beings in changing circumstances (Zhu, 2013).
Historically, the most important driving force for most land use changes is population growth (Meyer and Turner, 1992; Bilsborrow and Ogendo, 1992) although there are several interacting factors involved (Lambin et al., 2001, 2003), especially in the developing countries (Bilsborrow and Ogendo, 1992; Ramankutty and Foley, 1999; Lambin et al., 2003; Ningal et al., 2008). Objectives for land use change differ between the developed and developing countries and/or regions. In developed countries, land use change is based on economic reasons such as large-scale farming or urban development and an increasing need to conserve biodiversity and environmental duality for current and future generations (Bouma et al., 1998), whereas in the developing countries, rapid population growth, poverty and the economic situation are the main driving forces (Meertens et al., 1996; Ramankutty and Foley, 1999; Lambin et al., 2003).
Population dynamics is quite important since reallocation of land is required to accommodate the ever increasing population (Verburg et al., 1999). Regional, national and global land conversion and consumption rates would continue to increase as population grows up. As the population and standard of life improves there is an obvious demand for producing more from natural resources especially the land. To meet such needs, the arable lands, built-up land are bound to expand at the cost of the natural land cover (Showqi et al., 2014).
Despite on-going efforts around the world at various scales, an information gap still exists in our understanding of the relationship between spatial-temporal pattern of the land use change and population dynamics (Clark, 1967; Eglington et al., 2012; Douglas et al., 2014). Especially in China, most reports mainly researched the statistical relations between translated land areas and population, seldom of them analyzed the impacts of population dynamics on land use pattern and landscape pattern changes (Wang et al., 2012; Zhu, 2014).
In this paper, we selected western Jilin province in China as the study area to provide a case study for understanding the relationship between spatial-temporal pattern of the land use change and population dynamics, in which we used spatialization methods to quantify the population dynamics in different counties and select several indicators, such as land use degree comprehensive index (LUDCI), land use dynamic index (LUDI) and land use relative change (LURC) to stand for spatial-temporal pattern of land use change and landscape pattern.

2 Material and Methods

2.1 Study area

Western Jilin province, one of the most serious saline-alkali areas in world, represented an interesting example to evaluate the effect of population dynamics on land use change patterns. With an area of 55,340 km2, western Jilin, located between 43°22′N-46°18′N and 121°36′E-126°12′E, includes 12 counties (cities) of Baicheng, Zhenlai, Taonan, Tongyu, Da’an, Songyuan, Qianguo, Qian’an, Changling, Fuyu, Nong’an and Shuangliao, accounting for 30% of the total land area of Jilin province (Figure 1). Topographically, the area was flat and situated mainly on an alluvial plain with an average altitude of 200 m (Figure 1). The climate was temperate sub-humid with a long winter lasting for 6 months from October to March. Based on data collected from 20 meteorological stations nearby, the mean annual rainfall for the years 1975-2010 was 350-500 mm, while the temperature ranged from -30°C to -2°C in January and from 12°C to 33°C in July. Vegetation cover in western Jilin was influenced mainly by soil type and rainfall and can be broadly classed into the eastern farmlands, central grass plains, western woodlands, and northern wetlands.
Since China’s reform and opening up, the population of western Jilin increased from 4.83 million to 6.45 million along with rapid urban expansion and land use change between 1975 and 2010. From 1975 to 2010, the proportion of non-agricultural population increased from 17.8% to 30.9% and the urban area increased by about 90 km2. Population growth resulted in severe overgrazing, reclaimed wasteland and ecosystem destruction which mainly reflected in desertification, alkalization and grassland degradation (referred to as the “Sanhua”) and the decline of black soil fertility in eastern, for example, approximately 40% grassland degraded, of which most converted to saline-alkali land or arable land. Meanwhile, forage quality was getting worse and worse (Wang et al., 2007; Hu, 2013). Works in western Jilin also showed a decrease in wetland by mostly subsistence agriculture, although saline-alkali land and extensive agriculture have become a recent form of land pressure (Yue et al., 2007).
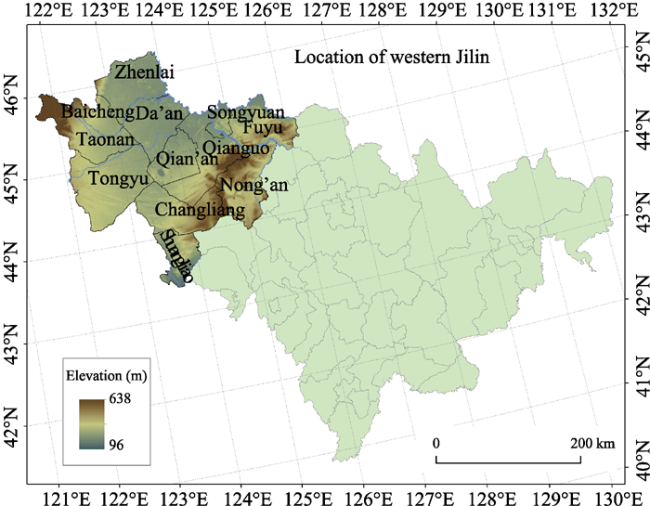
Figure 1 Location of western Jilin province, China

2.2 Land use

Land use reconstruction was a research topic that integrated multi-source data to form historical land use spatial data, and there were three main methods to reconstruct land use based on the data that people can obtain: first, extract information about land use/cover spatial distribution pattern according to historical maps (such as topographic maps, thematic maps); second, judge the possibility of land use spatial distribution in concerned area and then based on natural environmental background and socio-economic data; third, simulate the spatial distribution of land use in concerned period of time by mastering dynamic changes of land use since remote sensing information can be used (Bai and Zhang, 2004; Bai et al., 2007).
The data sources of land use that used in this article included remote sensing data, terrain data and various thematic maps, socio-economic statistical data and survey data, etc. Remote sensing data included Landsat/TM image data (2010) and MSS image data (1975); terrain data used herein were 1:10,000 and 1:50,000 topographic maps about 1975; natural environmental background data mainly included soil, hydrology, vegetation, topography and other thematic maps data. Each type of data was composed of spatial data and attribute data and processed through spatialization uniformly; the coordinate system was Beijing 1954 Gauss-Kruger projection. Land use data about 2010 and 1975 were acquired from TM image and MSS image respectively by visual interpretation and the latter need 1:10,000 and 1:50,000 topographic maps about 1975 as auxiliary data.
We divided land use into 6 categories, such as farmland, woodland, grassland, water body, built-up land and unused land, by using a primary classification system. Considering the severe alkalization in farmland and grassland and the disappearance of large areas wetland and in order to obtain a deep insight into the impact of population growth on them, we took alkali-land and wetland out of unused land as individual land use classes. The land use was classified into 8 categories in this research, respectively named farmland, woodland, grassland, water body, built-up land, alkali-land, wetland and unused land (Figure 2).

2.3 Demographic data

Demographic data used herein mainly from National Economy Statistics Data of Jilin Prov- ince (1949-1978) and National Counties and Cities Population Statistics Data of China (2010) both of which were collected by county and included total population (TP) and nonagricultural population (NP) or agricultural population (AP).
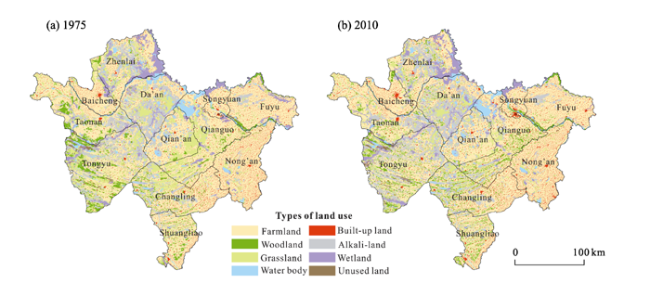
Figure 2 Land use of western Jilin in 1975 and 2010
Because the demographic data used in this article were collected by county, population density calculated based on these data could not reflect changes within a county, so we needed the spatialization of demographic data to emphasize and have a deep insight into the distribution and changes of population within the study area. Given the geographic and geomorphic conditions in western Jilin and the needs of research, we selected Kernel Density Estimation (KDE) to simulate raster surface of residents’ density, and then realized population density spatialization. By rational analysis of this method we can find that the formula of population density (PPD) of each grid is
where the TP is total population of the study area, N is the number of residents within the study area, and φi is resident density for each grid (Yan et al., 2011).
The basic thought of KDE is that geographical event can occur in anywhere and at anytime, but event probabilities are different in different places or/and at different time and the probability is quite high in areas where point is dense and is low in areas where point is sparse (Lu et al., 2002).
Based on the above discussion, this paper classified built-up land into two types: urban area and rural area. Then, we calculated the density of the two types of settlements by using KDE method. The population density of urban area (PDu) and rural area (PDr) could be calculated by
(2)
where TPi was the ith county’s total population, aui and ari were the area of urban area and rural area in ith county respectively and n was the total number of counties in the study area (n=11 in 1975 and n=12 in 2010).
Next, we modified the values of PDu and PDr based on regression total population and relative error (R) of every county to ensure that simulation values and demographic data were equal. Relative error and PDu, PDr correction formulas were:
where Ri was the relative error of regression total population in the ith county; TPi and 
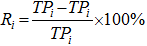
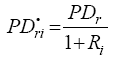
were demographic data and regression total population in the ith county respectively; 
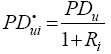
and were the modified value of population density in urban area and rural area in the ith county respectively.
Last, we could get the raster population surface according to formula (1) by using KDE method.

2.4 Land use metrics

We overlay population distribution maps and land use maps in different periods of time by calculating a set of land use metrics.
Land use degree comprehensive index (LUDCI) Land use degree primarily reflected the impact of human factors in land system that is a complex nature-society system. To take full advantage of remote sensing and geographic information systems technology in land use study, Liu et al. (2003) proposed a land use degree grade criterion from ecological perspective which divided land use into 4 grades (Table 1) and provided a quantitative expression of land use degree:
where Ai was i-grade index of land use degree and Ci was the percentage of i-grade land use. It could be learned from this formula that the comprehensive quantitative indicator system of land use degree was a continuous variation ranges from 100 to 400 and the value of the indicator reflected the level of land use (Wu and Guo, 1994; Zhuang and Liu, 1997; Gao et al., 1999; Liu et al., 2003).
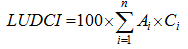
Table 1 Land resources use types and grades
Land use type Unused land,
wetland, alkali-land
Woodland, grassland, water body Farmland Built-up land
Grade 1 2 3 4
Land use dynamic index (LUDI) Land use dynamics was used to describe the rate of land use change and its mathematical expression was
where LUi was the area of the ith land use at starting time; ΔLUi-j was the value of the ith land use area that was converted to the non-ith land use in the study period; T was the length of the study period (Zhuang and Liu, 1997; Liu et al., 2003).
Land use relative change (LURC) Land use relative change reflected the regional difference of land use changes in value:
where Ka and Kb were the area of one type of land use in one region at starting time and end time respectively; Ca and Cb were the area of one type of land use in the study area at starting time and end time respectively. The change magnitude of one type of land use was greater in areas where the absolute value of LURC of this land use type was greater than 1 than in the whole study area, and vice versa. If a certain land use type’s LURC > 0 in a certain region, indicating that the change trends of this land use type in this region was as the same as the change trends of this land use type in the whole study area, and vice versa (Zhu et al., 2001).

3 Results and Analysis

3.1 Population density

Population, resources, energy, food and the environment were the top five issues facing the world today, and the population was the core. The population density was the main form to perform the characteristics of population spatial distribution. We used KDE method to simulate the population density of the study area in 1975 and 2010 (Figure 3). The results showed that the relative error of both years is less than 5%. In order to analyze the impact of population distribution on land use pattern and structure, we partitioned the study area into 22 regions (0, 0-10, 10-20,…, 190-200, >200) according to population density in 2010.
In addition, for studying the relationship between land use change and demographic dynamics, we calculated population density changes from 1975 to 2010 by use two raster maps and divided the study area into 12 regions (<-200, -200 to -150…, 0, 0-50, …, 200-250, >250) depending on the change magnitude of population density.
The regions where the population density was reduced between 1975 and 2010 mainly concentrated in the west of the study area, especially in Taonan and Zhenlai surrounding Baicheng. This was mainly because the rapid urbanization and economic development of Baicheng which resulted in a large number of people flocked into Baicheng from Taonan and Zhenlai. According to statistics, the total population of Taonan decreased by 55,000 and Baicheng increased by 310,000 from 1975 to 2010. Besides, due to land desertification and the constructions of Xianghai National Nature Reserve and Momoge Provincial Nature Reserve, the population density in southern Tongyu also declined.
Greatest change of total population and nonagricultural population in 35 years both occurred in Fuyu plus Songyuan (both of Fuyu and Songyuan belonged to Fuyu before 1995 and Songyuan was carved out from Fuyu as a city in 1995), and the total population increased by 540,000 included 340,000 nonagricultural people; Zhenlai showed the least change of total population which only increased by 1317, but its nonagricultural population increased from 50,000 to 100,000. Da’an had the least increase in nonagricultural population in the period of study, less than 50,000. Taonan was the only county where the total population decreased from 490,000 to 440,000 in 1975-2010, however, the nonagricultural population of Da’an increased by 50,000 over the same period. It was clear that large numbers of people migrated to urban area that speeded up the process of urbanization with the reform and opening up and socio-economic development. Up to 2010, the highest urbanization rate occurred in Baicheng, the political, economic and cultural center in western Jilin and its urbanization rate was 56.2%. However, the urbanization rate of Changling was the lowest in western Jilin, being only 17.5%.
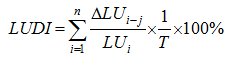
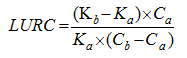
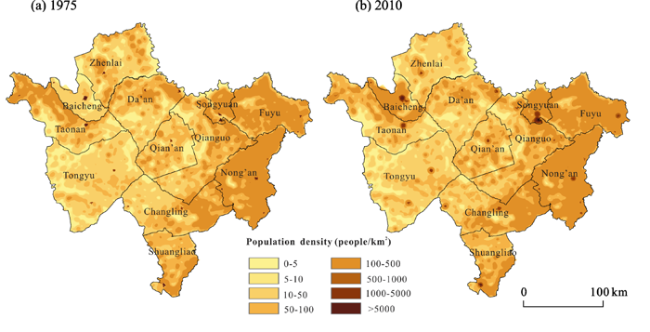
Figure 3 Population density of western Jilin in 1975 (a) and 2010 (b)

3.2 Land use change

Between 1975 and 2010, the most significant changes in land use were the decrease in grassland. The area of grassland was about 8500 km2 in 1975; however, it was only 5000 km2 in 2010. The decreased grassland was mainly converted to farmland (1575 km2), alkali-land (1396 km2) and woodland (920 km2); there were other types of land use that were converted to grassland at the same time, such as woodland (259 km2), alkali-land (162 km2) and farmland (111 km2) (Figure 4). The other characteristic of land use change in western Jilin was the increase in alkali-land. The alkali-land area increased by 1300 km2 between 1975 and 2010, and alkali-land account for 15% of the study area in 2010. The increased alkali-land mostly came from grassland (1396 km2) and wetland (163 km2). Arable land was at a dominant position in western Jilin and its area was also increasing at a rate of 60 km2/ year.
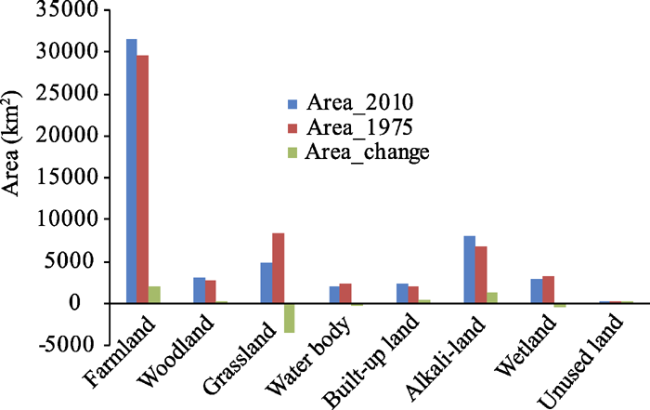
Figure 4 Land use change in western Jilin between 1975 and 2010
Although the total area of woodland remained unchanged, the distribution and pattern of woodland greatly changed. Some 1090 km2 of the woodland was deforested in 1975, most of which was converted into farmland (782 km2) and grassland (259 km2). Because of the construction of shelterbelt, 920 km2 of grasslands and 429 km2 of farmlands were converted to woodland between 1975 and 2010. Woodland was mainly in clumped distribution in the west of the study area in 1975 and had greater mean patch size in 1975 than in 2010 (Figure 2). In 2010, woodland was scattered on farmland or grassland over western Jilin.

3.3 The impacts of population density spatial variation on land use

3.3.1 The relationship between area percentage and population density
Regions with different population density had different land use structure. As can be seen from Figure 5, farmland had the greatest change in area percentage, the lowest area percentage (18.7%) of farmland occurred in regions where the population density was 0 people/km2 and farmland had the greatest area percentage (86.8%) when the population density was 160 people/km2. Area percentages of grassland, water body and wetland were all decreased with the increase in population density. The changes in area percentage of alkali-land and woodland were complex, which first increased and then decreased with the increase in population density. Area percentage of alkali-land had a greatest value (31%) when the population density was 20 people/km2.
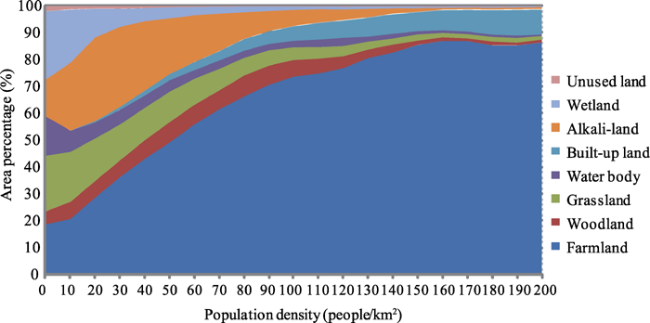
Figure 5 The relationship between area percentage and population density in western Jilin in 2010
To make a quantitative analysis on the influence of population density on land use structure, regression model of each type of land use was built (Figure 6). Farmland area percentage first increased and then decreased with the increase in population density, it could be modeled well by using a quadratic function. Results showed that the area percentage of farmland was 15.4% in where the population density was 0 people/km2, farmland area percentage had the greatest value of 94.8% when population density was 199.25 people/km2. The area percentages of woodland and unused land were modeled by a cubic function respectively. The area percentage of grassland, water body and wetland decreased exponentially with population density increased. Area percentage of built-up land linearly increased with the increase in population density. The land would be dominated by built-up land where the population density was more than 2000 people/km2. The simulation result of alkali-land area percentage was unsatisfactory, because there was a large deviation between emulation value and actual value.
Figure 6 Regression model of each type of land use in western Jilin in 2010

(a. farmland; b. woodland; c. grassland; d. water body; e. built-up land; f. alkali-land; g. wetland; h. unused land)

As for consumers and producers, their growth, distribution, structure, quality and population migration intimately affected land use/land cover change (Lambin et al., 2001; Ningal et al., 2008; Estes et al., 2012; de Freitas et al., 2013). Humans were regulating and organizing the structure of land system through production technology and life style, occupying a certain area of land as a place to live and consuming the products of land system which increasing the pressure on the productivity of land system (Al-shalabi et al., 2013). Changes in population would inevitably alter the labor resources of an area, the per capita amount of regional resources and social production capacity, which was closely related to social and economic development of a region, thus affecting the manner and direction of land use (Shoshany et al., 2002). Population growth inevitably led to the quantity of farmland and the quality of eco-environmental background changing and the human demand for production of land system increasing, while also resulted in land use degree and structure changing. Thus, the increase in population number and the change of population structure would drive other types of land use (e.g. woodland, wetland and unused land, etc) to convert to agricultural land and built-up land (Lau et al., 2005). And human lifestyle changes were bound to induce the adjustment of internal structure of agricultural land (Shao et al., 2007). Population growth needs to reclaim more grassland and wetland as farmland and built-up land, while some other problems caused by change in the relationship between human generated would also act on the land, for example, the excessive application of fertilizers and pesticides with the aim of increasing crop yield certainly would produce great harms on water resource and the health of human and animal. The increasing multiple cropping index caused by population growth was also not conducive to maintaining farmland biodiversity. In addition, the increase in the number of farmer households was making farmland more broken and resulting in the fragmented land border more diverse, affecting the local land use pattern.
The study area is located in the eastern edge of the agriculture-pasture ecotone in northern China and the native vegetation is Leymus chinensis. Large areas of pasture was converted to farmland due to population growth, and livestock increase every year resulted in prominent and widespread overgrazing of grassland and grassland degradation, or even converted to alkali-land completely and bare. The pasture grass yield was 1350 kg/hm2 and can carry 5.4million sheep units in 1985 in western Jilin; however, it was reduced to 600 kg/hm2 and the area of grassland decreased by 600,000 hm2 by the late 1990s. The theoretical grazing capacity was 2.3 million sheep units, but it actually carried 12 million sheep units which overloaded by 4.2 times (Qiu et al., 2003; Sun et al., 2004).
Human impact on wetland degradation in the study area was mainly manifested in two aspects: (i) different ways of human activities, such as reclamation activities, water conservancy, overgrazing, directly or indirectly led to the shrinkage and degradation of wetland by changing their living space, hydrological conditions and vegetation; (ii) the inadequacy of laws, regulations, institutions and mechanisms resulted in the ineffective protection of wetland, thus the increasing population density led to the atrophy and function degradation of wetland. Furthermore, other human activities, such as highway construction, oil and salt mining, urban and rural construction, could also cause varying degrees of reduction in wetland area; what is more serious was to make wetland harden and increase wetland fragmentation, causing serious degradation of ecological functions of wetlands (Yue et al., 2008).
Increasing urbanization made a large number of rural population swarm into urban. Increase in urban population density inevitably formed a lot of pressure on the land and let the contradiction between human and land increasingly prominent, resulted in changes in land use structure. Meanwhile, redistribution of land resources among different industrial sectors caused by the changes in industrial structure also could lead to changes in land use structure (Wang, 2009).
Taking account of the goodness of fitting, we selected farmland for further analysis. Fitted curve between population density and farmland area percentage in Figure 7 showed the mean level of the study area, if the actual farmland area percentage in a region less than the emulation value, it could show that the area of farmland probably would increase in this region, in other words, the probability of this region would be further reclaimed was greater than the mean level of the study area. Thus, we calculated the actual and simulate farmland area percentage of each grid. The study area was divided into 6 regions according to the difference between actual and simulated farmland area percentage (Figure 7). Da’an is most probable to be further reclaimed in future, and the large areas grassland would provide abundant land resource to be reclaimed. The government should formulate policies as early as possible to protect grassland in Da’an. It is impossible to increase the area of farmland in Baicheng, southwest of Taonan, Tongyu and the east of Qian’an; actually, these four regions are in bad need of returning farmland to grassland or woodland.
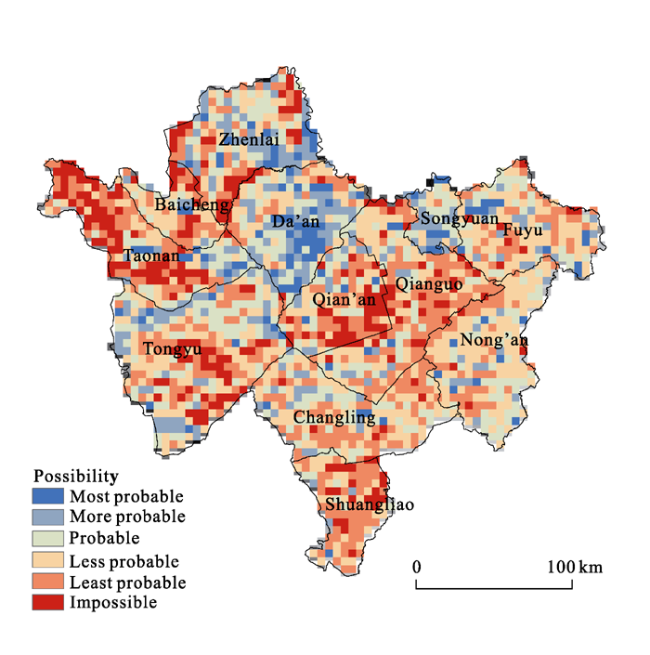
Figure 7 The possibility of land would be further reclaimed in western Jilin
3.3.2 The impacts of population density spatial variation on land use degree
Land use degree comprehensive index (LUDCI) reflected the degree of influence of human factors on land systems and the spatial variation of land use degree. We calculated the LUDCI of different regions with different population densities in 2010. The results showed that LUDCI and population density were positively correlated (Figure 8). That is, land use degree increased with the increase in population density. As human activities were not frequent and the demand for land was not strong in areas with low population density, the interference of human on land use was less, resulted in more grassland, wetland, water body and unused land and lower land use degree. For example, the main land use types were wetland (25.5%) and grassland (20.9%) in the region with a population density of 0, its land use degree was low and LUDCI was only 177.9. The LUDCI of a region with a population density of 0 was greater than the LUDCI of the region whose population density ranged from 0 to 10 people/km2, due to the more percentages of alkali-land in the latter. In regions with greater population density, frequent human activities and high demand for land strongly interfered with land cover which resulted in a very large proportion of the area in built-up land and arable land, therefore the land use degree was greater. For instance, the regions with LUDCI even up to 399.4 had the highest population density and 99.5% of the land was used as built-up land in 1975.
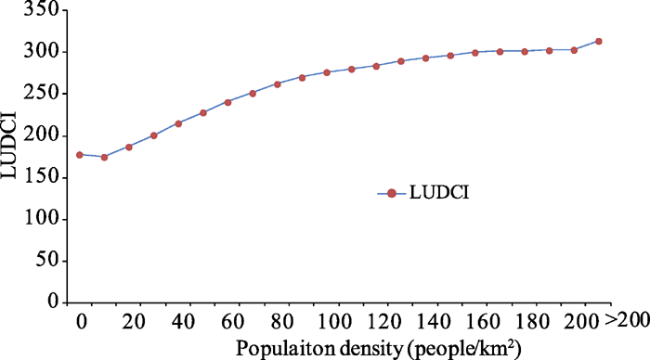
Figure 8 LUDCI of different regions in western Jilin in 2010
We built a regression model of LUDCI for further analysis of the relationship between LUDCI and population density. In consideration of the value of LUDCI could never exceed 400, we used logistic regression models to examine the impacts of population density spatial variation on land use degree. The results of simulation were satisfactory, R2 = 0.923:
where x was population density and y was LUDCI.
We could simulate the land use degree of each grid according to the regression model of LUDCI. If the simulated value of a certain grid was greater than the actual value, it showed that the land use degree of this grid was below average in the study area and this grid would be more probable to be further reclaimed; if the simulated value of a certain grid was less than the actual value, it showed that the land use degree of this grid was higher than the average level and this grid should return farmland to grassland or woodland. We divided the study area into 6 regions by calculating the difference between simulated value and actual value of each grid’s land use degree, the possibility of increase in land use degree was different in each region. Da’an and Zhenlai had the greatest possibility to be further reclaimed; the reclamation of land would destroy the local grassland and wetland and result in land deterioration. The impacts of human activities on land system were stronger in Baicheng, Taonan, Tongyu, and Qian’an than in other areas, though the population density was low in Tongyu and Qian’an. As sensitive and fragile areas, it is of great significance to study environmental protection and ecologic rehabilitation in Tongyu and Qian’an (Figure 9).
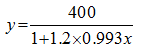
Figure 9 The possibility of increase in land use degree in western Jilin

3.4 The impacts of population density temporal variation on land use

3.4.1 The impacts of population density temporal variation on land use degree change
To better understand the relationship between the temporal change of land use degree and demographic changes, we introduced land use degree change (LUDC) as an indicator (i.e., land use degree changes=land use degree at ending time-land use degree at starting time) to quantitatively analyze the influence of population density temporal variation on land use degree. We devided the study area into 12 regions according to population density change (<-250, -250 to -200, …, 200-250, >250) and calculated the land use degree change in each region. The result showed that it could be well modeled by a trinomial equation. Overall, the value of LUDC increased with the increase in population density change (Figure 10). However, there was an interesting phenomenon should be noted, i.e., that LUDC was proportional to population density change in where population density was negative growth. In other words, land use degree was not reduced with the decrease of population density; on the contrary, it was still increased. This was because although the population density was increased, grassland, wetland and unused land were converted to farmland by local residents driven by economic interests and technological progress. Furthermore, the rapid development of China’s industrialization and urbanization since the reform and opening up in 1978 had a profound impact on socio-economic development in rural areas and farmers’ income and rural housing demand continued to grow as a result of the transfer of rural population to off-farm and the employment increase in job opportunities. In the absence of rural development planning and strict land management, Hollow Village became an increasingly common phenomenon (Liu et al., 2009; Long et al., 2009), which was an important reason for the increase of land use degree in areas where population densities decreased.
Figure 10 Land use degree change in western Jilin between 1975 and 2010
3.4.2 The impacts of population density temporal variation on land use dynamics
Land use dynamic index (LUDI) was one of the main models for depicting the change rate of land use and could truly reflect the intensity of regional land use change. We compared the LUDI in regions with different values of population density change and found that the greater the population density change, the greater the land use dynamics between 1975 and 2010 (Figure 11). Population increase could inevitably prompt other land use (such as grassland, woodland, marsh, unused land, etc.) to be converted to agricultural land and promoted constant change in land use structure and spatial distribution. Meanwhile, the constantly increasing of population improved the level of urbanization and increased the land demands for housing and infrastructure construction and exacerbated the relationships between human and land and the tensions of contradictions of land supply and demand. So, land use dynamics and changes in population density had a positive relationship.
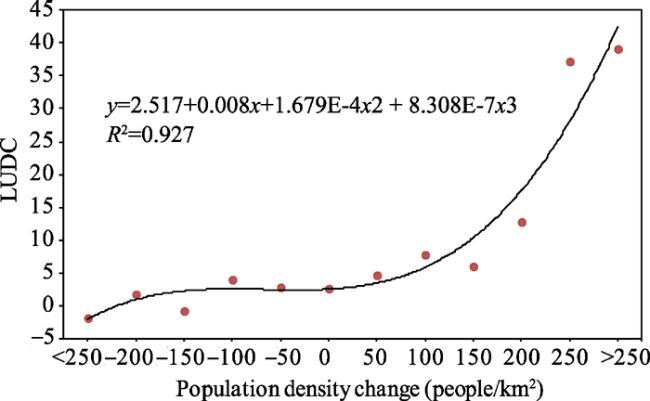
Figure 11 Land use dynamics in western Jilin between 1975 and 2010
3.4.3 The impacts of population density temporal variation on land use relative change
Land use relative change (LURC) reflected the regional difference of land use changes in value. The change magnitude of one type of land use in where absolute value of LURC of this land use type was greater than 1 was greater than it in the whole study area, and vice versa. If a certain land use type’s LURC > 0 in a certain region, indicated that the change trends of this land use type in this region was as same as the change trends of this land use type in the whole study area, and vice versa. In order to facilitate the analysis, we divided the study area into 6 regions depending on the change magnitude of population density (<-10, -10-0, 0-10, 10-50, 50-100, >100), named BH1, BH2, BH3, BH4, BH5 and BH6.
Farmland Land use relative change of farmland decreased with the increasing of change amplitude of population density (Figure 12a). This was because the population density was generally low in where the magnitude of population density change was small, accordingly, the lower the population density, the smaller the proportion of arable land, which resulted in a slight increase of arable land, indicating a high growth rate of farmland. With the increase in the magnitude of population density change, population density increased and the proportion of arable land gradually rose, the increased cultivated area was no longer able to cause significant changes in the number of arable land, while the human’s land demand for residential construction was also increasing at the same time. The built-up land expanded and occupied a large area of farmland that partially neutralized new farmland and reduced the area of arable land, so the land use relative change of farmland was small in regions where the population density was low and even less than the average change rate of cultivated land in the entire study area. With the increase in population density change magnitude, population density was higher and higher, when human’s demand for built-up land was greater than the demand for arable land, a large number of cultivated lands would be acquisitioned for built-up land and the area of farmland began to shrink, so the change trend of farmland in these regions was opposite to farmland change trend in the entire study area, for example, in BH6.
Woodland On the whole, with the increase in population density change magnitude from 1975 to 2010, the rate of woodland change gradually accelerated in western Jilin due to the construction of China’s Three-Norths Shelterbelts. The area of woodland was increased in all regions except BH2. The reason why the area of woodland was decreased in BH2 was that severe desertification damaged the living environment of trees and resulted in the disappearance of woodland. In addition, the woodland mainly distributed in the sparsely populated areas was also an important reason for that the LURC of woodland increased with the increasing change magnitude of population density. However, the study area belongs to temperate semi-humid and semi-arid steppe climate, the relative scarcity of water is not suitable for the growth of large tracts of woodland and woodland area is not the bigger the better. Therefore, afforestation should be adapted to local conditions, so as to avoid unnecessary losses and environmental degradation (Figure 12b).
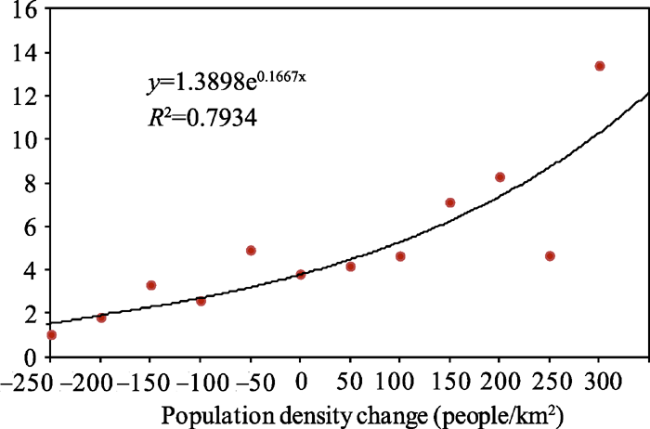
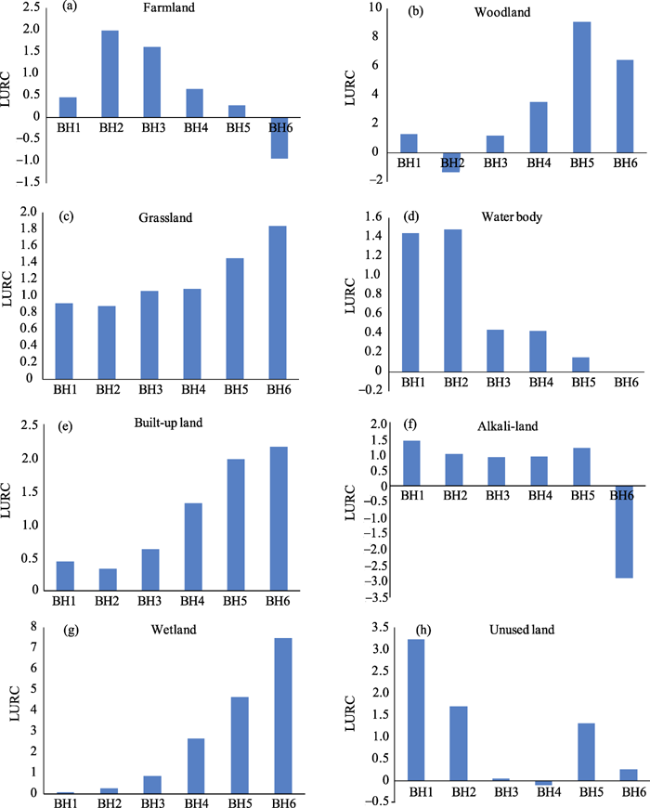
Figure 12 Land use relative change in western Jilin between 1975 and 2010
Grassland The most appropriate land use type in the study area was grassland because of the climate and environment. Here was one of the best pastures in China and “under the blue sky, on the vast land, with the wind blowing, appears the animals” was a true portrayal of western Jilin before 1900. However, meadow has suffered unprecedented damages since the invaders occupied this area in 1931 and the area of grassland only remained less than 1/3 of the original on the eve of the founding of New China. After 1949, the one-sided emphasis on “taking grain as the key link” resulted in sustained reduction in grassland. The area of grassland in the study area also showed a decreasing trend between 1975 and 2010. No matter how population density changed between 1975 and 2010, the area of grassland was reduced, and the land use relative change of grassland and the change amplitude of population density were significantly positively correlated. Although the population density was reduced in BH1 and BH2, the area of grassland was still decreased; however, the relative change rate of grassland in these two regions was less than the rate of grassland change in the whole study area. As the change amplitude of population density increased, the LURC of grassland was growing and the change rate of grassland in regions where the population density increased was greater than it in the entire study area. This suggested that population growth was an important reason for the decrease of grassland between 1975 and 2010 (Figure 12c).
Water body With the increase of the rate of increase of population density, the relative change of water was smaller and smaller and the LURC of water in where the population density decreased was much greater than it in where population was increased, the former was 3-10 times of the later. The main cause of this strange phenomenon was that most of water concentrated in BH1 and BH2 where population density reduced, and in these two regions, the construction of Momoge Nation Nature Reserve and Xianghai Nation Nature Reserve prompted a large area of water convert to wetland (Figure 12d).
Built-up land Increase in population would inevitably lead to increased demand for built-up land and construction land, therefore, the relative change of built-up land became larger as the increases of population density rose. Although the population density was reduced in BH1 and BH2, the area of built-up land still increased, which proved Hollow Village phenomenon previously described does exist (Figure 12e).
Alkali-land With the rise in population density increases, the land use relative change of alkali-land remained unchanged basically. This suggested that land salinization was a common phenomenon in the study area due to the accumulation of impact of early human activities on environment. If not remedied, land salinization would continue to increase. In region BH6, the greatly reducing of alkali-land was mainly due to the expansion of urban land which led to alkali-land converted to built-up land (Figure 12f).
Wetland The change trend of land use relative change of wetland was similar to grassland, rising as the population density increased. However, the impact of population density change on land use relative change of wetland was more obvious than it on grassland. It was because increasing population density increased the demand for arable land and a large area of wetland was reclaimed as farmland, in addition, the more the population density increased, the greater the land use relative change of wetland (Figure 12g).
Unused land The land use relative change of unused land had no significant trend as the rose of population density increase due to its too small area (Figure 12h).

4 Discussion

Population change was the most direct factor affecting land use change, causing changes in the intensity and structure of land use by changing the quantity structure, pattern and product demand of land use. Population growth and continuous improving urbanization resulted in increasing size of arable land and built-up land, which exacerbated the contradiction of between human society and land system. Meanwhile, the flow and transfer of population changed the pattern of population distribution in different regions, and thus it had an important impact on the demand for land and land use pattern of the original, so that land use changed accordingly.
We used population density and its change to analyze the impacts of demographic dynamics on land use change in this article, ignored the age structure, sex ratio, ethnic and other demographic factors. There were some biases in the study inevitably. However, as the most important demographic factor, population density reflected the space distribution regularities of population and affected the pattern of land use. It was very profound to explore the relationship between population density change and land use change, and results were credible.
Only land use degree, land use dynamics and land use relative change were used to quantify the evaluation of land use change in this study, leading to the imperfection and one-sidedness of results. There were some problems which need to make a thorough study in the impacts of demographic dynamics on the spatial configuration and structure of land use.
In addition, we only selected two terms population data and land use data for analysis because of the limitation of data source, which resulted the results lack of discussion of land use change progress, and there might be some errors in the prediction of land use change. More accurate analysis of the land use change progress and the variation trend in future by building land use change time series database is one of the main contents of our follow-up research.

5 Conclusions

This paper analyzed the impacts of population density spatial and temporal variation on land use change and came to the following conclusions:
(1) The change of farmland area percentage with population density increase could be modeled well by using a quadratic function, the least area percentage of farmland was 15.4% in where the population density was 0 people/km2, and farmland area percentage had a greatest value of 94.8% when population density was 199.25 people/km2. The area percentages of woodland and unused land were modeled by a cubic function respectively. The area percentage of grassland, water body and wetland decreased exponentially with population density increase. Area percentage of built-up land linearly increased with the increase in population density. The land would be dominated by built-up land in where the population density was more than 2000 people/km2.
(2) In addition, land use degree increased with the increase in population density, the relationship between LUDCI and population density could be modeled well by using a logistic regression models. To better understand the relationship between the temporal change of land use degree and demographic changes, we introduced land use degree change (LUDC) as an indicator to quantitatively analyze the influence of population density temporal variation on land use degree. The value of LUDC increased with the increase in population density change. Due to economic growth and technological progress and the existence of Hollow Village phenomenon, land use degree still increased in where population density was negative growth.
(3) Land use dynamics increased exponentially with population density change. Land use relative change of farmland and water body decreased with the increasing of change amplitude of population density. Land use relative change of woodland, grassland, built-up land and wetland were proportional to population density change. With the rise in population density change magnitude, the land use relative change of alkali-land remained unchanged basically, which suggested land salinization was a common phenomenon in the study area.
(4) According to the simulation results of the land use structure and land use degree, Da’an and Zhenlai had the greatest possibility to be further reclaimed; the reclamation of land would destroy the local grassland and wetland and result in land deterioration. The impacts of human activities on land system were stronger in Baicheng, Taonan, Tongyu, and Qian’an than in other areas, though the population density was low in Tongyu and Qian’an. As sensitive and fragile areas, it is of great significance to study environmental protection and ecologic rehabilitation in Tongyu and Qian’an.

The authors have declared that no competing interests exist.

1
Al-shalabi M, Billa L, Pradhan Bet al., 2013. Modeling urban growth evolution and land-use changes using GIS based cellular automata and SLEUTH models: The case of Sana’a metropolitan city, Yemen.Environmental Earth Sciences, 70(1): 425-437.

2
Bai S, Zhang S, 2004. The discussion of the method of land utilization spatial information reappearance of history period.Journal of Arid Land Resources and Environment, 18(5): 77-80. (in Chinese)

3
Bai S, Zhang S, Zhang Y, 2007. Digital rebuilding of LUCC spatial-temporal distribution of the last 100 years: Taking Dorbod Mongolian Autonomous County in Daqing City as an example.Acta Geographica Sinica, 62(4): 427-436. (in Chinese)

4
Bilsborrow R E, Ogendo H W, 1992. Population-driven changes in land use in developing countries. Ambio, 21(1): 37-45.

5
Bonilla-Moheno M, Aide T M, Clark M L, 2012. The influence of socioeconomic, environmental, and demographic factors on municipality-scale land-cover change in Mexico.Regional Environmental Change, 12(3): 543-557.

6
Bouma J, Varallyay G, Batjes N H, 1998. Principal land use changes anticipated in Europe.Agriculture, Ecosystems & Environment, 67(2): 103-119.

7
Clark C, 1967. Population Growth and Land Use. London: MacMillan.

8
De Freitas M W D, Dos Santos J R, Alves D S, 2013. Land-use and land-cover change processes in the Upper Uruguay Basin: Linking environmental and socioeconomic variables.Landscape Ecology, 28(2): 311-327.

9
DeFries R, Eshleman K N, 2004. Land-use change and hydrologic processes: A major focus for the future.Hydrological Processes, 18(11): 2183-2186.

10
DeFries R, Hansen A, Turner B Let al., 2007. Land use change around protected areas: Management to balance human needs and ecological function.Ecological Applications, 17(4): 1031-1038.

11
DeFries R S, Foley J A, Asner G P, 2004. Land-use choices: Balancing human needs and ecosystem function.Frontiers in Ecology and the Environment, 2(5): 249-257.

12
Douglas D J T, Bellamy P E, Stephen L Set al., 2014. Upland land use predicts population decline in a globally near-threatened wader.Journal of Applied Ecology, 51(1): 194-203.

13
Eglington S M, Pearce-Higgins J W, 2012. Disentangling the relative importance of changes in climate and land-use intensity in driving recent bird population trends.PloS One, 7(3): e30407.

14
Estes A B, Kuemmerle T, Kushnir Het al., 2012. Land-cover change and human population trends in the greater Serengeti ecosystem from 1984-2003.Biological Conservation, 147(1): 255-263.

15
Foley J A, DeFries R, Asner G Pet al., 2005. Global consequences of land use.Science, 309(5734): 570-574.

16
Gao Z, Liu J, Zhuang D, 1999. The research of Chinese land-use/land-cover present situations.Journal of Remote Sensing, 3(2): 134-138. (in Chinese)

17
Geist H J, Lambin E F, 2002. Proximate causes and underlying driving forces of tropical dewoodlandation tropical woodlands are disappearing as the result of many pressures, both local and regional, acting in various combinations in different geographical locations.BioScience, 52(2): 143-150.

18
Geist H J, Lambin E F, 2001. What drives tropical dewoodlandation.LUCC Report Series, 4: 116.

19
Hu F, 2013. Research on the renovation planning of saline and alkali and in the west of Jilin based on remote sensing techniques [D]. Changchun: Jilin University. (in Chinese)

20
Lambin E F, Geist H J, Lepers E, 2003. Dynamics of land-use and land-cover change in tropical regions.Annual Review of Environment and Resources, 28(1): 205-241.

21
Lambin E F, Turner B L, Geist H Jet al., 2001. The causes of land-use and land-cover change: Moving beyond the myths.Global Environmental Change, 11(4): 261-269.

22
Lau S S Y, Giridharan R, Ganesan S, 2005. Multiple and intensive land use: Case studies in Hong Kong.Habitat International, 29(3): 527-546.

23
Liu J, Liu M, Zhuang Det al., 2003. Study on spatial pattern of land-use change in China during 1995-2000.Science in China Series D: Earth Sciences, 46(4): 373-384. (in Chinese)

24
Liu Y, Liu Y, Zhai R, 2009. Geographical research and optimizing practice of rural hollowing in China.Acta Geographica Sinica, 64(10): 1193-1202. (in Chinese)

25
Long H L, Li Y R, Liu Y S, 2009. Analysis of evolutive characteristics and their driving mechanism of hollowing villages in China.Acta Geographica Sinica, 64(10): 1203-1213. (in Chinese)

26
Lu A, Li C, Lin Zet al., 2002. Spatial distribution of statistical population data.Geometrics and Information Science of Wuhan University, 27(3): 301-305. (in Chinese)

27
Martinuzzi S, Gould W A, Ramos Gonzalez O M, 2007. Land development, land use, and urban sprawl in Puerto Rico integrating remote sensing and population census data.Landscape and Urban Planning, 79(3): 288-297.

28
Meyer W B, Turner B L, 1992. Human population growth and global land-use/cover change.Annual Review of Ecology and Systematic, 23: 39-61.

29
Ningal T, Hartemink A E, Bregt A K, 2008. Land use change and population growth in the Morobe Province of Papua New Guinea between 1975 and 2000.Journal of Environmental Management, 87(1): 117-124.

30
Qasim M, Hubacek K, Termansen M, 2013. Underlying and proximate driving causes of land use change in district Swat, Pakistan.Land Use Policy, 34: 146-157.

31
Qiu S W, Zhang B, Wang Z C, 2003. Status, features and management practices of land desertification in the west of Jilin Province.Scientia Geographica Sinica, 23(2): 188-192. (in Chinese)

32
Ramankutty N, Foley J A, 1999. Estimating historical changes in global land cover: Croplands from 1700 to 1992.Global Biogeochemical Cycles, 13(4): 997-1027.

33
Randolph J, 2004. Environmental land use planning and management. Island Press..

34
Shao J, Li Y, Wei Cet al., 2007. Land use change and its socio-economic driving forces in Dahong River Reservoir Area.Chinese Journal of Ecology, 26(6): 898-903. (in Chinese)

35
Shiferaw A, 2011. Evaluating the land use and land cover dynamics in Borena Woreda of South Wollo Highlands, Ethiopia.Journal of Sustainable Development in Africa, 13(1): 1520-5509.

36
Shoshany M, Goldshleger N, 2002. Land-use and population density changes in Israel-1950 to 1990: Analysis of regional and local trends. Land Use Policy, 19(2): 123-133.

37
Showqi I, Rashid I, Romshoo S A, 2014. Land use land cover dynamics as a function of changing demography and hydrology.GeoJournal, 79(3): 297-307.

38
Sun G, Wang H, Yu Set al., 2004. Strong stress triggers catastrophic change on fragile environment: An example of the development history for the past 100 years in the Songliao plain. Quaternary Sciences, 24(6): 663-671. (in Chinese)

39
Tekle K, Hedlund L, 2000. Land cover changes between 1958 and 1986 in Kalu District, southern Wello, Ethiopia.Mountain Research and Development, 20(1): 42-51.

40
Turner B L, Lambin E F, Reenberg A, 2007. The emergence of land change science for global environmental change and sustainability.Proceedings of the National Academy of Sciences, 104(52): 20666-20671.

41
Verburg P H, Veldkamp T, Bouma J, 1999. Land use change under conditions of high population pressure: The case of Java.Global Environmental Change, 9(4): 303-312.

42
Wang J, 2009. Relation between the urbanization and the land utilization in Dalian. China Population, Resources and Environment, 19(1): 59-63. (in Chinese)

43
Wang J, Chen Y, Shao Xet al., 2012. Land-use changes and policy dimension driving forces in China: Present, trend and future.Land Use Policy, 29(4): 737-749.

44
Wang M Q, Wang J D, Liu J S, 2007. Emergy analysis of the eco-economic systems of west Jilin province according to the resource and environment gradient.Journal of Natural Resources, 22(4): 507-515.

45
Wu C, Guo H, 1994. Land Use in China. Beijing: Chinese Science & Technology Press. (in Chinese)

46
Yan Q W, Bian Z F, Zhang Pet al., 2011. Census spatialization based on settlements density.Geography and Geo-information Science, 27(5): 95-98. (in Chinese)

47
Yue S, Zhang S, Yan Y, 2008. Analysis of wetland landscape pattern change and its driving mechanism in Jilin western part.China Environmental Science, 28(2): 163-167. (in Chinese)

48
Zhu Huiyi, 2013. Underlying motivation for land use change: A case study on the variation of agricultural factor productivity in Xinjiang, China.Journal of Geographical Sciences, 23(6): 1041-1051.

49
Zhu Huiyi, Li Xiubin, He Shujin, 2001. Spatio-temporal change of land use in Bohai Rim.Acta Geographica Sinica, 56(3): 260-267. (in Chinese)

50
Zhuang D, Liu J, 1997. The regional model study of Chinese land use degree.Journal of Natural Resources, 12(2): 10-14. (in Chinese)

Outlines

/