Orginal Article

The effects of land consolidation on the ecological connectivity based on ecosystem service value: A case study of Da’an land consolidation project in Jilin province

  • WANG Jun , 1 ,
  • YAN Shenchun 1, 2 ,
  • GUO Yiqiang 1 ,
  • LI Junran 3 ,
  • SUN Guoqing 2
Expand
  • 1. Key Laboratory of Land Consolidation and Rehabilitation, Ministry of Land and Resources, Beijing 100035, China
  • 2. School of Land Science and Technology, China University of Geosciences, Beijing 100083, China
  • 3. Department of Geosciences, The University of Tulsa, Tulsa, OK 74104, USA

Author: Wang Jun, PhD and Research Fellow, specialized in landscape ecology, land change science and land consolidation. E-mail:

Received date: 2013-10-22

  Accepted date: 2014-06-30

  Online published: 2015-05-15

Supported by

National Natural Science Foundation of China, No.41171152

Copyright

Journal of Geographical Sciences, All Rights Reserved

Abstract

Land consolidation has a profound impact on landscape patterns and ecological functions at various scales through engineering and biological measures. In recent years, China invests more than 100 billion RMB yuan on land consolidation each year. To understand how land consolidation affects landscape patterns and ecosystems, we investigated the ecosystem service value and the ecological connectivity in a consolidated area of Da’an city from 2008 to 2014 using a revised ecological connectivity index. The results indicated that land consolidation has certain negative influences on the ecosystem services in this area. The total ecosystem service value will decrease by nearly 30% in the late stage of consolidation. This decrease is caused by the loss of ecosystem service of the wetland and grassland, despite a sensible increase of cultivated land. In addition, land consolidation could change the ecological connectivity as well as the land use structure. Up to 85% of the entire area will be in low connectivity in the late stage of consolidation, representing a 6.23% increase in the total coverage compared to pre-consolidation. Finally, the different connectivity landscape and their key areas can be identified by the revised ecological connectivity index effectively. This study is helpful to trace out the relationships between landscape pattern and ecological process, and provides insights for ecological planning and designing of land consolidation in this area. We suggest that more attentions should be paid to improve the quality and ecosystem service value per unit area of the landscape, to establish ecological compensation mechanism of wetland losses, and to create the ecological corridors along the least accumulated impendence surface in the key areas during land consolidation.

Cite this article

WANG Jun , YAN Shenchun , GUO Yiqiang , LI Junran , SUN Guoqing . The effects of land consolidation on the ecological connectivity based on ecosystem service value: A case study of Da’an land consolidation project in Jilin province[J]. Journal of Geographical Sciences, 2015 , 25(5) : 603 -616 . DOI: 10.1007/s11442-015-1190-y

1 Introduction

The influence of land use/cover changes (LUCC) on ecological functions has become one of the hot fields in ecology and geography. Land consolidation is known to be a most important driving force for the LUCC with purpose, and it inevitably results in an impact on the ecological functions (Rafael et al., 2002; Yu et al., 2011; Wang et al., 2011). Land consolidation may be depicted as a planned re-adjustment and re-arrangement of land parcels and their ownership. Through land consolidation, land quality and agricultural infrastructures such as irrigation systems and roads are improved, and land fragmentation is reduced. At the same time, land use patterns are significantly transformed (Wang and Zhang, 2004; Yun et al., 2008; Pasakarnis and Maliene, 2010).
The impacts of land consolidation on landscape pattern have been analyzed primarily based on the “matrix-patches-corridors” theory (Wang et al., 2007; Yu et al., 2008; Liu et al., 2008; Gu and Chen, 2008). These studies usually compared the changes of landscape structure characteristics and evaluated the ecological effect of land consolidation by using the traditional landscape indices. However, these landscape indices are sensitive to the scales of observations or samplings, and the classification of data sources. Studies about dual impacts of land consolidation on the environment and ecological processes are concentrated on its effects on soil, water, flora and fauna (Luo and Zhang, 2002; Zhang and Zhao, 2007; Ai et al., 2007; Niu et al., 2008). While a rational land consolidation may put positive effects on the environment, it can also disturb or damage the ecological functions and processes if land consolidation exceeds the capacity of ecosystems. Moreover, it is a great challenge to evaluate the dual influences of land consolidation on environment objectively and accurately. Most researchers assess the ecological effects of land consolidation by means of landscape pattern index and some mathematical models (Zhang, 2008; Wu et al., 2008; Chen et al., 2008; Ou et al., 2009).
An issue raised here is how to trace out the relationships between landscape pattern and ecological functions during the process of land consolidation. Landscape ecological connectivity is the degree to which the landscape facilitates or impedes the movement of ecological flows among resource patches, which is considered an effective link among patterns, processes, and functions in an area (Taylor, 1993; Philippe and Burel, 1997; Mallarach and Marull, 2006; Sun and Liu, 2010). Ecological connectivity plays a highly important role in ecological processes, such as soil erosion, movements of flora and fauna populations, gene flow and disturbance spread (Davenport, 1998). In addition, ecological connectivity has also been widely applied in the biological resource management, biodiversity protection, and landscape planning and designing (Jordan et al., 2003; Ferreras, 2001; Timothy, 2004). It is critical to investigate the relationships between landscape patterns and ecological functions during the process of land consolidation using ecological connectivity methods. Unfortunately, there are not many further studies to explore the relationships by ecological connectivity method in a large scale.

1.1 Ecological connectivity and its practical application

The primary methods of ecological connectivity are to quantify the changes of landscape pattern and ecological function by experimental studies, model simulation on specific ecological processes, and landscape indices (Lucia and Saura, 2006; Fu et al., 2009). The experimental studies can be used to obtain original data of biological behavior characteristics by tracking their movement paths using appropriate approaches. For example, Gillis and Krebs (2003) used radio-telemetry to monitor the survival of dispersing and juvenile snowshoe hares. Their study indicated that the overall survival cost associated with natal dispersal was low for snowshoe hares during the early increase of the hare cycle. Bowne et al. (2006) calculated connectivity based on observed movement rates and movement probabilities for five age-sex classes of painted turtles. Their results demonstrated that connectivity was strongly dependent on the movement behavior of the species. Langevelde (2000) investigated the relationship between the degree of connectivity of wooded patches measured at different spatial scales and the colonization of these patches by nuthatch (Sitta europaea L.) population with a threshold distance. Their results indicated that the distances covered by dispersing nuthatches led to successful colonization. However, it should be noted that the cost of the experimental method is typically high as they normally need a large number of sampling sites and a long period of observation.
The model simulation method, which can abstract and simplify the ecological processes with limited data, can overcome the limitations of experimental methods to a certain extent. The simulation models now play a significant role in the ecological connectivity research. Martensen (2008) built a model to explain the occurrence of understory birds in a fragmented Atlantic Rainforest landscape, and found that species richness, abundance and compositional variation were mainly affected by connectivity. Hanski and Ovaskainen (2000) introduced the meta-population capacity for highly fragmented landscape and applied it to an empirical case on multiple networks occupied by an endangered species of butterfly. Kong and Yin (2008) identified the potential corridors in Jinan city using the least-cost path method and ecological networks based on the gravity model and landscape index. Levin et al. (2007) analyzed the landscape connectivity at multiple spatial scales with the revised minimal cost distance model and affirmed the value of open areas in ecological protection.
The traditional landscape indices, including connectivity index (CI), fractal dimension index, patch cohesion index, splitting index, usually are able to reflect the landscape structure connectivity to a certain degree (Mcgarigal et al., 2002). Recently, a few new indices have been developed on the basis of experiment and model simulation. These new indices reflect both the structural and functional connectivity synthetically and simplify the previous approaches of ecological connectivity substantially. Neel (2008) evaluated the influence of connectivity on the gene flow with the landscape indices. They found that the connectivity at the specific scales remained sufficient to provide a relatively promising outlook for species persistence on the condition that the total network connectivity would be reduced. Cook et al., (2002) used the landscape indices to assess the ecological network in Phoenix and the analysis showed that notable improvement in ecological value could be achieved by implementing a planning strategy for open space systems. Mallarach and Marull (2006) adopted the ecological connectivity index (ECI) to evaluate the landscape in central Barcelona and identified the important areas for local landscape. Saura and Pascual-Hortal (2007) systematically compared a set of graph-based connectivity indices and presented the integral index of connectivity (IIC) and probability of connectivity (PC) to assess the landscape connectivity. They considered that both IIC and PC were effective applications in the landscape plan. Xiong et al., (2008) used the IIC and PC to evaluate the connectivity on lawn landscapes in the metropolitan region of Chongqing city. They found that these indices can catch the change of landscape dynamic directly or indirectly and recognize the importance of connectivity at different scales. However, they also pointed out that there were some defects in these indices. For example, the values IIC and PC increase or decrease with the remove of isolated or connected patch and both IIC and PC are not sensitive to the effect of matrix and corridors. As for the CI and ECI, the cell size affects the results and the ECI is not sensitive to the carrying capacity and the rank of the source.

1.2 Land consolidation in China

Land consolidation practices in China can be traced back to 1066 B.C. and the modern land consolidation actually started in the mid- to late 1990s. With more than ten years’ development, land consolidation has increased the quantity and quality of farmland, promoted the farmland protection forcefully and improved agricultural productivity effectively. However, because all the land consolidation has been conducted through engineering and biological measures, it has the strong potential to change land use and the environment. Therefore, great attentions have been paid to its dual influence on the landscape pattern and ecosystem in recent years (Rafael et al., 2002; Anka and Marina, 2005; Sklenicka, 2006; Wang et al., 2011).
According to the Guideline of General Land Use Planning (2006-2020) developed by the Ministry of Land and Resources of China, about 5% of the national land areas will be consolidated in 15 years (Wang et al., 2011). It can be predicted that the land consolidation will promote the mandatory farmland protection and improve the agricultural productivity substantially in the future. However, such land consolidation will produce large impacts on landscape patterns and ecosystems. Some negative impacts may emerge due to the contradictions between ecological protections and economic benefits. To achieve a better understanding of the impacts of land consolidation on landscape pattern and ecosystem, we adopt the revised ecological connectivity index to analyze the change of ecosystem service value and ecological connectivity in Da’an city, Jilin Province of China. Based on this case study, we put forward some suggestions for land managers and policymakers to improve the connectivity of entire ecosystems during the process of land consolidation.

2 Materials and methods

2.1 Study area

Da’an city is located in the west area of Jilin Province in China. The land consolidation project of Da’an city is one of the major land consolidation projects. The study area has geographic coordinates approximately ranging between 123°16′00.6″E-124°15′16″E and 45°05′09.7″N-45°43′39.2″N (Figure 1), covering an area of 1202 km2. This area is also situated in the hinterland of Songnen Plain with vast open flat terrain. The region has a semi-arid continental monsoon climate in the north temperate zone with an average annual precipitation of 412.4 mm. Soils mainly consist of alluvial soil, bog soil, solonchak and solonetz. In addition, this area has a typical landscape with abundant cultivated land reserves and wetland resources. Landscapes can be classified as cultivated land, woodland, grassland, wetland (artificial and natural wetland), construction land and other land, according to the local landscape characteristics and the land use classification standard (GB/T 21010-2007) in China. The natural wetland consists of marshes, rivers, lakes and tidal flats while the artificial wetland includes reservoirs, ponds and ditches in this research. The land consolidation project in this area started in 2008 and will be finished by the end of 2014 according to the implementation program. Two maps in this area, the land use map of Da’an city in 2008 and the planned land use map in 2014, have been collected as the basic maps for the comparison of ecological connectivity index.
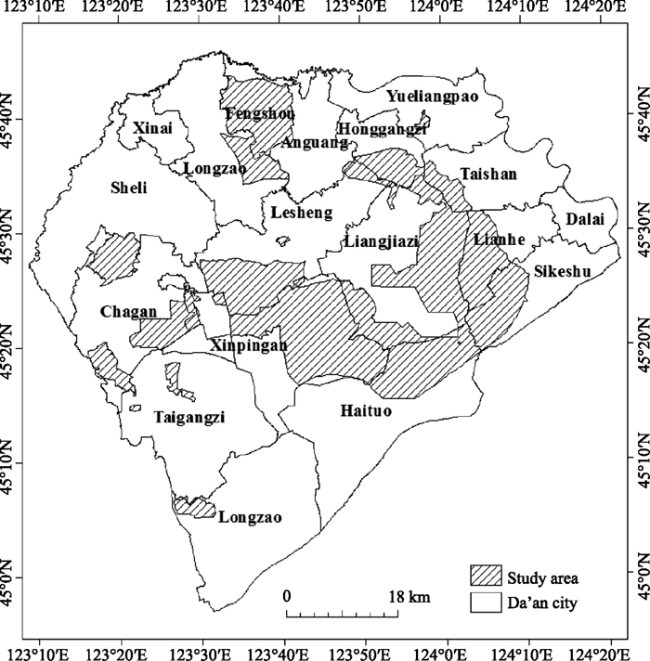
Figure 1 The geographic range of the study area

2.2 Methods

2.2.1 Ecosystem service evaluation
In this paper, we evaluated the ecosystem service following the approach of Tang et al., 2007. They developed the coefficients of ecosystem service value (ESV) for the hinterland of Songnen Plain. Based on their results, we classified the coefficients according to landscape types in our study area. Table 1 shows the coefficients in the study area. It is assumed that the ESV of the same landscape type remains unchanged during the period of land consolidation in this study.
Table 1 ESV coefficients in the study area (104 yuan ha‒1 yr‒1)
Landscape type Cultivated land Woodland Grassland Artificial
wetland
Natural wetland Construction land Other land
ESV 0.28 0.90 0.89 7.02 12.21 0.04 0.12
2.2.2 Revised ecological connectivity index
The ecological connectivity index was proposed by Mallarach and Marull (2006), which is defined as:
where Xi is the adapted cost-distance values in a pixel, Xmax and Xmin are the maximum and the minimum adapted cost-distance value in a given area. The ECI is based on the least-cost distance model in ArcGIS 9.3. The model is used to calculate the least accumulative cost distance for each cell to the nearest source over a cost surface. Two factors, the source and cost surface, are taken into account in this model. The source is a raster or feature dataset that identifies the cells or locations to which the least accumulated cost distance for each cell is calculated. The cost surface is a raster defining the impedance or cost to move through each cell. Usually, the source is identified and mapped by a serial of complex protocols and the surface is defined by the effect of barriers and potential affinity matrix in the study of landscape ecological connectivity in cities. While this method is able to assess the ecological connectivity in cities at large scale, it takes a long time to identify the source and the cost surface in the study area and some parameters may have to be assigned arbitrarily. In the consolidated area, the area with dense and continuous distribution of natural wetland is considered as the source based on the “source and sink” theory and ecosystem service value. The cost value in cost surface here is dependent on the ecosystem service value. The higher the ecosystem service value is, the easier the transmission among materials, energy and information is. The cost value is defined by the ecosystem service value as follows:
where CVi is the cost value in each cell of cost surface, ESVi is the ecosystem service value in each cell, ESVmax and ESVmin are the maximum and the minimum ecosystem service values in a given area. It should be pointed out that the relationship between Xi and ESVi is based on the cost distance algorithm, which is not able to be quantified by the simple expression. However, the adopted cost-distance (Xi) in a given area can be calculated by the least-cost distance model in Arcgis 9.3 after the identification of the source and the cost value (CVi) in cost surface. Therefore, the ECI can be calculated by putting the adopted cost-distance (Xi) into Formula (1).
Table 2 The reclassification of ECI by natural breaks
ECI Classification
1.00-1.87 Very low connectivity
1.87-2.62 Low connectivity
2.62-3.57 Medium connectivity
3.57-4.86 High connectivity
4.86-6.48 Very high connectivity
6.48-10 Highest connectivity
It is worth noting that ECI has a discrete distribution of values, with a range between 1 and 10. The ECI will be classified into six categories according to the method of natural breaks in ArcGIS 9.3. The very low, low, medium, high, very high and highest with values for each category are listed in Table 2.

3 Results

3.1 Changes of ecosystem service value

We first calculated LUCC during the process of land consolidation in the study area and the transition matrix is listed in Table 3. The results indicate that cultivated land will be increased to 68,407.06 ha in the late period of land consolidation, although a small part of the cultivated land will be consolidated into woodland, grassland and other types. This is highly relevant to the goal of land consolidation in China, which strongly aims at increasing cultivated land. Moreover, Table 3 indicates that the increased cultivated land is mainly due to the decrease of other land, grassland and wetland. Correspondingly, the areas of other land, grassland and wetland in the late stage of consolidation will be reduced by 78.82%, 70.79% and 35.82% respectively. The woodland and construction land will have a slight change in the late period of consolidation.
Table 3 The transition matrix of land use in land consolidation (ha)
2008 2014
Cultivated
Land
Woodland Grassland Artificial
wetland
Natural
wetland
Construction land Other land Total
Cultivated Land 17189.81 55.13 33.69 0.00 6.13 21.44 94.94 17401.14
Woodland 226.63 3093.13 12.25 0.00 0.00 3.06 18.38 3353.45
Grassland 31868.38 122.50 12571.56 3.06 796.25 159.25 1283.19 46804.19
Artificial wetland 1059.63 3.06 150.06 0.00 1757.88 0.00 2324.44 5295.07
Natural wetland 698.25 0.00 177.63 3929.19 52.06 0.00 107.19 4964.32
Construction land 208.25 0.00 27.56 0.00 0.00 2180.50 39.81 2456.12
Other land 34557.25 18.38 698.25 9.19 30.63 21.44 4587.63 39922.77
Total 85808.20 3292.20 13671.00 3941.44 2642.95 2385.69 8455.58 120197.06
Table 4 shows that land consolidation may have a negative influence on the ecosystem service value in the consolidated area. The total ESV will decrease by nearly 30% in the late period of land consolidation. In the meantime, total ESV of grassland and other land will decline by more than 70% compared to pre-land consolidation. The total ESV of wetland has decreased by 31,107.24×104 yuan in 2014. There is a slight decrease of total ESV of woodland as well as the construction land. The total ESV of cultivated land will have a value up to 19,153.98×104 yuan in 2014, which is almost quadruple of the total ESV in the early time of land consolidation. However, due to the fact that cultivated land is lower in ESV per unit than wetland and grassland, the increase of ESV resulting from the notable increase of cultivated land cannot compensate for the ESV loss associated with the decrease of the wetland and grassland. Therefore, the total ESV in the entire study area will reduce substantially in the late period of consolidation.
Table 4 The changes of ESV in land consolidation (104 yuan yr‒1)
Ecosystem categories ESV2008 ESV2014 Change Change (%)
Cultivated land 4872.32 24026.30 19153.98 393.12
Woodland 3018.11 2962.98 -55.13 -1.83
Grassland 41655.73 12167.19 -29488.54 -70.79
Artificial wetland 37171.39 18553.51 -18617.88 -50.09
Natural wetland 60614.35 48124.98 -12489.36 -20.60
Construction land 98.24 95.43 -2.82 -2.87
Other land 4790.73 1014.67 -3776.06 -78.82
Total 152220.87 106945.05 -45275.81 -29.74

3.2 Changes of ecological connectivity index

Figure 2 shows the distribution of ECI in the early and late period of land consolidation based on ESV. Landscapes with the highest connectivity are mainly located in the wetland and its surrounding areas. The high and very high connectivity landscapes accounting for small part of the entire area are often close to the sources. In contrast, the very low, low and medium connectivity landscapes are usually relatively far away from the sources. Actually, some transitional zones are found among different connectivity landscapes. The ecological connectivity indices trend to get decreased or increased there, causing changes in energy, material and information flows. It’s necessary to establish some buffer zones around the transitional zone covering the different landscapes.
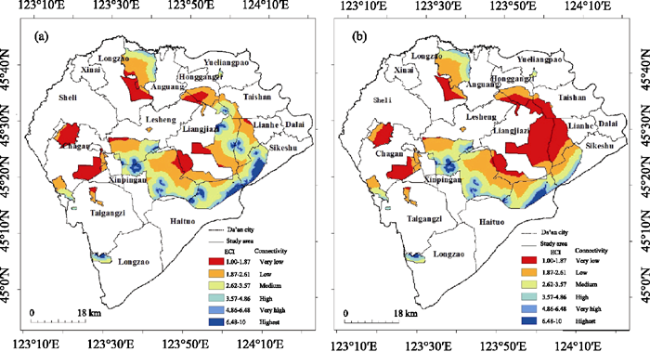
Figure 2 The distribution of ECI in the early and late period of land consolidation
Table 5 shows the transmutation among landscapes with different connectivity in 2008 and 2014. Landscapes with very low, low and medium connectivity would dominate most of the area both in the early and late stage of consolidation. As for each landscape category, area with very low connectivity in 2014 will be approximately twice as the area in 2008. But there is going to be nearly no change in the total area of low connectivity landscape at the end of consolidation. The medium connectivity landscape will be decreased by about 10,000 ha in the late stage of consolidation. Meanwhile, land consolidation has reduced the area of high and very high connectivity landscape by 3445.31 ha and 1316.88 ha respectively. Landscapes with the highest connectivity in this area will be also consolidated into the lower connectivity landscape. If there is no enough landscape with higher connectivity, the regular flows of the energy, materials and information may be influenced and the normal ecological processes and functions would be disturbed as well.
Table 5 The transition matrix of landscape with different connectivity in land consolidation (ha)
2008 2014
Very low Low Medium High Very high Highest Total Proportion (%)
Very low 16029.14 4863.25 0.00 0.00 0.00 0.00 20892.39 17.38
Low 10106.25 26729.50 1883.44 0.00 0.00 0.00 38719.19 32.21
Medium 8219.75 4930.63 20527.94 1904.88 52.06 45.94 35681.20 29.69
High 2835.88 1338.31 1748.69 8357.57 309.31 563.50 15153.26 12.61
Very high 842.19 269.50 526.75 318.50 1828.31 229.69 4014.94 3.34
Highest 652.31 287.88 992.25 1127.00 508.38 2168.26 5736.08 4.77
Total 38685.52 38419.07 25679.07 11707.95 2698.06 3007.39 120197.06 100.00
Proportion (%) 32.19 31.96 21.36 9.74 2.24 2.50 100.00
Figure 3 describes the distribution of ECI changes with different connectivity in the late stage of consolidation. The change of ECI can be summarized into three categories. In the first category, ECI increases at various degrees in the late period of consolidation, this may include the very low→low connectivity areas, medium→very high connectivity areas and medium→high connectivity areas. In the second category, ECI decreases at different degrees in the late stage of consolidation such as the very high→very low connectivity areas, medium→very low connectivity areas and medium→low connectivity areas. In the third category, ECI keeps unchanged in the late stage of consolidation. Most of the landscapes with ECI changes belong to the first two categories. Land consolidation can alter the ecological connectivity quickly and deeply in some areas, such as the medium→highest connectivity areas. The area of medium→highest connectivity indicates that the ecological connectivity has increased from medium to highest level in the late period of consolidation. The sharp increase of the ecological connectivity in the area of medium→highest connectivity may lead to the un-stability of the ecosystems. In some areas, e.g. highest→very low connectivity areas and very high→very low connectivity areas, the landscape with higher connectivity will disappear in the late stage of consolidation and be replaced by the lower connectivity one. Land consolidation in those areas may have a profound impact on the flows of energy, material and information in the ecosystems.
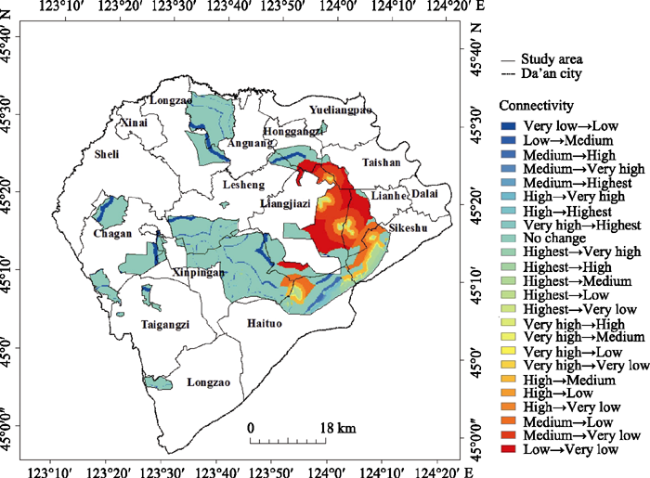
Figure 3 The distribution of ECI transmutations in the late period of land consolidation

3.3 Changes of land use in different connectivity landscapes

As shown in Table 6, landscape with very low ECI would increase to 17793.11 ha, while landscape with other ECI (with low-highest ECI) will decrease to various degrees by the end of 2014. Results also show that the landscape with medium ECI in the late stage of consolidation has reduced by 10002.12 ha, which is far more than the reduction of landscape with low, high, very high and highest ECI. The cultivated land in all types of ECI will increase to different degrees, in which the cultivated land with very low, low and medium ECI has dominated most part of the increase. There is a decrease in all types of ECI in grassland, which is very similar to the change of ECI in other land. ECI changes slightly in woodland, artificial wetland, natural wetland and construction land. However, it should be pointed out that the decrease of natural wetland with the highest ECI is far more than decrease of artificial wetland with other ECI.
Table 6 The changes of land use of different connectivity landscapes in the late period of consolidation (ha)
Very low Low Medium High Very high Highest
Cultivated land 26719.51 24497.95 11443.92 4792.69 773.18 179.81
Woodland -175.93 236.79 -33.40 -39.92 -10.76 -38.03
Grassland -4895.65 -12984.14 -9832.46 -4178.54 -1073.51 -168.89
Artificial wetland -57.11 -284.10 -408.18 -279.16 -135.54 -189.54
Natural wetland 16.10 11.99 -0.08 -16.93 58.15 -2390.60
Construction land 105.03 31.15 -78.82 -100.70 -20.63 -6.46
Other land -3918.84 -11809.75 -11093.10 -3622.75 -907.75 -115.00
Total 17793.11 -300.11 -10002.12 -3445.31 -1316.86 -2728.71

4 Conclusions and discussion

4.1 Conclusions

(1) Land consolidation could result in substantial LUCC in a short time by means of engineering and biological measures, which may result in important effects on the landscape structure and the ecosystem service value. In this study, some landscape types such as grassland will be changed from dual directions, including the transformation into other landscapes and vice versa. Such a change leads to the final changes of the landscape structure, in which the cultivated land will be increased substantially while the grassland, wetland and other land will be decreased. Meanwhile, the total ESV of cultivated land will be increased to 24,026.30×104 yuan and the total ESV of the grassland, wetland and other land will be reduced to 79,860.35×104 yuan in 2014.
(2) The changes of landscape structure and the ESV caused by land consolidation have influenced the ECI in the study area. The landscape with very low, low and medium ecological connectivity will dominate the entire area, about 80% in the early and 85% in the late period of land consolidation. In particular, most areas have relatively low connectivity pre-consolidation and this situation is getting worse rather than getting better in the late period of land consolidation. Also, land consolidation may reduce the coverage of landscape with higher connectivity.
(3) Like the changes of landscape structure, changes of landscape with different connectivity are the result of inter-transformation. The scopes and degrees of changes in various ecological connectivity landscapes can be identified by the least-cost distance and ecological connectivity index. Land consolidation may lead to the increase or decrease of ecological connectivity in some areas, e.g. the medium→highest connectivity areas and highest→very low connectivity areas, which were spatially related with the distribution of those areas with significant changes of ESV.

4.2 Discussion

(1) The main goal of increasing the quantity and quality of the cultivated land plays an important role in those changes of landscape structure and the ecosystem service value. However, because the cultivated land has lower ESV per unit area than the wetland and grassland, the increase of ESV results from the increase of cultivated land cannot compensate for the ESV loss led by the decrease of the wetland and grassland. These results indicate that land consolidation in Northeast China at present stage may have far-reaching impacts on the landscape structure and ecosystem functions. It is highly possible that the substantial increase of cultivated land with the decrease of wetland, woodland and grassland with higher ESV in the late stage of consolidation will affect the landscape diversity and the ecological functions in consolidated areas. Therefore, we suggest that land consolidation should target on improving the quality and ecosystem service value per unit area of the cultivated land but not sacrifice the much-needed wetland in China.
(2) Our results here indicate that current land consolidation practice may overly focus on the increasing of cultivated land and partly ignore the researches between the landscape pattern and ecological processes. In the future study, more attentions should be paid to the interaction mechanisms between the landscape pattern and ecological process, such as the soil quality and hydrologic process in consolidated areas. Meanwhile, some measures will be taken into consideration to improve the landscape connectivity in those consolidated areas. It is important to reconstruct the key landscape with the existing resources in consolidated areas to improve the ecological connectivity during the planning and designing of land consolidation. We suggest that an ecological compensation mechanism should be established for wetland loss, to increase the capital investment for the protection and restoration of habitats and biodiversity in wetland, and to introduce the public participation into the whole process of land consolidation planning. We should also strengthen the construction of ecological corridors and network for landscape with lower ecological connectivity, to create the protection ecological corridors along the least accumulated impendence surface. These corridors and networks should be established according to land suitability attaching the lower connectivity cultivated land with higher connectivity wetland.
(3) Our study also demonstrated that the revised ecological connectivity index can be used to identify areas with high or low ECI effectively. The revised ecological connectivity index may be still effective even if we do not have accurate evaluation on the ecosystem service value for some specific areas. At the same time, we should note that: (1) ESV is used to estimate the impact of land consolidation, with the assumption that the ESV per unit area of the same landscape remains unchanged during the process of land consolidation and the total ESV is fully dependent on the area of each landscape type. In reality, ESV per unit area varies even within the same landscape at the same place due to the engineering and biological measures of land consolidation. (2) Although the revised ecological connectivity index here is able to recognize the importance of connectivity at a large scale and landscape dynamics, it considers little regarding the carrying capacity of the sources. The suitable ECI seems to be varying in different scales and ecological processes, and the relationship between ECI and different scales should be studied further, especially with the large-scale specific ecological process.

The authors have declared that no competing interests exist.

1
Ai D, Zhu D L, Hao X X, 2007. The relationship of land consolidation and bio-environmental rehabilitation.Ecology and Environment, 16(1): 257-263. (in Chinese)

2
Anka L, Marina P, 2005. Conservation of natural ecosystems by land consolidation in the rural landscape.Acta Agriculturae Slovenica, 85(1): 73-82.

3
Bowne D R, Bowers M A, Hines J E, 2006. Connectivity in an agricultural landscape as reflected by interpond movements of a freshwater turtle.Conservation Biology, 20(3): 780-791.

4
Chen D J, Wang Z Y, Qu C Xet al., 2008. A primary discussion on the application of ecological footprint for environmental impact assessment of land consolidation planning.Chinese Agricultural Science Bulletin, 24(9): 444-447. (in Chinese)

5
Cook E A, 2002. Landscape structure indices for assessing urban ecological networks.Landscape and Urban Planning, 58(3/4): 269-280.

6
Davenport D W, Breshears B P, Wilcox C Det al., 1998. Sustainability of Pifion-Juniper ecosystems: A unifying perspective of soil erosion thresholds.Journal of Range Management, 51(2): 231-240.

7
Ferreras P, 2001. Landscape structure and asymmetrical inter-patch connectivity in a metapopulation of the endangered Iberian lynx. Biological Conservation, 100(1): 125-136.

8
Fu W, Liu S L, Cui B Set al., 2009. A review on ecological connectivity in landscape ecology.Acta Ecologica Sinica, 29(11): 6174-6181. (in Chinese)

9
Gillis E A, Krebs C J, 2003. Survival of dispersing versus philopatric juvenile snowshoe hares: Do dispersers die?Oikos, 90(2): 343-346.

10
Gu X K, Chen B M, 2008. Method and application of landscape ecological evaluation of land consolidation: A case of land consolidation project in Jianghan Plain.China Land Science, 22(12): 58-62. (in Chinese)

11
Hanski I, Ovaskainen O, 2000. The metapopulation capacity of a fragmented landscape.Nature, 404(6779): 755-758.

12
Jordan F, Baldi A, Orci K Met al., 2003. Characterizing the importance of habitat patches and corridors in maintaining the landscape connectivity of a Pholidoptera transsylvanica (Orthoptera) metapopulation. Landscape Ecology, 18(1): 83-92.

13
Kong F H, Yin H W, 2008. Developing green space ecological networks in Jinan City.Acta Ecologica Sinica, 28(4): 42-52. (in Chinese)

14
Langevelde F, 2000. Scale of habitat connectivity and colonization in fragmented nuthatch populations.Ecography, 23: 614-622.

15
Levin N, Lahav H, Ramon Uet al., 2007. Landscape continuity analysis: A new approach to conservation planning in Israel.Landscape and Urban Planning, 79(1): 53-64.

16
Liu Y, Wu C F, Yue W Zet al., 2008. Evaluation of ecological effect and landscape pattern in land consolidation project.Acta Ecologica Sinica, 28(5): 2261-2269. (in Chinese)

17
Lucia P H, Saura S, 2006. Comparison and development of new graph-based landscape connectivity indices: Towards the priorization of habitat patches and corridors for conservation.Landscape Ecology, 21(7): 959-967.

18
Luo M, Zhang H Y, 2002. Land consolidation and its ecological and environmental impacts.Resources Science, 24(2): 60-63. (in Chinese)

19
Mallarach J M, Marull J, 2006. Impact assessment of ecological connectivity at the regional level: Recent developments in the Barcelona Metropolitan Area.Impact Assessment and Project Appraisal, 24(2): 127-137.

20
Martensen A C, Pimentel R G, Metzger J P, 2008. Relative effects of fragment size and connectivity on bird community in the Atlantic Rain Forest: Implications for conservation.Biological Conservation, 141(9): 2184-2192.

21
Mcgarigal K, Cushman S A, Neel M Cet al., 2002. FRAGSTATS: Spatial pattern analysis program for categorical maps. Amherst: University of Massachusetts.

22
Neel M C, 2008. Patch connectivity and genetic diversity conservation in the federally endangered and narrowly endemic plant species Astragalus albens (Fabaceae). Biological Conservation, 141(4): 938-955.

23
Niu C J, Jia F F, Ma H Xet al., 2008. Analysis on the regional eco-environmental impact of land Consolidation.Research of Soil and Water Conservation, 15(1): 193-196. (in Chinese)

24
Ou Y Y, Liu X H, 2009. Eco-environment impact assessment on land consolidation based on entropy-weighted matter-element model: A case study of the land consolidation project in Menglou Town, Laohekou City. Journal of Southwest China Normal University (Natural Science Edition), 34(6): 67-73. (in Chinese)

25
Pasakarnis G, Maliene V, 2010. Towards sustainable rural development in Central and Eastern Europe: Applying land consolidation.Land Use Policy, 27(2): 545-549.

26
Philippe C, Burel F, 1997. The role of spatial temporal patch connectivity at the landscape level: An example in a bird distribution.Landscape and Urban Planning, 38: 37-43.

27
Rafael C, Carlos A, Urbano F, 2002. Economic, social and environmental impact of land consolidation in Galicia.Land Use Policy, 19(2): 135-147.

28
Saura S, Pascual-Hortal L, 2007. A new habitat availability index to integrate connectivity in landscape conservation planning: Comparison with existing indices and application to a case study.Landscape and Urban Planning, 83(2/3): 91-103.

29
Sklenicka P, 2006. Applying evaluation criteria for the land consolidation effect to three contrasting study areas in the Czech Republic.Land Use Policy, 23: 502-510.

30
Sun X B, Liu H Y, 2010. Optimization of wetland landscape patterns based on ecological function evaluation: A case study on the coastal wetlands of Yancheng, Jiangsu Province.Acta Ecologica Sinica, 30(5): 1157-1166. (in Chinese)

31
Tang J, Si A, Lu Yet al., 2007. The effects of land use change on the ecosystem service value in the hinterland of Songnen plain.Agricultural Research in the Arid Areas, 25(4): 30-35. (in Chinese)

32
Taylor P D, Fahrig L, Henein Ket al., 1993. Connectivity is a vital element of landscape structure.Oikos, 68(3): 571-573.

33
Timothy S H, 2004. Using measures of cost distance in the estimation of polity boundaries in the Postclassic Yautepec valley, Mexico.Journal of Archaeological Science, 31(6): 799-814.

34
Wang J, Li Z, Bai Z Ket al., 2011. Progress and prospect of ecological environment impact of land consolidation.Transactions of the CSAE, 27(Supp.1): 340-345. (in Chinese)

35
Wang J, Qiu Y, Yang Let al., 2007. Landscape effect analysis of land consolidation using GIS.Geographical Research, 26(2): 258-264. (in Chinese)

36
Wang W M, Zhang Y, 2004. Land consolidation and sustainable development.China Population, Resources and Environment, 14(1): 13-18. (in Chinese)

37
Wu X H, Tang D S, Fu G H, 2008. Effects of regional land consolidation on ecosystem services values: A case of Jiawang County Xuzhou City.Urban Studies, 15(4):36-41. (in Chinese)

38
Xiong C N, Wei H, Lan M J, 2008. Analysis of connectivity on green land landscape in metropolitan region of Chongqing City. Acta Ecologica Sinica, 28(5): 2237-2244. (in Chinese)

39
Yu G M, Lu D, Lin X Wet al., 2008. On the assessment methodology of natural ecological compensation for land consolidation planning.Ecology and Environment, 17(4): 1702-1706. (in Chinese)

40
Yu W H, Zang S Y, Wu C Set al., 2011. Analyzing and modeling land use land cover change (LUCC) in the Daqing City, China.Applied Geography, 31: 600-608. (in Chinese)

41
Yun W J, Yang X Y, Shi Y, 2008. Science definition of land consolidation.Resources and Industries, 10(5): 1-2. (in Chinese)

42
Zhang Z F, 2008. Estimation of gains and losses of ecosystem services value with land consolidation.Transactions of the CSAE, 24(9): 69-72. (in Chinese)

43
Zhang Z F, Zhao W, 2007. Effects of land consolidation on ecological environment.Transactions of the CSAE, 23(8): 281-285. (in Chinese)

Outlines

/