Orginal Article

Spatially precise reconstruction of cropland areas in Heilongjiang Province, northeast China during 1900-1910

  • ZHANG Lijuan , 1 ,
  • JIANG Lanqi 1 ,
  • ZHANG Xuezhen , 2, 3, *
Expand
  • 1. Key Laboratory of Remote Sensing Monitoring of Geographic Environment, Harbin Normal University, Harbin 150025, China
  • 2. Key Laboratory of Land Surface Pattern and Simulation, Institute of Geographic Sciences and Natural Resources Research, CAS, Beijing 100101, China
  • 3. Jiangsu Collaborative Innovation Center for Climate Change, Nanjing 210093, China

*Corresponding author: Zhang Xuezhen (1981-), PhD, E-mail:

Author: Zhang Lijuan (1965-), PhD and Professor, specializing in studies of changes in land use and land cover. E-mail:

Received date: 2014-10-15

  Accepted date: 2014-12-25

  Online published: 2015-05-15

Supported by

National Natural Science Foundation of China, No.42171217;No.41471171

Copyright

Journal of Geographical Sciences, All Rights Reserved

Abstract

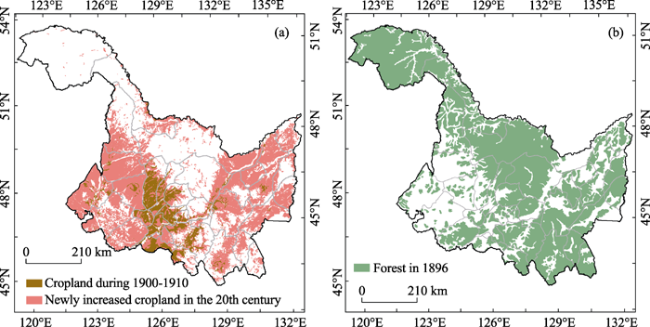
It is necessary to reconstruct past changes in land use and land cover to understand the historical effects of humans on climate and the local environment. We collected information from historical documents on the cropland area at the county level for Heilongjiang Province, northeast China during 1900-1910. The original records from different historical documents were calibrated with each other. We then defined an agricultural suitability index quantified by the distance from settlements, the slope and complexity of the topography, and the distance from rivers. Following the order of the agricultural suitability index from high to low values, the documented areas of cropland at the county level were then allocated into 1 km × 1 km cells. The area of cropland in 2009 was then retrieved from Landsat ETM+ images and compared with the areas of cropland during 1900-1910 to determine the human-induced changes in land use and land cover. In this period, the total area of cropland was about 25,397 km2 and this mainly occurred in the mid-southern part of Heilongjiang, in particular the six counties of Hailun, Bayan, Wuchang, Hulan, Shuangcheng and Wangkui. In 2009, the total area of cropland had increased to about 163,808 km2 and had spread over the southwestern part to the central and northeastern parts of Heilongjiang. The area of cropland had therefore increased by about 138,411 km2 during the 20th century. The proportion of land used as cropland increased from about 5.6% during 1900-1910 to about 36.2% in 2009, indicating that about 30.6% of the natural land surface in Heilongjiang was replaced by cropland. A total of about 44% (60,962 km2) of the cropland was converted from forest, mainly on the western edge and in the northeastern part of the present-day agricultural area. These areas of cropland reconstructed from historical records for the period 1900-1910 could be used as a basic data set to study the effects of agricultural development on climate and the local environment.

Cite this article

ZHANG Lijuan , JIANG Lanqi , ZHANG Xuezhen . Spatially precise reconstruction of cropland areas in Heilongjiang Province, northeast China during 1900-1910[J]. Journal of Geographical Sciences, 2015 , 25(5) : 592 -602 . DOI: 10.1007/s11442-015-1189-4

1 Introduction

Agricultural development is the main human activity that modifies the land surface (Godfray et al., 2010; Goldewijk et al., 2011). As a result of agricultural development, the naturally occurring vegetation (e.g. woodlands, grasslands and swamps) is converted into cropland. The surface energy balance and the partition of the net surface radiation between latent heat and sensible heat are determined by the properties of the land surface and therefore changes in land cover may have important implications for the climate (Houghton et al., 2012; Mahmood et al., 2014). The global climate implications of changes in land cover are controversial, however it is generally accepted that changes in land cover may regulate the climate at the local or regional level as important as CO2 emissions from burning fossil fuels (Forster et al., 2007; Findell et al., 2009). It is therefore valuable to study the local and regional climatic effects of changes in land cover to help in understanding the dynamics of climate change.
To improve our understanding of the climatic effects of changes in land cover, it is necessary to reconstruct historical changes in land use. There have been a number of reconstructions of historical changes in land cover (e.g. Goldewijk et al., 2011). Among these reconstructions, two have been used extensively. One data set was released by the Center for Sustainability and the Global Environment (SAGE), University of Wisconsin, USA (Ramankutty and Foley, 1999, 2010). The SAGE data set was created using national level cropland areas from 1992 inventories to calibrate the satellite-based DISCover data set to give spatially precise and accurate quantitative areas of cropland. Keeping the relative spatial weights unchanged, the historical national level cropland area was then allocated into grid cells (Ramankutty and Foley, 1999). A static spatial pattern during past centuries is unlikely to be a reasonable model for northeast China because this region has undergone tremendous development since the mid-19th century and the spatial weights of cropland in the past are therefore much lower than at the present time (Ye et al., 2009; Li et al., 2010).
The other data set, the Historical Database of the Global Environment (HYDE) was released by the Institute of Public Health and Environment, Netherlands Environmental Assessment Agency (Goldewijk, 2001; Goldewijk et al., 2011). The latest HYDE data set (version 3.1) was created by using the contemporary population and the per capita cropland area for the period before 1960 to estimate the national cropland area; the national cropland area was then allocated into 5'×5' (latitude/longitude) grid cells. The national cropland area was allocated into grid cells using a mix of two weighting maps: (1) a current map, which was retrieved from a satellite map for the year 2000 (Goldewijk and Drecht, 2006); and (2) a historical map, constructed based on six rules by considering the effects on agricultural activities of population density, temperature, the suitability of the land for crops, the distance to water, the surface slope and city development (Goldewijk et al., 2011). Such a spatial allocation might be more reasonable for historical times than the SAGE method. However, the HYDE data set for northeast China still has large uncertainties because the national total area of cropland was estimated using a static per capita cropland area the same as that in the mid-20th century, rather than the essential cropland area (Li et al., 2010). There are also some published reconstructions specific to northeast China. Ye et al. (2009) estimated the area of cropland for each county with an interval of 50-100 years for the last 300 years using local historical documents. As a result of using local records and the experience of historians to translate these historical records, this estimation has a lower uncertainty than previously published work. Li et al. (2010) allocated this reconstruction into a 1°×1° grid cell using the area weighting method. However, such a spatial resolution is probably too coarse for Heilongjiang Province.
The work reported here aimed to create a high-resolution data set for the area of cropland in Heilongjiang during 1900-1910. We used local historical documents to estimate the area of cropland at the county level and then allocated this cropland area into grid cells of 1 km × 1 km. By comparing the spatial distribution of cropland in this period with that in 2009, we revealed the changes in land cover resulting from agricultural development during the 20th century. This resulted in a high-quality data set for use in studying the effects of changes in land cover on the regional environment and climate.

2 Data and methods

2.1 Study area

The study area was located in Heilongjiang Province between 42°30′-51°20′N and 121°40′-128°30′E in northeast China, covering an area of about 4.54 × 10⁵ km2 (approximately 4.7% of China’s total; Figure 1). The Songnen Plain in the west and the Sanjiang Plain in the northeast are two of the principal regions of agricultural production in China. The climate in Heilongjiang Province is dominated by the East Asian monsoon. The summers are hot and moist and the winters are cold and dry. The annual average temperature ranges from -4 to 5°C from north to south and the annual precipitation ranges from 400 to 700 mm from west to east.
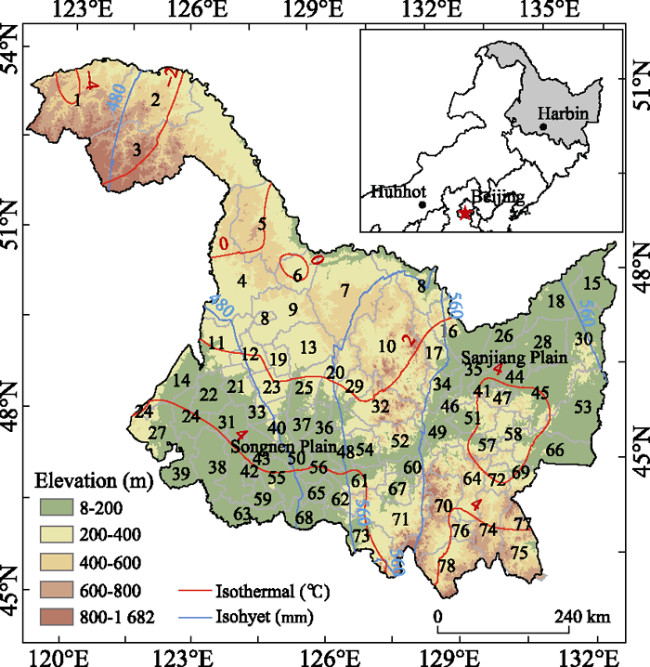
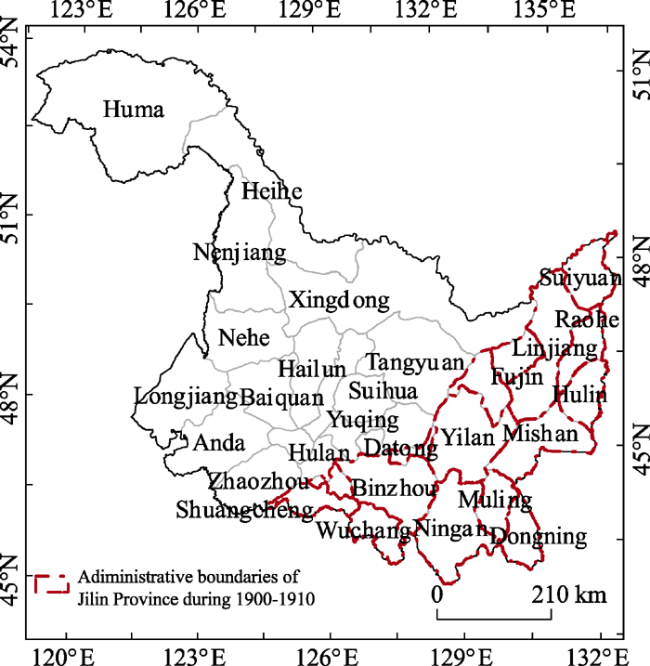
Figure 1 Location of Heilongjiang Province and the distribution of counties

Counties: 1=Mohe, 2=Tahe, 3=Huma, 4=Nenjiang, 5=Heihe, 6=Sunwu, 7=Xunke, 8=Jiayin, 9=Wudalianchi, 10=Yichun, 11=Nehe, 12=Keshan, 13=Bei’an, 14=Gannan, 15=Fuyuan, 16=Luobei, 17=Hegang, 18=Tongjiang, 19=Kedong, 20=Suiling, 21=Yi’an, 22=Fuyu, 23=Baiquan, 24=Qiqihar, 25=Hailun, 26=Suibin, 27=Longjiang, 28=Fujin, 29=Qing’an, 30=Raohe, 31=Lindian, 32=Tieli, 33=Mingshui, 34=Tangyuan, 35=Huachuan, 36=Suihua, 37=Wangkui, 38=Durbete, 39=Tailai, 40=Qinggang, 41=Jixian, 42=Daqing, 43=Anda, 44=Youyi, 45=Baoqing, 46=Jiamusi, 47=Shuangyashan, 48=Bayan, 49=Yilan, 50=Lanxi, 51=Huanan, 52=Tonghe, 53=Hulin, 54=Mulan, 55=Zhaodong, 56=Hulan, 57=Boli, 58=Qitaihe, 59=Zhaozhou, 60=Fangzheng, 61=Binxian, 62=Acheng, 63=Zhaoyuan, 64=Linkou, 65=Harbin, 66=Mishan, 67=Yanshou, 68=Shuangcheng, 69=Jidong, 70=Hailin, 71=Shangzhi, 72=Jixi, 73=Wuchang, 74=Muling, 75=Dongning, 76=Mudanjiang, 77=Suifenhe, 78=Ning’an

2.2 Data sources

2.2.1 Cropland data
The cropland area data were compiled from local historical documents. For the period 1900-1910, the cropland area data were compiled from the Survey Report of Manchurian Railway (LPA, 2008) and Local Gazette of Manchu-Mongolia (CSMR, 1923). The Survey Report of Manchurian Railway is based on a field survey conducted by the Survey Department of the South Manchuria Railway Company in the period 1909-1925. The third section of the fifth volume of this report records the conditions of society, including the sub-provincial cropland area, for the 34th year of Emperor Guangxu’s reign (1908)The Local Gazette of Manchu-Mongolia, which was published in 1918, records the area’s natural resources, including the sub-provincial cropland area of three provinces of northeast China during 1900-1910. The two sources partly overlapped with one other and could therefore be compared.
2.2.2 Population and settlement data
This study used population data taken from the Local Gazette of Heilongjiang (Wan et al., 1992) and the Local Gazette of Jilin Province (CCCJP, 1992) for the period 1900-1910. The Local Gazette of Heilongjiang records the population of the 39 counties of Heilongjiang from the 33rd year of Emperor Guangxu’s reign (1907) to the 7th year of the Republic of China (1918). The Local Gazette of Jilin Province records the population of each county in Jilin Province from the 10th year of Emperor Shunzhi’s reign (1653) to 1985, including the time slice for 1910.
We also used historical distribution data for the settlements. For the period 1900-1910, the spatial distribution of settlements in Heilongjiang was taken from the 8th volume of the Atlas of Historical Geography (Tan, 1987); the spatial distribution of settlements in Jilin was taken from Zeng et al. (2011).
2.2.3 Supporting geographical data
In addition to the cropland and population data, we also used supporting geographical data, including a map of forests in Heilongjiang (Li, 1993), the spatial distribution of wetlands and lakes in the 1950s, surface elevation data and present day rivers. The map of forests in Heilongjiang shows the types of forest and their spatial distribution in 1896 and has a scale of 1:300,000. The spatial distribution of wetlands and lakes in the 1950s was taken from a map (1:300,000) of land use in northeastern China created by the Economics Section of the Institute of Geography, Chinese Academy of Sciences (Sun, 1959). The surface elevation data were taken from the Bureau of Survey and Geoinformation of Heilongjiang Province and had a spatial resolution of 90 m. The distribution of rivers was taken from the National Geomatics Center of China (2012).

2.3 Method for the spatial allocation of cropland during 1900-1910

To create a spatially precise cropland data set for the period 1900-1910, we estimated the area of cropland in each county and then allocated the area of cropland to spatially precise grid cells of 1 km × 1 km.
2.3.1 Estimation of cropland area at the county level
The historical documents generally record the cropland area at the county level. As the administrative boundaries have significantly changed over the last century, it is necessary to locate the historical records in the contemporary counties. Figure 2 shows the distribution of counties during 1900-1910. There were 35 counties in total, 17 of which were governed by Jilin in this period.
Figure 2 Boundaries of counties in Heilongjiang Province during 1900-1910
The area of cropland recorded in the historical documents used local traditional units - for instance, the units of cropland area in the Survey of Manchurian Railway (LPA, 2008) and Local Gazette of Manchu-Mongolia (CSMR, 1923) are Shang and Tiandi, respectively. In this study, we used units of square kilometers (km2). Table 1 gives the conversion ratios between these traditional units and km2.
The areas of cropland for 20 counties during 1900-1910 were derived directly from the Survey Report of Manchurian Railway (LPA, 2008). As these records were derived from field surveys they have a high level of confidence. The areas of cropland for 34 counties during 1900-1910 were derived with calibration from the Local Gazette of Manchu-Mongolia (CS MR, 1923). The calibration was performed by regressing the area of cropland at the county level from the Survey Report of Manchurian Railway (LPA, 2008) against that from the Local Gazette of Manchu-Mongolia (CSMR, 1923). The calibration was carried out for both Heilongjiang and Jilin provinces, for which there are 11 and seven samples, respectively (Figure 3a). We found that there was a strong correlation between these two reports, with common variances of 75% in Jilin Province and 99% in Heilongjiang Province. In addition, there are two coun- ties that were not recorded by either of these two documents. We estimated the area of cropland based on the population by regressing the area of cropland at the county level against population (Figure 3b). The area of cropland was strongly correlated with the population with a common variance of 84% in Heilongjiang.
Table 1 Conversion ratios among the area units
Region Shang (晌) Tiandi (天地) Qingmu (清亩) Biaozhunmu (标准清亩) Mu
(现代亩)
km2 Reference
Heilongjiang
Province
1 12 14.4 13.271 8.8×10⁻³ Ye et al. (2009)
Jilin Province 1 10 12 11.059 7.4×10⁻³ Ye et al. (2009)
Three provinces of northeast China 1 6.114×10⁻³ Li et al. (2005)
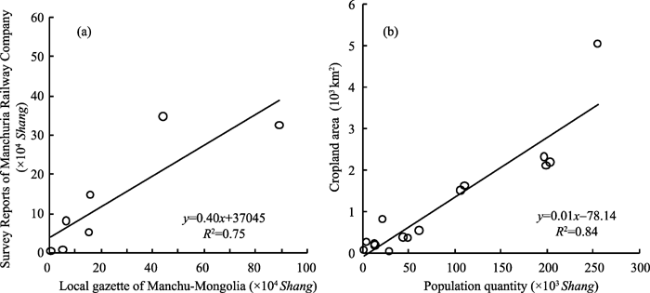
Figure 3 Linear regression of cropland areas from Liaoning Provincial Archives (2008) against cropland areas from Local Gazette of Manchu-Mongolia (Course on the Survey of Manchurian Railway, 1923) (a) and linear regression of cropland areas against population in Heilongjiang Province during 1900-1910 (b)
2.3.2 Allocation of cropland area at the county level into grid cells
To determine the spatial distribution of cropland within one county, we quantified the agricultural suitability of each 1 km × 1 km grid cell. We quantified the agricultural suitability only within the potential area of cultivation, excluding the forests, wetlands, rivers, lakes and mountains. We defined mountains as elevations higher than 200 m and slope greater than 3°. Following the order of the agricultural suitability index from high to low, we assigned the area of cropland cell by cell. The assignation continued until all the cropland area had been allocated. The agricultural suitability index is quantified as in Eq. (1):
where R is the agricultural suitability index and α, β and γ represent the human dimension factor, the water resource factor and the topography complexity factor, respectively.
To determine a, b and c, we used the broadly accepted analytical hierarchy process method. The analytical hierarchy process is a useful method for complex decision-making (Xu, 2009). We used a decision scale of 2 and the initial comparison matrix is given in Eq. (2):
The consistence ratio of Eq. (2) is 0.0518, which is <0.1 and thus implies that this matrix is effective. Using this matrix, we estimated that a, b and c were 0.490, 0.312 and 0.198, respectively. As a consequence, Eq. (1) can be given as:
2.3.3 Method of retrieving area of cropland in 2009
We retrieved the areas of cropland in 2009 at a spatial resolution of 1 km × 1 km with unsupervised classification using Landsat images. According to the National Land Classification (Trial) (MLR, PRC, 2001) and the land use practices of Heilongjiang, the types of land use are classified into seven categories: cropland, forest, grassland, water, urban/building land, unused land, and others. Following the Committee of Agriculture Divisions in China (1984), the retrieved cropland area was verified through a field survey. Among the 400 field survey points, 369 retrieved points were consistent with this field survey.

3 Results

3.1 Cropland area at the county level

Figure 4 shows the estimated fraction of cropland area and the per capita cropland area for each county of Heilongjiang during 1900-1910. The total area of arable land was about 25,397 km2, accounting for 5.61% of Heilongjiang in this period. Our estimation is similar to that of Ye et al. (2009), who estimated that 5.4% of Heilongjiang was arable land during 1900-1910. This estimated fraction of cropland area at the county level has a spatial pattern characterized by more cropland in the center of the province and less cropland in the surrounding areas. Hailun, Lanxi, Hulan, Bayan and Shuangcheng counties had a fraction of cropland area >25.9%, with a maximum of 53.8%. The area fraction of cropland decreased from the central area to the eastern and western margins. In the surrounding areas, the fraction of cropland area ranged between 0.7 and 5.2%, with a minimum of 0.7% in Nenjiang, Heihe and Mishan counties.
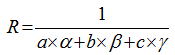
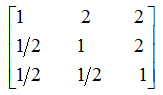
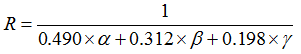
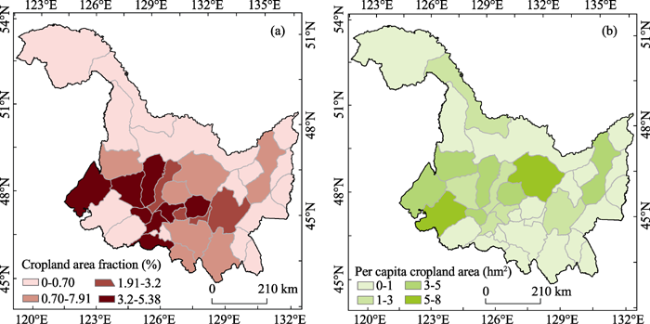
Figure 4 Cropland area fraction (a) and per capita cropland area (b) for each county in Heilongjiang Province during 1900-1910
The mean per capita cropland area of Heilongjiang during 1900-1910 was about 0.9 hm2, which is close to the 0.8 hm2 recorded by Xin et al. (1999). The per capita cropland area was spatially variable. In general, the per capita cropland area was high in the mid-southwestern part, but low in the southeastern and northwestern parts. The maximum per capita cropland area was about 8.2 hm2 in Tangyuan County and the minimum was about 0.1 hm2 in Zhaozhou County.

3.2 Spatial distribution of agricultural suitability index

Figure 5 shows the spatial distribution of the suitability of land for agricultural development at a cell size of 1 km × 1 km in Heilongjiang during 1900-1910. The agricultural suitability index had a linear distribution in Heilongjiang in this time period and the spatial pattern was closely related to routes of immigration and settlement. Immigrants moved northwards along the state highway from Liaoning Province to Jilin Province and finally settled in Heilongjiang during 1900-1910. In Heilongjiang, immigration progressed along the line from Shuangcheng county to Hulan county and then continued to Suihua, Hailun and Baiquan counties. Some migration occurred along the Nenjiang River from Jilin city and Bodune to the western part of Heilongjiang. Migrants also moved northwards along the Mudanjiang River to the Sanjiang Plain, Ussuri River Reach and Amur River Reach (Li and Shi, 1987). These routes correlate with the regions with a high agricultural suitability index (Figure 5).
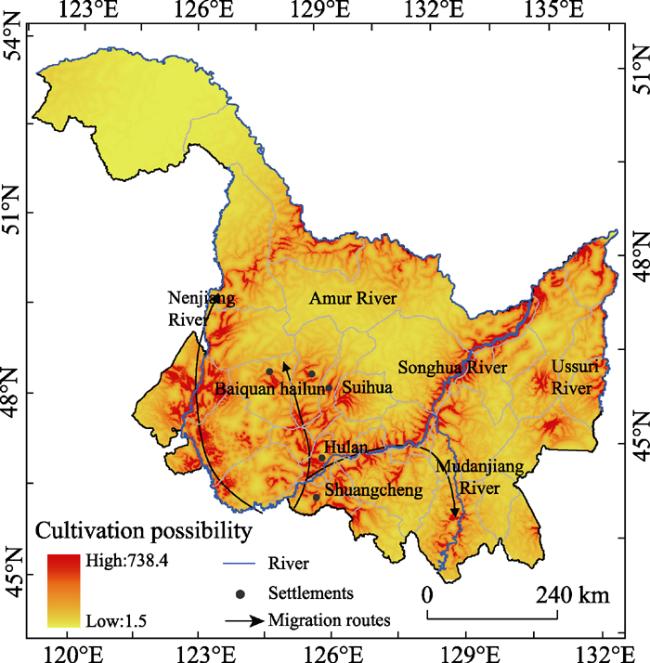
Figure 5 Suitability of agricultural development at a cell size of 1 km× 1 km in Heilongjiang Province during 1900-1910

3.3 Reconstruction of cropland based on grid cells

Figure 6 shows the reconstructed spatially precise areas of cropland for the period 1900-1910. Agricultural development mostly occurred in the central and western parts of Heilongjiang, particularly in the counties of Wangkui, Suihua, Bayan and Hulan. Other areas, especially the northern and eastern parts of the study area, were much less developed.
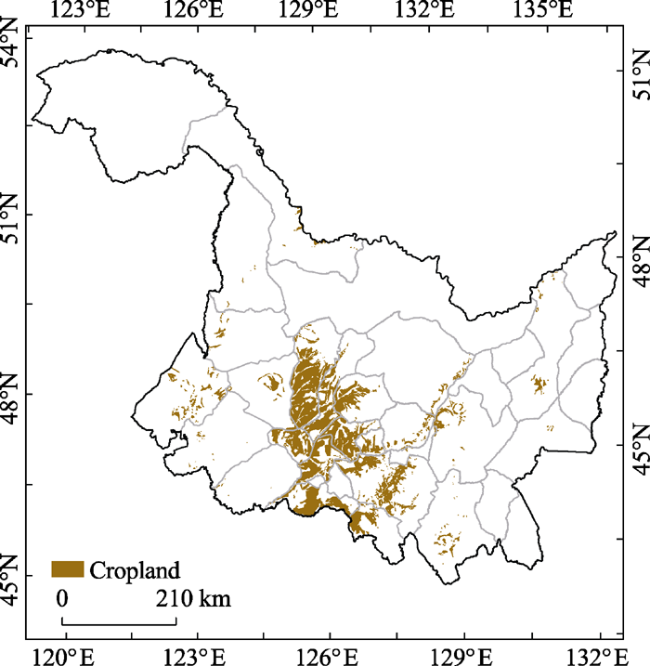
Figure 6 Reconstruction of spatial distribution of cropland during 1900-1910 at a cell size of 1 km × 1 km based on historical documents
Ye et al. (2009) have reported the spatial distribution of cropland at the county level based on the present county boundaries. To compare our results with those of Ye et al. (2009), we recalculated the fraction of cropland area at the county level based on the present counties using our reconstructed data. Table 2 shows that our estimation was in the same range of that of Ye et al. (2009) for 65 counties (83.3% of the total number of counties). Our estimation disagreed with that of Ye et al. (2009) for only 13 counties. The maximum difference was seen in Wangkui county; in this county our estimation was higher than that of Ye et al. (2009) by 40%.
The HYDE and SAGE data sets provide spatially precise global cropland data for the last 300 years. However, the quality of the HYDE and SAGE data sets is poor in northeast China (Li et al., 2010). We therefore did not further compare the results of this study with the HYDE and SAGE data sets.

3.4 Spatial features of agricultural development during the 20th century

Figure 7a shows the changes in the area of cropland from the early 20th century to 2009. The total area of cropland increased from about 25,397 km2 during 1900-1910 to about 163,808 km2 in the early 21st century. It is suggested that the area of cropland increased by about 5.5-fold in the 20th century. The increase in cropland area mainly occurred in the western (Nehe, Keshan, Yi’an, Baiquan and Qinggang counties) and the eastern (Suibin, Huachuan, Jixian and Youyi counties) parts of Heilongjiang.
Table 2 Modern county boundaries-based cropland area fraction during 1900-1910 from Ye et al. (2009) and this study
County R1 R2 County R1 R2 County R1 R2
Wangkui 0.66 0.2-0.6 Ning’an 0.04 0-0.05 Fujin 0.00 0-0.05
Bayan 0.63 0.1-0.2 Acheng 0.03 0-0.05 Daqing 0.00 0-0.05
Hailun 0.58 0.2-0.6 Mingshui 0.03 0-0.05 Lindian 0.00 0-0.05
Hulan 0.52 0.1-0.2 Zhaoyuan 0.03 0-0.05 Qitaihe 0.00 0-0.05
Suihua 0.49 0.2-0.6 Gannan 0.05 0.05-0.1 Dongning 0.00 0-0.05
Shuangcheng 0.46 0.1-0.2 Fangzheng 0.05 0.05-0.1 Wudalianchi 0.00 0-0.05
Lanxi 0.46 0.2-0.6 Nehe 0.03 0-0.05 Yichun 0.00 0-0.05
Binxian 0.31 0-0.05 Huachuan 0.02 0-0.05 Kedong 0.00 0-0.05
Mulan 0.26 0.2-0.6 Baoqing 0.02 0-0.05 Keshan 0.00 0-0.05
Harbin 0.26 0-0.05 Durbete 0.01 0-0.05 Youyi 0.00 0-0.05
Yanshou 0.20 0.1-0.2 Tangyuan 0.01 0-0.05 Shuangyashan 0.00 0-0.05
Wuchang 0.20 0.1-0.2 Huachuan 0.01 0-0.05 Huma 0.00 0-0.05
Qing’an 0.21 0.2-0.6 Sunwu 0.01 0-0.05 Jiayin 0.00 0-0.05
Suiling 0.20 0.2-0.6 Tongjiang 0.01 0-0.05 Tahe 0.00 0-0.05
Qinggang 0.15 0.1-0.2 Longjiang 0.01 0.05-0.1 Fuyuan 0.00 0-0.05
Yilan 0.13 0-0.05 Heihe 0.01 0-0.05 Mohe 0.00 0-0.05
Baiquan 0.12 0-0.05 Tailai 0.01 0-0.05 Muling 0.00 0-0.05
Shangzhi 0.11 0.1-0.2 Mudanjiang 0.00 0-0.05 Suibin 0.00 0-0.05
Jiamusi 0.11 0-0.05 Linkou 0.00 0-0.05 Suifenhe 0.00 0-0.05
Zhaodong 0.10 0-0.05 Mishan 0.00 0-0.05 Luobei 0.00 0-0.05
Fuyu 0.09 0.05-0.1 Hailin 0.00 0-0.05 Hulin 0.00 0-0.05
Bei’an 0.07 0.2-0.6 Nenjiang 0.00 0-0.05 Jixian 0.00 0-0.05
Qiqihar 0.06 0.05-0.1 Yi’an 0.00 0-0.05 Raohe 0.00 0-0.05
Tieli 0.06 0.2-0.6 Xunke 0.00 0-0.05 Jidong 0.00 0-0.05
Anda 0.05 0-0.05 Zhaozhou 0.00 0-0.05 Jixi 0.00 0-0.05
Tonghe 0.04 0-0.05 Boli 0.00 0-0.05 Hegang 0.00 0-0.05

Note: R1 represents the cultivation rate in this study and R2 represents the cultivation rate of Ye et al. (2009).

Figure 7 Area of cropland during 1900-1910 and in 2009 (based on Landsat ETM+ images) (a) and the spatial distribution of forest in 1896 (Li, 1993) (b)
By overlaying the cropland with the distribution of forest in 1896 (Figure 7b; Li, 1993), it is estimated that about 60,962 km2 of cropland were converted from woodland. This conversion accounts for about 44% of the newly converted cropland area which mainly occurred in the eastern part of Heilongjiang.

4 Conclusions

Using local historical documents, we studied the changes in land use and land cover resulting from agricultural development in Heilongjiang Province during the 20th century and found that this province underwent tremendous agricultural development in this period. The major conclusions are as follows.
(1) Agricultural development is characterized by a 5.5-fold increase in the total area of cropland from about 25,397 km2 in the early 20th century to about 163,808 km2 in the early 21st century and a corresponding increase in the fraction of cropland area from 5.6% to 36.2%.
(2) There is large spatial variability in the area of cropland. Newly developed cropland mostly occurred in the eastern and western parts of Heilongjiang, whereas the cropland in the central part had already been developed by the period 1900-1910.
(3) In the eastern part of Heilongjiang, the newly developed cropland was mostly derived from deforestation and this type of conversion accounted for about 44% of the total area of new cropland.

5 Discussion

This spatially precise reconstruction of cropland was based on local historical documents and estimation of the local suitability of land for agriculture by considering multiple factors. This reconstruction not only confirms the estimations at the county level reported by Ye et al. (2009), but also presents a high-resolution grid data set. This data set could be used as primary data to study the effects of human-induced changes in land cover on the land surface heat and moisture flux and thus on the regional changes in climate over the last century.
Nevertheless, there are several relevant issues to be considered. The conversion of the unit of area from the old units to square kilometers is a difficult issue in historical geography. In this study, we used the conversion ratio reported by Ye et al. (2009); however, although much historical evidence was used by Ye et al. (2009), more is needed to verify these conversion ratios. In addition, the potential cultivation area was estimated by excluding forests, wetlands, rivers, lakes and mountains. As these geographical features did not co-occur temporally with the historical cropland, the estimated area of cultivation might have uncertainties. It should also be noted that ‘2’ was used as the decision scale in the analytical hierarchy process model. This value still required better verification.

The authors have declared that no competing interests exist.

1
Compiling Committee of Chorography in Jilin Province (CCCJP), 1992. The Chorography of Jilin Province. Changchun: Jilin People’s Publishing House. (in Chinese)

2
Committee of Agriculture Divisions in China, 1984. Technical Regulation for Land Use Investigation. Beijing: Committee of Agriculture Divisions in China. (in Chinese)

3
Course on the Survey of Manchurian Railway (CSMR), 1923. Local Gazette of Manchu-Mongolian. Dalian: Manchuria Riri Press.

4
Findell K L, Pitman A J, England M Het al., 2009. Regional and global impacts of land cover change and sea surface temperature anomalies.Journal of Climate, 22(12): 3248-3269.

5
Forster P, Ramaswamy V, Artaxo P, et al., 2007. Changes in atmospheric constituents and in radiative forcing. In: Climate Change 2007: The Physical Science Basis: Contribution of Working Group I to the Fourth Assessment Report of the Intergovernmental Panel on Climate Change. Cambridge: Cambridge University Press.

6
Godfray H C, Beddington J R, Crute L Ret al., 2010. Food security: The challenge of feeding 9 billion people.Science, 327(5967): 812-818.

7
Goldewijk K K, 2001. Estimating global land use change over the past 300 years: The HYDE database.Global Biogeochemical Cycles, 15(2): 417-433.

8
Goldewijk K K, Beusen A, Drecht G Vet al., 2011. The HYDE 3.1 spatially explicit database of human-induced global land-use change over the past 12,000 years.Global Ecology and Biogeography, 20(1): 73-86.

9
Goldewijk K K, Drecht G V, 2006. HYDE 3: Current and historical population and land cover. In: Bouwman A F, Kram T, Goldewijk K K (eds.). Integrated Modelling of Global Environmental Change: An Overview of Image 2.4. Bilthoven: Netherlands Environmental Assessment Agency (MNP).

10
Houghton R A, Vanderwerf G R, Defries R Set al., 2012. Chapter G2 Carbon emissions from land use and land cover change.Biogeosciences, 9: 835-878.

11
Li B B, Fang X Q, Ye Yet al., 2010. Accuracy assessment of global historical cropland datasets based on regional reconstructed historical data: A case study in Northeast China.Science China Earth Sciences, 53(11): 1689-1699. (in Chinese)

12
Li D B, Shi F, 1987. A General Study of Immigration in Heilongjiang. Harbin: Heilongjiang People’s Publishing House. (in Chinese)

13
Li J W, 1993. Forest in Heilongjiang. Beijing: China Forestry Publishing House. (in Chinese)

14
Li W, Zhang P Y, Song Y X, 2005. Analysis on land development and causes in Northeast China during Qing Dynasty.Scientia Geographica Sinica, 25(1): 7-16. (in Chinese)

15
Liaoning Provincial Archives (LPA), 2008. Survey Report of Manchurian Railway, Vol. 3. Nanning: Guangxi Normal University Press. (in Chinese)

16
Mahmood R, Pielke Sr R A, Hubbard K G, 2014. Land cover changes and their biogeophysical effects on climate.International Journal of Climatology, 34(4): 929-953.

17
Ministry of Land and Resources of the People’s Republic of China (MLR, PRC), 2001. National Land Classification (Trial). Beijing: Ministry of Land and Resources of the People’s Republic of China. (in Chinese)

18
National Geomatics Center of China, 2012Accessed: 2012-09-12.

19
Ramankutty N, Foley J A, 1999. Estimating historical changes in global land cover: Croplands from 1700 to 1992.Global Biogeochemical Cycles, 13(4): 997-1027.

20
Ramankutty N, Foley J A, 2010. ISLSCP II Historical Croplands Cover, 1700-1992. Dataset. Available from: Accessed 2012-09-25.

21
Sun J Z, 1959. The Regional Economic Geography Science in Northeast China. Beijing: Science Press. (in Chinese)

22
Tan Q X, 1987. Historical Atlas of China: The Eighth Book. Beijing: China Cartographic Publishing House, 12-15. (in Chinese)

23
Wan F L, Zhang B Y, Cui C Q, et al., 1992. Local Gazette of Heilongjiang Province. Harbin: Heilongjiang People’s Publishing House. (in Chinese)

24
Xin P L, Zhang F M, Gao X Y, 1999. The Development History of Heilongjiang. Harbin: Heilongjiang People’s Publishing House. (in Chinese)

25
Xu J H, 2009. Mathematical Methods in Contemporary Geography. Beijing: Higher Education Press. (in Chinese)

26
Ye Y, Fang X Q, Ren Y Yet al., 2009. Cropland cover change in Northeast China during the past 300 years. Science in China Series D (Earth Sciences), 39(3): 340-350. (in Chinese)

27
Zeng Z Z, Fang X Q, Ye Y, 2011. The process of land cultivation based on settlement names in Jilin Province in the past 300 years.Acta Geographica Sinica, 66(7): 985-993. (in Chinese)

Outlines

/