
Journal of Geographical Sciences >
Modeling demand/supply of water resources in the arid region of northwestern China during the late 1980s to 2010
*Corresponding author: Shen Yanjun, PhD and Professor, E-mail:yjshen@sjziam.ac.cn
Author: Liu Xingran (1988-), Master Candidate, specialized in ecological hydrology. E-mail:liuxingran2007@126.com
Received date: 2014-10-27
Accepted date: 2015-01-15
Online published: 2015-05-15
Supported by
National Key Project on Basic Research (973), No.2010CB951003
The National Science and Technology Project, No.2014BAD10B06
Copyright
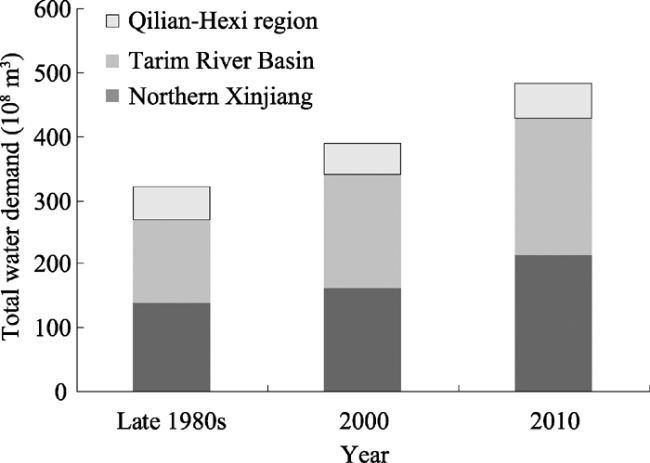
Water demand increases continuously with an increasing population and economic development. As a result, the difference between water supply and demand becomes a significant issue, especially in arid regions. To figure out the utilization of water resources in the arid region of northwestern China (ARNWC), and also to provide methodologies to predict the water use in future, three models were established in this study to calculate agricultural irrigation, industrial and domestic water use in the ARNWC from the late 1980s to 2010. Based on river discharges in the region, the supply and demand of water resources at the river basin level were analyzed. The results indicated that agricultural irrigation demand occupies more than 90% of the total water use in the ARNWC. Total water demand increased from 31.97 km3 in the late 1980s to 48.19 km3 in 2010. Most river basins in this arid region were under medium and high water stress. Severe-risk river basins, such as the Shiyang river basin and the eastern part of the northern piedmont of the Tianshan Mountains, were found in this region. It was revealed that the water supply became critical from April to May, which was the season of the lowest water supply as determined by comparing monthly water consumption.
LIU Xingran , SHEN Yanjun , GUO Ying , LI Shuo , GUO Bin . Modeling demand/supply of water resources in the arid region of northwestern China during the late 1980s to 2010[J]. Journal of Geographical Sciences, 2015 , 25(5) : 573 -591 . DOI: 10.1007/s11442-015-1188-5
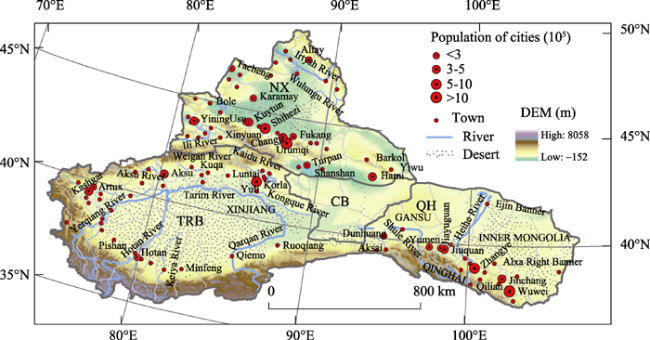
Figure 1 DEM, cities, towns, major rivers and desert areas in the arid region of northwestern China |
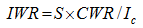
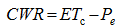 (1)
(1)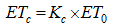 (2)
(2)
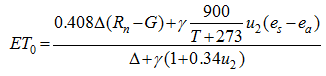
 is the slope of the vapor pressure curve [kPa/℃]; and
  is the psychrometric constant [kPa/℃] (Er-Raki et al., 2007).
Table 1 Development of irrigation efficiency in the arid region of northwestern China during the past 20 years |
| Year | 1990 | 1995 | 2000 | 2005 | 2010 |
|---|---|---|---|---|---|
| Ic | 0.38 | 0.40 | 0.42 | 0.45 | 0.48 |
Figure 2 The relationship between water use per unit of industrial added value and GDP per capita from 2000 to 2010 in the arid region of northwestern China |


 is the statistical industrial water use of a certain administrative region;
  is the modeled industrial water use of a certain administrative region;
  is the mean value of total statistical industrial water use; and n is the number of administrative regions.
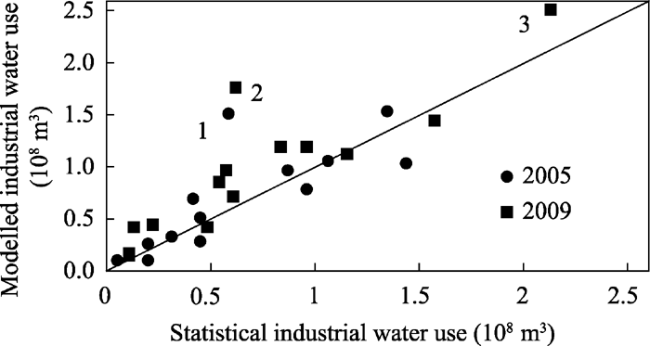
Figure 3 Comparison of modeled and statistical total industrial water use at the prefecture level for 2005 and 2009 in the arid region of northwestern China |


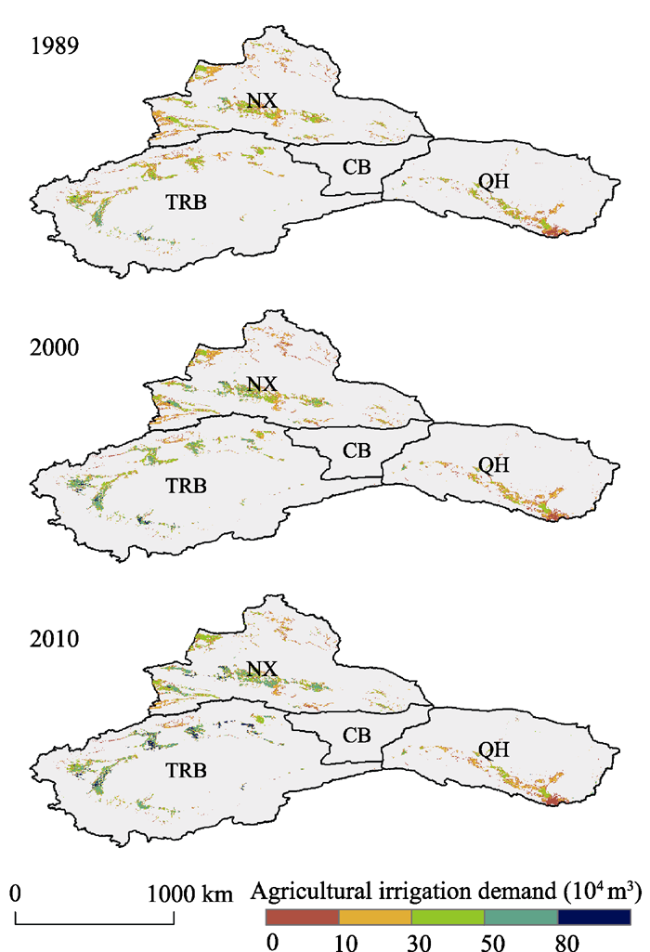
Figure 4 The spatial distribution of agricultural irrigation demand in 1989, 2000 and 2010 in the arid region of northwestern China (spatial resolution 0.01°× 0.01°) |
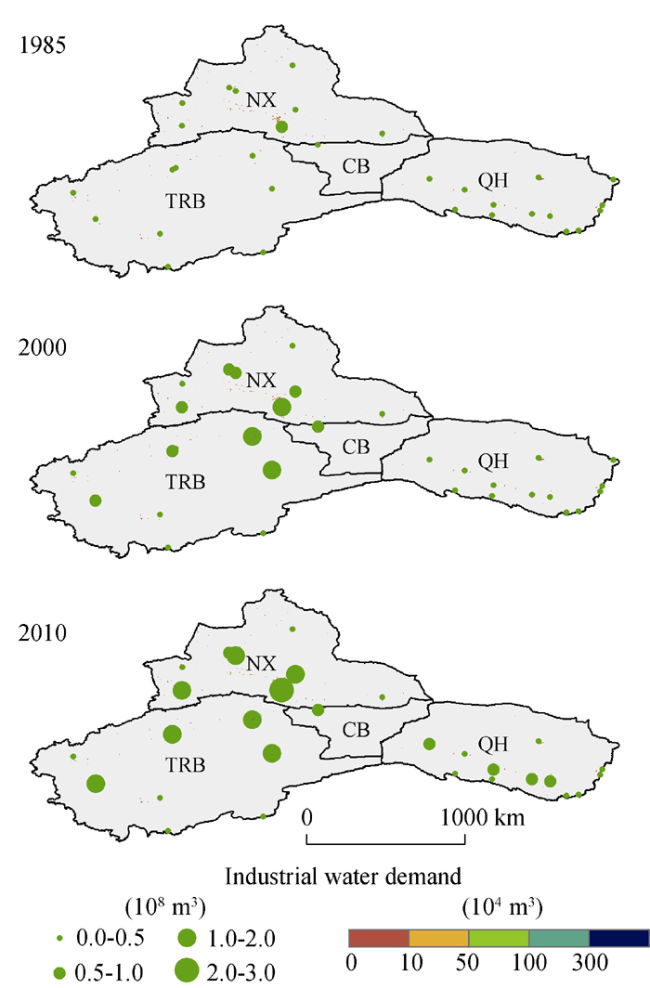
Figure 5 The spatial distribution of industrial water demand and regional water demand in 1985, 2000 and 2010 in the arid region of northwestern China (spatial resolution 0.01°× 0.01°) |
Table 2 The water consumption per unit of industrial added value in the main parts of the arid region of northwestern China |
| Region | Water use per unit of industrial added value (m3/104 yuan) | Decreasing rate of water use per unit of industrial added value (m3/yr) | ||||
|---|---|---|---|---|---|---|
| 1985 | 2000 | 2010 | Δ1985-2000 | Δ2000-2010 | Δ1985-2010 | |
| Karamay | 220.94 | 49.54 | 21.99 | 11.43 | 2.76 | 7.96 |
| Jinchang | 448.33 | 184.03 | 47.10 | 17.62 | 13.69 | 16.05 |
| Jiuquan | 542.15 | 185.88 | 55.19 | 23.75 | 13.07 | 19.48 |
| Urumqi | 558.25 | 108.54 | 49.06 | 29.98 | 5.95 | 20.37 |
| Jiayuguan | 666.04 | 133.99 | 30.57 | 35.47 | 10.34 | 25.42 |
| Hami | 868.13 | 202.45 | 65.93 | 44.38 | 13.65 | 32.09 |
| Tacheng | 881.13 | 206.90 | 78.20 | 44.95 | 12.87 | 32.12 |
| Zhangye | 984.00 | 256.70 | 97.45 | 48.49 | 15.92 | 35.46 |
| Bortala Mongolian Autonomous Prefecture | 1019.09 | 242.98 | 69.63 | 51.74 | 17.33 | 37.98 |
| Turpan | 1029.85 | 141.89 | 65.15 | 59.20 | 7.67 | 38.59 |
| Kizilsu Kirghiz Autonomous Prefecture | 1168.84 | 564.66 | 195.72 | 40.28 | 36.89 | 38.93 |
| Changji | 1031.70 | 188.12 | 56.87 | 56.24 | 13.12 | 38.99 |
| Bayingolin Mongolian Autonomous Prefecture | 1085.85 | 124.85 | 45.86 | 64.07 | 7.90 | 41.60 |
| Counties (Cities) Direct under Yili Prefecture | 1149.06 | 341.22 | 107.42 | 53.86 | 23.38 | 41.67 |
| Altay | 1147.27 | 246.53 | 81.30 | 60.05 | 16.52 | 42.64 |
| Aksu | 1216.72 | 279.34 | 106.17 | 62.49 | 17.32 | 44.42 |
| Wuwei | 1385.27 | 354.82 | 126.91 | 68.70 | 22.79 | 50.33 |
| Kashgar | 1614.70 | 483.12 | 168.37 | 75.44 | 31.47 | 57.85 |
| Hotan | 1867.88 | 609.72 | 252.54 | 83.88 | 35.72 | 64.61 |
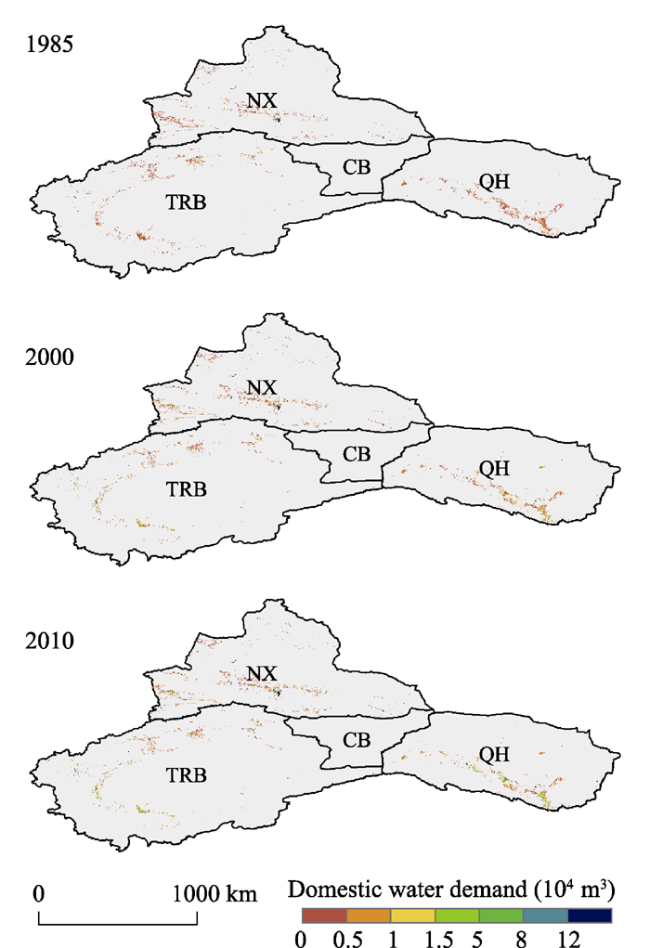
Figure 6 The spatial distribution of domestic water demand in 1985, 2000 and 2010 in the arid region of northwestern China (spatial resolution 0.01°× 0.01°) |
Figure 7 The histogram of total water use in the late 1980s, 2000 and 2010 in the arid region of northwestern China |
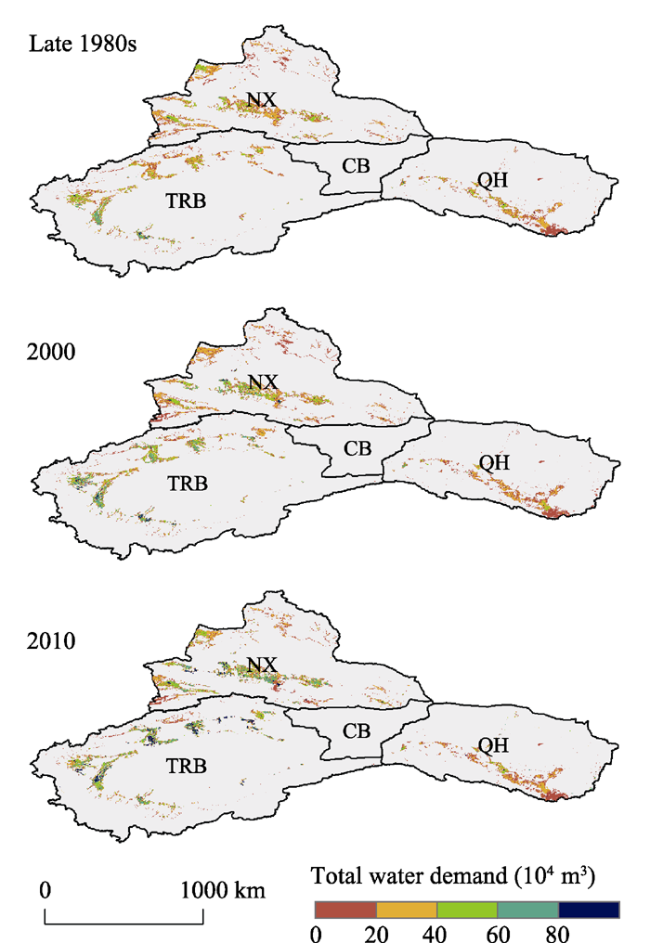
Figure 8 The spatial distribution of total water demand in the late 1980s, 2000 and 2010 in the arid region of northwestern China (spatial resolution 0.01°× 0.01°) |
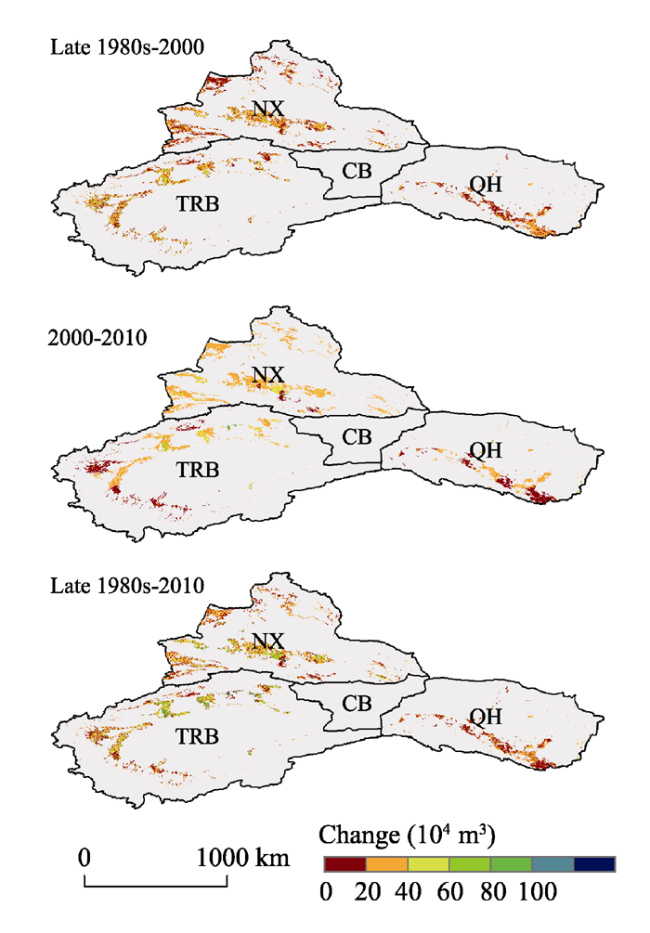
Figure 9 The temporal change of total water demand from the late 1980s to 2000, 2000 to 2010, and the late 1980s to 2010 in the arid region of northwestern China (spatial resolution 0.01°× 0.01°) |
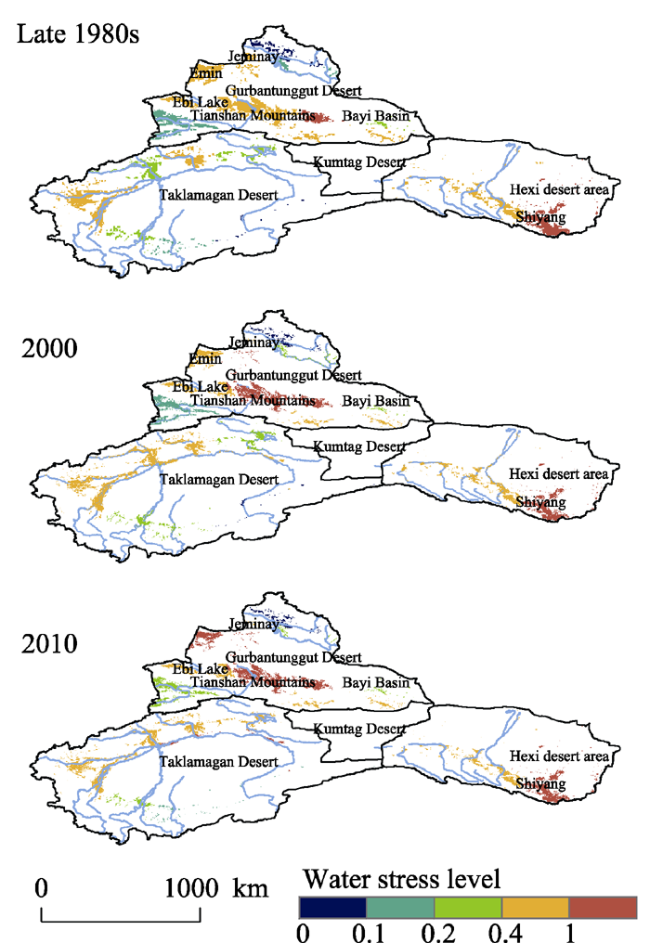
Figure 10 The spatial distribution of water stress levels in the late 1980s, 2000 and 2010 in the arid region of northwestern China |
Table 3 The average annual river discharges (108 m3) and water stress level of selected river basins in the late 1980s, 2000 and 2010 in the arid region of northwestern China |
| River Basin | Average annual river discharge | Water stress level | |||
|---|---|---|---|---|---|
| Late 1980s | 2000 | 2010 | |||
| NX | Irtysh | 92.31 | 0.06 | 0.05 | 0.08 |
| Ili | 161.33 | 0.17 | 0.17 | 0.23 | |
| Wulungu | 8.83 | 0.18 | 0.20 | 0.38 | |
| Bayi Basin | 5.75 | 0.37 | 0.31 | 0.37 | |
| Hami Basin | 4.58 | 0.42 | 0.63 | 1.00 | |
| Ebi Lake | 42.19 | 0.43 | 0.64 | 0.83 | |
| Turpan Basin | 10.56 | 0.48 | 0.49 | 0.47 | |
| Jeminay | 1.18 | 0.76 | 0.49 | 0.70 | |
| Central part, northern piedmont of the Tianshan Mountains | 53.51 | 0.81 | 1.10 | 1.44 | |
| Emin | 18.69 | 0.98 | 0.83 | 1.12 | |
| Eastern part, northern piedmont of the Tianshan Mountains | 9.87 | 1.40 | 1.61 | 2.13 | |
| TRB | Qarqan | 21.3 | 0.06 | 0.08 | 0.14 |
| Keriya | 24.28 | 0.18 | 0.23 | 0.19 | |
| Kaikong | 48.22 | 0.26 | 0.36 | 0.62 | |
| Hotan | 51.37 | 0.29 | 0.35 | 0.30 | |
| Weigan | 36.25 | 0.43 | 0.55 | 0.73 | |
| Yerqiang | 73.73 | 0.44 | 0.54 | 0.62 | |
| Aksu | 45.96 | 0.39 | 0.62 | 0.88 | |
| Kashgar | 47.83 | 0.54 | 0.76 | 0.69 | |
| QH | Shule | 13.25 | 0.51 | 0.47 | 0.49 |
| Heihe | 34.94 | 0.72 | 0.61 | 0.69 | |
| Shiyang | 15.74 | 1.16 | 1.28 | 1.28 | |
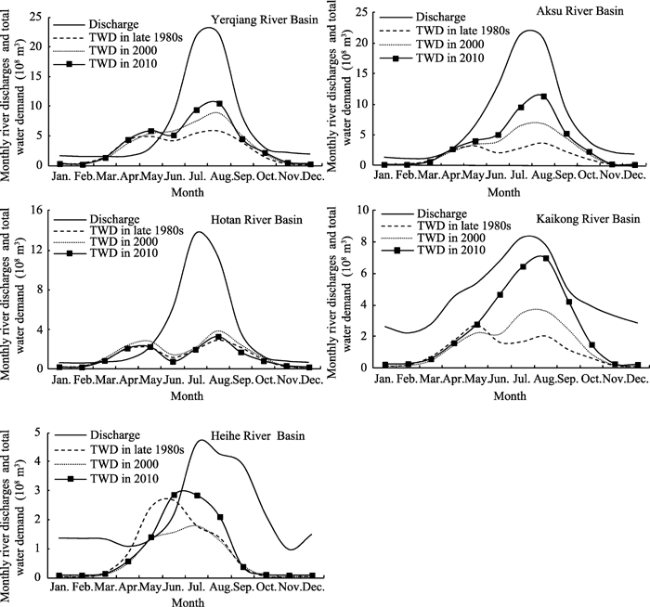
Figure 11 The monthly average annual river discharges and total water demand (TWD) in the late 1980s, 2000 and 2010 in typical river basins in the arid region of northwestern China |
Table 4 Total water demand in the late 1980s, 2000, 2010 (108 m3) and the monthly average annual river discharges under assurances of 25%, 50% and 75% in key months (108 m3) in the arid region of northwestern China |
| River basin | Month | Year | Assurance | ||||
|---|---|---|---|---|---|---|---|
| Late 1980s | 2000 | 2010 | 25% | 50% | 75% | ||
| Yerqiang | Mar. | 1.51 | 1.20 | 1.36 | 1.54 | 1.47 | 1.4 |
| Apr. | 4.35 | 3.75 | 4.38 | 1.71 | 1.44 | 1.25 | |
| May. | 4.88 | 5.42 | 5.89 | 3.63 | 2.88 | 2.25 | |
| Aksu | Mar. | 0.82 | 0.70 | 0.65 | 1.33 | 1.18 | 1.06 |
| Apr. | 2.56 | 2.36 | 2.72 | 3.22 | 2.26 | 1.75 | |
| May. | 3.24 | 3.47 | 4.05 | 7.77 | 6.2 | 5.01 | |
| Hotan | Mar. | 0.90 | 1.10 | 0.87 | 0.74 | 0.53 | 0.47 |
| Apr. | 2.06 | 2.39 | 2.12 | 1.09 | 0.84 | 0.7 | |
| May. | 2.20 | 2.82 | 2.27 | 2.6 | 2.11 | 1.75 | |
| Kaikong | Mar. | 0.70 | 0.48 | 0.59 | 3.3 | 2.58 | 2.06 |
| Apr. | 1.75 | 1.45 | 1.61 | 5.18 | 4.3 | 3.64 | |
| May. | 2.73 | 2.24 | 2.79 | 6.11 | 5.27 | 4.54 | |
| Heihe | May. | 2.43 | 1.34 | 1.41 | 1.51 | 1.12 | 0.92 |
| Jun. | 2.67 | 1.57 | 2.86 | 2.51 | 1.84 | 1.49 | |
| Jul. | 1.78 | 1.80 | 2.85 | 5.81 | 4.18 | 2.96 | |
The authors have declared that no competing interests exist.
| 1 |
|
| 2 |
|
| 3 |
|
| 4 |
|
| 5 |
|
| 6 |
|
| 7 |
|
| 8 |
|
| 9 |
|
| 10 |
|
| 11 |
|
| 12 |
|
| 13 |
|
| 14 |
|
| 15 |
|
| 16 |
|
| 17 |
|
| 18 |
|
| 19 |
|
| 20 |
|
| 21 |
|
| 22 |
|
| 23 |
|
| 24 |
|
| 25 |
|
| 26 |
|
| 27 |
|
| 28 |
|
| 29 |
|
| 30 |
|
| 31 |
|
| 32 |
|
| 33 |
|
| 34 |
|
| 35 |
|
| 36 |
|
| 37 |
|
/
| 〈 |
|
〉 |
