
Journal of Geographical Sciences >
Spatial differences and driving forces of land urbanization in China
*Corresponding author: Wang Yang, PhD, specialized in economic geography, and urban & regional planning. E-mail:wyxkwy@163.com
Author: Lin Xueqin, PhD, specialized in urban and regional development. E-mail:lin-xueqin@139.com
Received date: 2014-08-18
Accepted date: 2015-02-06
Online published: 2015-05-15
Supported by
National Natural Science Foundation of China, No.41401164, No.41430636
The Key Research Program of the Chinese Academy of Sciences, No.KZZD-EW-06
Copyright
Land urbanization plays an important supporting and restriction role in the rapid and sustainable development of urbanization in China, and it shows distinctive spatial heterogeneity. Applying urban area as the basic research unit and urban construction land area as the core indicator, this paper establishes the conceptual framework and calculation method for the quantity and rate of land urbanization process. The study evaluates the spatial differentiation pattern of absolute and relative process of land urbanization in 658 cities in China from 2000 to 2010. The spatial distribution of cities with rapid land urbanization process is discussed, and the contribution rate and its spatial heterogeneity of major land use types are examined with the aid of GIS. The main conclusions are as follows: (1) Land urbanization in China shows a clear spatial difference. The greater the city scale, the faster its land urbanization. The cities with rapid land urbanization show a significant pattern of central distribution in coastal regions and a scattered distribution in the inland regions. (2) Over the last 10 years, the average quantity of land urbanization in the 656 cities was 3.82 km2, the quantity of land urbanization is differentiated by administrative grade. The average rate of land urbanization was 6.89%, obviously faster than the speed of population urbanization. The rate of land urbanization reveals a pattern of differentiation between coastal and other cities. (3) In the past 10 years, the two primary land use types associated with land urbanization in China are residential and industrial, with a combined contribution rate of 52.49%. The greater the scale of the city, the more significant the driving effect of industrial land. In small- and medium-scale cities of the western and central regions, the growth of residential land is the primary driver of land urbanization, while in coastal urban agglomerations and cities on important communication axes, the growth of industrial land is the main driver. (4) Overall, urban population agglomeration, industrial growth and investment are the three drivers of land urbanization in China, but cities of different scales have different drivers.
LIN Xueqin , WANG Yang , WANG Shaojian , WANG Dai . Spatial differences and driving forces of land urbanization in China[J]. Journal of Geographical Sciences, 2015 , 25(5) : 545 -558 . DOI: 10.1007/s11442-015-1186-7
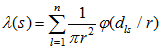
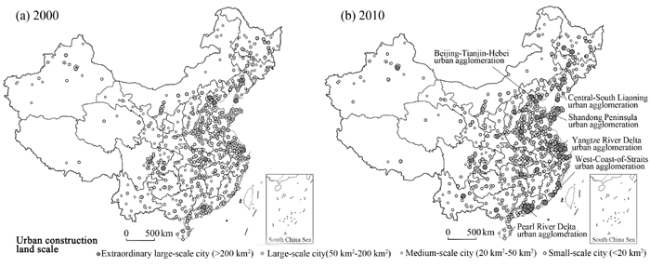
Figure 1 Spatial evaluation of urban construction land scale in China in 2000 and 2010 |
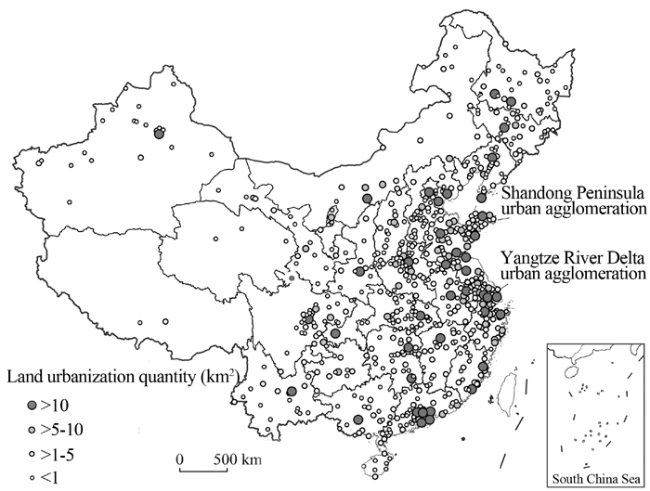
Figure 2 Spatial pattern of land urbanization quantity in Chinese 656 cities (2000-2010) |
Table 1 Land urbanization quantity for different administrative grades cities in China in 2000 and 2010 |
| Administrative hierarchy | Number of cities | Construction land area (km2) | Average construction land area per city (km2/city) | Average annual quantity of land urbanization per city(km2/year·city) | |||
|---|---|---|---|---|---|---|---|
| 2000 | 2010 | Increase rate (%) | 2000 | 2010 | |||
| Provincial capital city | 36 | 7010.85 | 15668.31 | 123.49 | 194.75 | 435.23 | 24.05 |
| Prefecture-level cities | 251 | 9982.79 | 19237.88 | 92.72 | 39.77 | 76.64 | 3.73 |
| County-level cities | 369 | 5416.87 | 8743.78 | 61.41 | 14.68 | 23.70 | 0.98 |
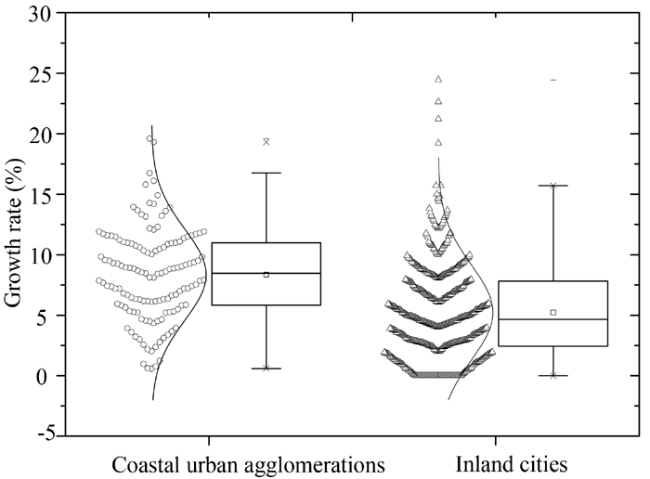
Figure 4 BOX chart for land urbanization rate of coastal urban agglomerations and inland cities (2000-2010) |
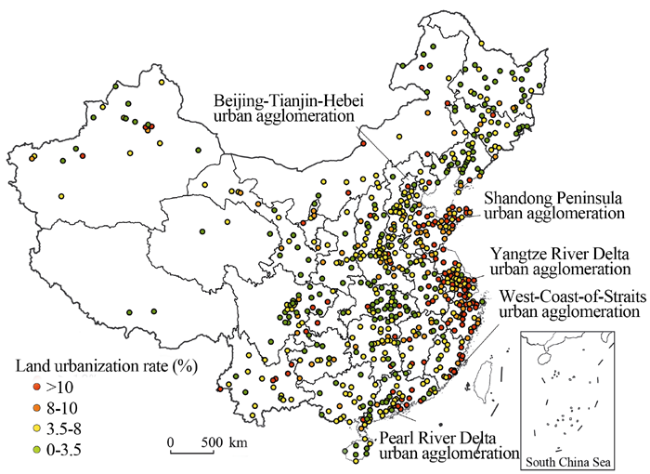
Figure 3 Spatial pattern of land urbanization rate in Chinese 656 cities (2000-2010) |
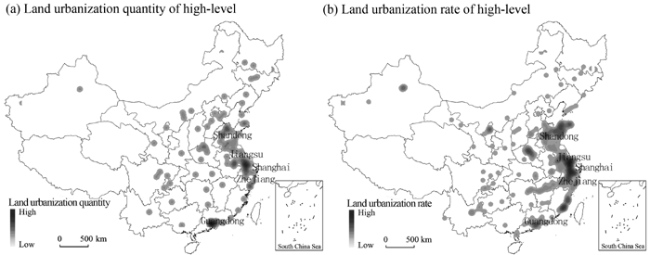
Figure 5 Kernel density distribution of cities with rapid land urbanization in China (2000-2010) |
Table 2 Land-use structures in 2010 and land area growth structures since 2000 in various-scale cities in China |
| Categories | City scale | Type of urban construction land | ||||||||
|---|---|---|---|---|---|---|---|---|---|---|
| Reside- ntial | Public facilities | Industrial | Wareho- using | External traffic | Roads and squares | Municipal public facilities | Green | Special purposes | ||
| Proportion of various types of land in urban construction land in 2010 (%) | Small-scale cities | 35.31 | 12.11 | 16.95 | 3.47 | 3.83 | 11.65 | 3.53 | 11.30 | 1.85 |
| Medium-scale cities | 33.07 | 12.29 | 18.72 | 3.33 | 4.31 | 11.52 | 3.72 | 11.30 | 1.74 | |
| Large-scale cities | 30.97 | 12.38 | 22.13 | 3.05 | 4.43 | 11.43 | 3.25 | 10.66 | 1.71 | |
| Extraordinarily large-scale cities | 29.62 | 11.86 | 24.27 | 2.64 | 4.49 | 12.28 | 3.58 | 8.95 | 2.31 | |
| Nationwide | 31.20 | 12.15 | 21.86 | 2.99 | 4.39 | 11.77 | 3.49 | 10.21 | 1.95 | |
| Proportion of average annual growth area 2000- 2010) (%) | Small-scale cities | 30.81 | 14.66 | 14.76 | -2.46 | -1.94 | 22.04 | 3.62 | 19.85 | -1.33 |
| Medium-scale cities | 31.46 | 12.76 | 18.20 | 0.95 | 2.10 | 15.35 | 3.55 | 15.12 | 0.51 | |
| Large-scale cities | 31.41 | 14.07 | 19.67 | 1.13 | 2.40 | 15.48 | 2.97 | 12.62 | 0.26 | |
| Extraordinary large-scale cities | 27.87 | 12.04 | 25.97 | 0.52 | 1.24 | 17.15 | 4.21 | 10.84 | 0.15 | |
| Nationwide | 29.60 | 13.03 | 22.89 | 0.82 | 1.81 | 16.33 | 3.60 | 11.71 | 0.20 | |
Note: The above data do not include Beijing and Shanghai. |
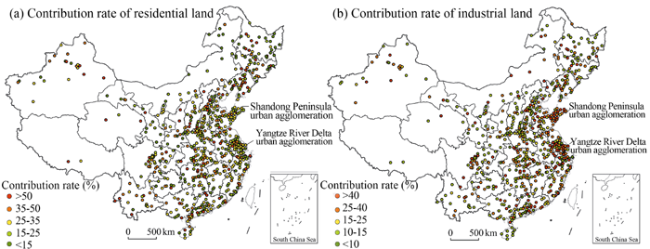
Figure 6 Contribution rate of residential and industrial land for land urbanization in China (2000-2010) |
Table 3 The parameters of regression model of land urbanization based on four major factors in China |
| Categories | Unstandardized coefficients | Standard errors | Standardized coefficients | t | Sig. |
|---|---|---|---|---|---|
| Undetermined coefficient (α0) | 1.383 | 1.275 | - | 1.085 | 0.278 |
| Population agglomeration | 0.704 | 0.021 | 0.730 | 33.657 | 0.000 |
| Industrial growth | 0.033 | 0.010 | 0.098 | 3.327 | 0.001 |
| Investment | 0.045 | 0.006 | 0.175 | 7.155 | 0.000 |
| Promotion of urban function | 13.497 | 13.125 | 0.014 | 1.028 | 0.304 |
Table 4 The parameters of regression model in various-scale cities in China |
| City scale | R | F | Sig. | Population agglomeration | Industrial growth | Investment | Promotion of urban function | ||||
|---|---|---|---|---|---|---|---|---|---|---|---|
| B | Sig. | B | Sig. | B | Sig. | B | Sig. | ||||
| Small-scale cities | 0.401 | 8.331 | 0.000 | 0.188*** | 0.000 | 0.011 | 0.353 | 0.005 | 0.613 | 5.587** | 0.025 |
| Medium-scale cities | 0.504 | 22.587 | 0.000 | 0.357*** | 0.000 | 0.013 | 0.146 | 0.025*** | 0.009 | -2.780 | 0.590 |
| Large-scale cities | 0.931 | 328.568 | 0.000 | 0.696*** | 0.000 | 0.033* | 0.068 | 0.038*** | 0.001 | 41.415 | 0.333 |
Note: Regression method is force regression. * = significant at 10% level; ** = significant at 5% level; *** = significant at 1% level. |
The authors have declared that no competing interests exist.
| 1 |
|
| 2 |
|
| 3 |
|
| 4 |
|
| 5 |
|
| 6 |
|
| 7 |
|
| 8 |
|
| 9 |
|
| 10 |
|
| 11 |
|
| 12 |
|
| 13 |
|
| 14 |
|
| 15 |
|
| 16 |
|
| 17 |
|
| 18 |
|
| 19 |
|
| 20 |
|
| 21 |
|
| 22 |
|
| 23 |
|
| 24 |
|
| 25 |
|
| 26 |
|
| 27 |
|
| 28 |
|
| 29 |
|
| 30 |
|
| 31 |
|
| 32 |
|
| 33 |
|
| 34 |
|
| 35 |
|
| 36 |
|
| 37 |
|
| 38 |
|
/
| 〈 |
|
〉 |