
Journal of Geographical Sciences >
The driving effects of urbanization on economic growth and water use change in China: A provincial-level analysis in 1997-2011
Author: Bao Chao (1978-), PhD and Associate Professor, specialized in urbanization and urban sustainable development. E-mail:baoc@igsnrr.ac.cn
Received date: 2014-01-22
Accepted date: 2014-07-30
Online published: 2015-05-15
Supported by
National Social Science Foundation of China, No.13&ZD027
National Natural Science Foundation of China, No.41101538
Copyright
As one of the key issues in China’s sustainable development, rapid urbanization and continuous economic growth are accompanied by a steady increase of water consumption and a severe urban water crisis. A better understanding of the relationship among urbanization, economic growth and water use change is necessary for Chinese decision makers at various levels to address the positive and negative effects of urbanization. Thus, we established a complete decomposition model to quantify the driving effects of urbanization on economic growth and water use change for China and its 31 provincial administrative regions during the period of 1997-2011. The results show that, (1) China’s urbanization only contributed about 30% of the economic growth. Therefore, such idea as urbanization is the major driving force of economic growth may be weakened. (2) China’s urbanization increased 2352×108 m3 of water use by increasing the economic aggregate. However, it decreased 4530×108 m3 of water use by optimizing the industrial structure and improving the water use efficiency. Therefore, such idea as urbanization is the major driving force of water demand growth may be reacquainted. (3) Urbanization usually made greater contribution to economic and water use growth in the provincial administrative regions in east and central China, which had larger population and economic aggregate and stepped into the accelerating period of urbanization. However, it also made greater contribution to industrial structure optimization and water use efficiency improvement, and then largely decreased total water use. In total, urbanization had negative effects on water use growth in most provincial administrative regions in China, and the spatiotemporal differences among them were lessened on the whole. (4) Though urbanization helps to decrease water use for China and most provincial administrative regions, it may cause water crisis in urban built-up areas or urban agglomerations. Therefore, China should construct the water transfer and compensation mechanisms between urban and rural areas, or low and high density urban areas as soon as possible.
BAO Chao , CHEN Xiaojie . The driving effects of urbanization on economic growth and water use change in China: A provincial-level analysis in 1997-2011[J]. Journal of Geographical Sciences, 2015 , 25(5) : 530 -544 . DOI: 10.1007/s11442-015-1185-8


Table 1 Driving effects of China’s population urbanization on economic growth from 1997 to 2011 |
| Year | 1998 | 1999 | 2000 | 2001 | 2002 | 2003 | 2004 | 2005 | 2006 | 2007 | 2008 | 2009 | 2010 | 2011 | 1997-2011 |
|---|---|---|---|---|---|---|---|---|---|---|---|---|---|---|---|
| ΔE | 586 | 614 | 732 | 781 | 925 | 1114 | 1233 | 1523 | 1900 | 2391 | 1857 | 1947 | 2411 | 2369 | 20385 |
| Peff | 68 | 90 | 137 | 75 | 65 | 68 | 98 | 92 | 126 | 120 | 128 | 134 | 141 | 149 | 1491 |
| Ieff | 421 | 434 | 400 | 576 | 692 | 855 | 912 | 1170 | 1398 | 1963 | 1389 | 1448 | 1876 | 1797 | 15330 |
| Seff | 97 | 91 | 195 | 131 | 169 | 191 | 223 | 261 | 376 | 308 | 340 | 365 | 394 | 424 | 3564 |
| SIeff | 79 | 75 | 131 | 107 | 136 | 156 | 179 | 213 | 296 | 266 | 273 | 291 | 325 | 343 | 2872 |
| Ueff | 176 | 166 | 326 | 238 | 305 | 348 | 402 | 474 | 672 | 574 | 613 | 656 | 719 | 768 | 6436 |
| ΔI | 421 | 422 | 473 | 555 | 672 | 812 | 875 | 1095 | 1347 | 1713 | 1296 | 1350 | 1680 | 1635 | 14346 |
| IIeff | 342 | 349 | 318 | 452 | 540 | 663 | 703 | 896 | 1062 | 1481 | 1041 | 1078 | 1389 | 1322 | 11637 |
| ISeff | 79 | 73 | 155 | 103 | 132 | 148 | 172 | 200 | 285 | 232 | 255 | 272 | 291 | 312 | 2709 |
Note: The units of ΔE, Peff, Ieff, Seff, SIeff, and Ueff are billion yuan; the units of ΔI, IIeff , and ISeff are yuan per capita. |
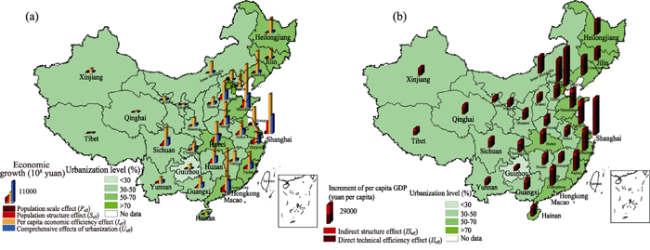
Figure 1 Driving effects of population urbanization on economic growth by province in China |
Table 2 Comprehensive contribution rates of population urbanization to economic growth by province in China from 1997 to 2011 (%) |
| Year | 1998 | 1999 | 2000 | 2001 | 2002 | 2003 | 2004 | 2005 | 2006 | 2007 | 2008 | 2009 | 2010 | 2011 | 1997-2011 |
|---|---|---|---|---|---|---|---|---|---|---|---|---|---|---|---|
| China | 30.0 | 27.0 | 44.6 | 30.4 | 33.0 | 31.2 | 32.6 | 31.1 | 35.4 | 24.0 | 33.0 | 33.7 | 29.8 | 32.4 | 31.6 |
| Beijing | 2.9 | 13.8 | -19.7 | -14.3 | 9.6 | 10.0 | 7.9 | 12.1 | 18.8 | 6.4 | 9.6 | 8.3 | 8.0 | 9.6 | 7.5 |
| Tianjin | 4.7 | 9.5 | 4.1 | 2.6 | 3.1 | 2.7 | 2.5 | 2.7 | -0.9 | 2.2 | 2.1 | 2.1 | 2.0 | 2.1 | 2.3 |
| Hebei | 28.1 | 24.8 | 48.1 | 32.7 | 43.5 | 42.9 | 40.7 | 37.6 | 17.2 | 32.7 | 39.6 | 39.6 | 33.3 | 35.3 | 35.1 |
| Shanxi | 21.3 | 31.9 | 51.3 | 21.8 | 29.0 | 24.1 | 26.6 | 30.1 | 24.0 | 19.7 | 33.6 | 47.8 | 21.4 | 22.4 | 26.1 |
| Inner Mongolia | 29.3 | 17.5 | 32.0 | 22.4 | 12.0 | 12.1 | 10.7 | 9.9 | 10.0 | 11.9 | 12.8 | 13.5 | 15.1 | 15.6 | 13.7 |
| Liaoning | 10.5 | -6.8 | 2.4 | 3.7 | 13.0 | 11.7 | 14.4 | 16.0 | 14.0 | 8.2 | 9.1 | 9.2 | 8.6 | 9.7 | 9.8 |
| Jilin | 1.9 | -13.6 | -10.5 | -4.3 | 18.6 | 13.4 | 14.7 | 15.5 | 12.4 | 6.3 | 6.6 | 7.7 | 7.8 | 7.8 | 7.8 |
| Heilongjiang | 3.0 | 12.9 | 24.2 | 8.1 | 18.7 | 14.6 | 14.3 | 13.5 | 10.5 | 10.3 | 10.5 | 10.7 | 9.7 | 9.9 | 11.5 |
| Shanghai | 6.6 | -21.3 | 4.1 | 29.1 | 7.7 | 0.1 | 0.0 | 0.1 | 26.8 | 4.7 | 6.2 | 6.4 | 4.6 | 5.0 | 6.3 |
| Jiangsu | 34.2 | 62.4 | 73.3 | 67.7 | 26.2 | 28.5 | 25.2 | 27.2 | 19.8 | 33.4 | 36.7 | 36.0 | 33.8 | 36.4 | 34.8 |
| Zhejiang | 47.7 | 48.0 | 53.7 | 19.1 | 24.4 | 23.5 | 21.6 | 29.7 | 15.0 | 21.6 | 29.1 | 31.4 | 23.7 | 29.2 | 27.0 |
| Anhui | 29.3 | 35.1 | 37.9 | 12.4 | 59.7 | 54.8 | 52.3 | 14.5 | 36.5 | 28.8 | 31.7 | 31.1 | 27.9 | 29.8 | 32.6 |
| Fujian | 33.7 | 36.7 | 29.1 | 27.3 | 24.8 | 24.4 | 22.9 | 25.5 | 45.1 | 24.1 | 27.0 | 27.7 | 24.4 | 26.4 | 27.9 |
| Jiangxi | 17.4 | 14.8 | 53.3 | 44.0 | 36.1 | 36.0 | 33.5 | 36.4 | 4.9 | 5.8 | 5.9 | 3.3 | 19.6 | 21.8 | 19.4 |
| Shandong | 9.5 | 22.2 | 18.0 | 16.8 | 19.2 | 24.3 | 28.9 | 30.6 | 27.3 | 25.8 | 29.3 | 28.4 | 27.6 | 30.0 | 26.5 |
| Henan | 27.0 | 12.6 | 22.5 | 19.7 | 35.5 | 32.6 | 27.9 | 27.1 | 30.2 | 25.2 | 29.7 | 32.5 | 28.9 | 30.2 | 28.5 |
| Hubei | 30.7 | 28.6 | 28.0 | 38.7 | 35.2 | 44.4 | 35.0 | 33.8 | 28.3 | 26.2 | 27.6 | 26.8 | 24.2 | 25.1 | 28.7 |
| Hunan | 36.5 | 33.3 | 38.2 | 20.2 | 55.6 | 44.9 | 46.8 | 44.7 | 7.1 | 27.4 | 29.3 | 29.6 | 28.0 | 31.2 | 31.4 |
| Guangdong | 29.6 | 26.1 | 11.9 | 10.4 | 19.2 | 15.1 | 16.5 | 16.6 | 19.9 | 23.2 | 29.4 | 28.9 | 21.6 | 24.1 | 21.6 |
| Guangxi | 30.7 | 26.8 | 19.5 | 38.3 | 28.6 | 27.0 | 20.9 | 43.7 | 42.9 | 46.7 | 36.5 | 34.0 | 31.3 | 35.0 | 35.0 |
| Hainan | 44.0 | 23.1 | 23.7 | 27.0 | 15.8 | 13.1 | 10.0 | 8.3 | 45.4 | 13.6 | 19.4 | 16.4 | 12.5 | 16.2 | 18.5 |
| Chongqing | 32.5 | 26.4 | 67.6 | 53.2 | 32.8 | 31.4 | 31.1 | 28.8 | 56.4 | 30.0 | 31.8 | 30.5 | 26.7 | 27.2 | 32.7 |
| Sichuan | 19.7 | 32.6 | 35.1 | 25.9 | 35.8 | 39.6 | 34.6 | 42.8 | 35.5 | 27.9 | 35.3 | 28.0 | 27.0 | 27.1 | 31.1 |
| Guizhou | 2.7 | 5.0 | 14.4 | 14.5 | 19.4 | 25.2 | 19.2 | 24.2 | -2.5 | 12.1 | 15.7 | 15.7 | 14.3 | 12.6 | 13.8 |
| Yunnan | 37.6 | 49.9 | 67.8 | 37.3 | 38.9 | 35.3 | 40.4 | 38.1 | 25.4 | 29.7 | 33.4 | 29.8 | 29.5 | 27.0 | 33.2 |
| Tibet | 61.2 | 66.9 | 68.1 | 73.5 | 54.2 | 48.2 | 38.3 | 32.5 | 29.3 | 28.0 | 22.0 | 45.0 | 45.3 | 44.0 | 42.5 |
| Shaanxi | 39.1 | 29.5 | 55.4 | 30.6 | 33.6 | 34.3 | 20.7 | 25.9 | 10.9 | 20.2 | 19.6 | 23.0 | 21.6 | 22.4 | 23.6 |
| Gansu | 19.8 | 17.2 | 38.3 | 26.9 | 28.2 | 46.3 | 27.0 | 27.2 | 37.3 | 19.5 | 27.6 | 27.1 | 24.1 | 22.9 | 27.2 |
| Qinghai | 19.0 | -9.6 | -17.9 | 55.7 | 21.7 | 17.9 | 13.6 | 22.7 | 36.9 | 17.8 | 17.8 | 23.0 | 15.8 | 17.7 | 19.7 |
| Ningxia | 18.4 | 8.5 | -13.9 | 2.1 | 35.1 | 32.3 | 33.7 | 32.8 | 14.7 | 18.5 | 18.6 | 19.5 | 17.4 | 19.1 | 19.5 |
| Xinjiang | -9.9 | 6.0 | -12.3 | -9.8 | 19.6 | 19.4 | 25.5 | 19.1 | 19.2 | 18.7 | 20.6 | 26.8 | 21.2 | 19.0 | 17.2 |
Table 3 Driving effects of population-economic urbanization on water use change in China from 1997 to 2011 |
| Year | 1998 | 1999 | 2000 | 2001 | 2002 | 2003 | 2004 | 2005 | 2006 | 2007 | 2008 | 2009 | 2010 | 2011 | 1997-2011 |
|---|---|---|---|---|---|---|---|---|---|---|---|---|---|---|---|
| ΔW | -131 | 155 | -93 | 70 | -70 | -256 | 225 | 75 | 162 | 11 | 77 | 72 | 40 | 93 | 429 |
| EPeff | 415 | 405 | 449 | 441 | 482 | 514 | 515 | 590 | 672 | 758 | 530 | 514 | 585 | 529 | 7399 |
| EIeff | -391 | -77 | -325 | -174 | -330 | -514 | -166 | -312 | -251 | -392 | -306 | -263 | -326 | -255 | -4081 |
| ESeff | -155 | -173 | -217 | -198 | -221 | -256 | -124 | -204 | -260 | -355 | -147 | -179 | -219 | -181 | -2888 |
| ESIeff | -111 | -53 | -130 | -93 | -133 | -171 | -71 | -123 | -127 | -186 | -99 | -106 | -131 | -106 | -1641 |
| EUeff | -266 | -226 | -348 | -290 | -354 | -427 | -195 | -327 | -387 | -541 | -246 | -285 | -350 | -287 | -4530 |
| QEPeff | 125 | 109 | 200 | 134 | 159 | 160 | 168 | 184 | 238 | 182 | 175 | 173 | 175 | 171 | 2352 |
| ΔWU | -141 | -117 | -147 | -156 | -195 | -267 | -27 | -143 | -150 | -359 | -72 | -112 | -176 | -115 | -2177 |
| ΔEI | -70.3 | -29.8 | -60.0 | -37.9 | -51.8 | -66.0 | -22.6 | -36.3 | -32.0 | -41.3 | -22.4 | -20.0 | -22.5 | -16.4 | -529.2 |
| EIIeff | -50.3 | -9.2 | -36.0 | -17.7 | -31.0 | -44.1 | -12.9 | -21.9 | -15.7 | -21.7 | -15.1 | -11.9 | -13.4 | -9.6 | -310.6 |
| EISeff | -20.0 | -20.6 | -24.0 | -20.2 | -20.8 | -22.0 | -9.7 | -14.3 | -16.3 | -19.6 | -7.3 | -8.1 | -9.0 | -6.8 | -218.7 |
Note: The units of ΔW, EPeff, EIeff, ESeff, ESIeff, EUeff, QEPeff, and ΔWU are 108 m3, the units of ΔEI, EIIeff, and EISeff are m3 per 10,000 yuan. |
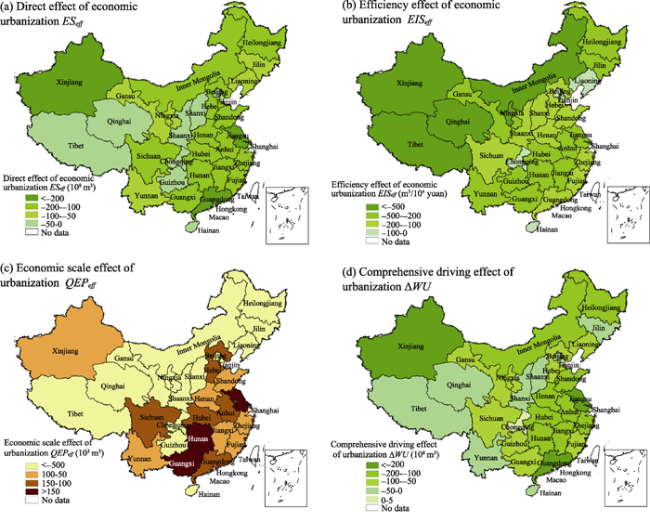
Figure 2 Driving effects of population-economic urbanization on water use change by province in China |
Table 4 Comprehensive contributions of population-economic urbanization on water use change by province in China from 1997 to 2011 (108 m3) |
| Year | 1998 | 1999 | 2000 | 2001 | 2002 | 2003 | 2004 | 2005 | 2006 | 2007 | 2008 | 2009 | 2010 | 2011 | 1997-2011 |
|---|---|---|---|---|---|---|---|---|---|---|---|---|---|---|---|
| China | -141 | -117 | -147 | -156 | -195 | -267 | -27 | -143 | -150 | -359 | -72 | -112 | -176 | -115 | -2177 |
| Beijing | -2.2 | -1.6 | -3.5 | -3.0 | -2.3 | -2.4 | -2.8 | -2.2 | -1.9 | -2.3 | -1.5 | -1.0 | -2.2 | -1.1 | -29.9 |
| Tianjin | -0.5 | -2.8 | -1.5 | -1.1 | -0.9 | -1.4 | -1.4 | -1.7 | -2.3 | -2.4 | -2.7 | -2.2 | -2.6 | -2.0 | -25.5 |
| Hebei | -5.3 | -8.2 | -3.0 | -3.3 | -2.4 | -4.5 | -4.9 | -5.4 | -13.0 | -11.4 | -5.2 | -6.8 | -10.3 | -7.3 | -91.0 |
| Shanxi | 2.1 | 3.3 | 8.7 | -2.1 | 3.2 | -2.2 | -2.9 | -5.0 | -1.5 | -5.9 | -1.9 | 0.6 | 1.6 | -8.1 | -10.0 |
| Inner Mongolia | 2.7 | 6.3 | -5.0 | -8.7 | -12.6 | -20.9 | -12.5 | -24.1 | -20.3 | -22.1 | -16.5 | -18.0 | -13.6 | -11.8 | -177.3 |
| Liaoning | 9.9 | -5.3 | -13.7 | -3.1 | -1.0 | -4.1 | -4.3 | -3.9 | -6.1 | -12.3 | -8.3 | -11.4 | -9.7 | -6.6 | -79.9 |
| Jilin | 6.7 | -7.4 | 29.7 | -6.7 | -1.2 | -3.9 | -2.8 | -0.6 | -6.8 | -12.4 | -5.4 | -5.4 | -5.9 | -6.6 | -28.5 |
| Heilongjiang | 4.7 | -12.4 | -21.2 | -2.0 | -1.9 | -16.8 | 5.6 | -4.4 | -6.4 | -18.5 | -8.8 | -11.4 | -17.2 | -11.5 | -122.3 |
| Shanghai | -2.2 | -5.1 | -1.6 | 1.3 | -0.9 | -2.2 | -4.4 | -5.9 | 0.0 | -3.1 | -1.9 | -1.8 | -4.3 | -2.2 | -34.2 |
| Jiangsu | -24.8 | 7.6 | 8.3 | 9.1 | -17.5 | -39.0 | -37.3 | -26.3 | -21.6 | -20.4 | -12.1 | -12.4 | -13.6 | -11.4 | -211.2 |
| Zhejiang | -3.8 | -2.9 | -1.3 | -6.3 | -8.0 | -13.2 | -11.3 | -9.9 | -12.7 | -12.2 | -4.7 | -5.7 | -7.7 | -3.8 | -103.7 |
| Anhui | -8.1 | 4.8 | -8.9 | -51.0 | 2.1 | -9.8 | 3.4 | -12.3 | -9.2 | -11.2 | -18.7 | 2.9 | -13.0 | -12.3 | -141.3 |
| Fujian | -11.5 | -1.0 | -7.0 | -5.0 | -6.0 | -8.2 | -6.6 | -6.0 | -5.6 | -8.0 | -5.8 | -5.0 | -9.1 | -5.0 | -89.9 |
| Jiangxi | -20.2 | -0.4 | 5.8 | -3.0 | -6.2 | -11.4 | -5.8 | -2.8 | -1-.6 | -112.2 | -16.5 | -17.1 | -15.8 | 16.2 | -199.9 |
| Shandong | -11.6 | -9.6 | -14.8 | -9.9 | -17.3 | -16.2 | -11.1 | -14.1 | -7.0 | -17.4 | -9.4 | -11.3 | -12.0 | -9.3 | -171.0 |
| Henan | 0.0 | -0.1 | -8.1 | -9.4 | -5.7 | -21.4 | 5.1 | -5.4 | -66.2 | -14.8 | -1.3 | -4.8 | -9.5 | -8.1 | -149.6 |
| Hubei | -16.3 | -17.0 | -7.4 | -4.5 | -10.4 | 2.2 | -0.7 | -4.3 | -7.1 | -10.3 | -4.7 | -7.2 | -11.1 | -9.2 | -107.9 |
| Hunan | -14.6 | -6.6 | -6.9 | -11.1 | -9.1 | -4.1 | 2.3 | -2.5 | -20.7 | -18.7 | -12.6 | -12.8 | -15.5 | -11.4 | -144.3 |
| Guangdong | -11.4 | -10.1 | -29.7 | -18.2 | -18.3 | -32.3 | -25.4 | -24.2 | -24.5 | -25.0 | -11.2 | -6.1 | -16.5 | -11.3 | -264.0 |
| Guangxi | -3.8 | 3.1 | 1.5 | -6.9 | -2.6 | -14.0 | -9.8 | 1.7 | -6.0 | -9.6 | -9.6 | -12.6 | -14.6 | -9.6 | -92.8 |
| Hainan | 1.5 | 2.4 | 1.8 | 1.5 | 0.5 | -0.2 | -0.9 | -2.2 | 0.6 | -2.9 | -0.5 | -1.6 | -3.6 | -2.0 | -5.6 |
| Chongqing | -0.3 | -0.8 | 1.1 | 0.6 | 0.0 | -0.1 | 0.3 | 0.1 | 0.0 | 1.5 | 1.3 | 0.8 | 0.3 | -0.4 | 4.6 |
| Sichuan | -6.0 | -0.8 | -4.2 | -8.1 | -3.4 | -2.5 | -3.6 | -2.1 | -8.4 | -10.9 | -6.7 | -4.9 | -10.0 | -11.0 | -82.7 |
| Guizhou | -3.4 | -2.9 | -3.0 | -3.1 | -2.9 | -1.6 | -2.6 | -2.5 | -6.1 | -6.8 | -1.8 | -3.9 | -4.4 | -9.1 | -54.0 |
| Yunnan | 5.5 | 0.4 | 4.0 | -1.5 | -2.5 | -1.6 | -3.2 | -0.3 | -4.2 | -4.7 | -0.3 | -5.7 | -7.6 | -5.8 | -27.6 |
| Tibet | -0.9 | -0.4 | 1.3 | -0.4 | 2.5 | -2.1 | -8.3 | -3.9 | -1.1 | -1.7 | -1.2 | -2.8 | -15.1 | -2.5 | -36.5 |
| Shaanxi | 1.5 | -3.4 | -0.3 | -3.3 | -2.2 | -2.3 | -0.7 | -1.9 | -3.4 | -6.6 | -4.3 | -5.1 | -5.2 | -3.7 | -40.8 |
| Gansu | -3.3 | -7.5 | -4.4 | -0.2 | -0.1 | -1.6 | -1.1 | -3.0 | -11.7 | -7.4 | -1.4 | -4.5 | -5.3 | -5.7 | -57.2 |
| Qinghai | -1.2 | -1.6 | -2.3 | -0.3 | -1.7 | -0.8 | -1.7 | -1.3 | -0.8 | -2.2 | -0.6 | -1.3 | -1.5 | -1.9 | -19.2 |
| Ningxia | 3.7 | -4.8 | -15.4 | -4.7 | -2.2 | -8.1 | -12.2 | -1.1 | -5.3 | -5.1 | -3.0 | -3.3 | -4.1 | -4.2 | -69.9 |
| Xinjiang | -3.7 | -56.9 | -29.0 | -32.7 | -15.9 | -9.5 | -24.7 | -19.8 | -24.2 | -23.4 | -20.0 | -14.2 | -31.0 | -26.4 | -331.4 |
The authors have declared that no competing interests exist.
| 1 |
|
| 2 |
|
| 3 |
|
| 4 |
|
| 5 |
|
| 6 |
|
| 7 |
|
| 8 |
|
| 9 |
|
| 10 |
|
| 11 |
|
| 12 |
|
| 13 |
|
| 14 |
|
| 15 |
|
| 16 |
|
| 17 |
|
| 18 |
|
| 19 |
|
| 20 |
|
| 21 |
|
| 22 |
|
| 23 |
|
| 24 |
|
/
| 〈 |
|
〉 |