Orginal Article

Disturbance impacts of land use change on biodiversity conservation priority areas across China: 1990-2010

  • ZHAO Guosong , 1, 2 ,
  • LIU Jiyuan , 1, * ,
  • KUANG Wenhui 1 ,
  • OUYANG Zhiyun 3 ,
  • XIE Zhenglei 4
Expand
  • 1. Key Laboratory of Land Surface Pattern and Simulation, Institute of Geographic Sciences and Natural Resources Research, CAS, Beijing 100101, China
  • 2. University of Chinese Academy of Sciences, Beijing 100049, China
  • 3. Research Center for Eco-Environmental Sciences, CAS, Beijing 100085, China
  • 4. Key Laboratory of Education Ministry for Poyang Lake Wetland and Watershed Research, School of Geography and Environment, Jiangxi Normal University, Nanchang 330022, China

*Corresponding author: Liu Jiyuan, Professor, E-mail:

Author: Zhao Guosong (1986-), PhD, specialized in the study of land use and land cover change (LUCC) and its environmental effects. E-mail:

Received date: 2014-10-20

  Accepted date: 2014-11-18

  Online published: 2015-05-15

Supported by

National Key Basic Research Program of China, No.2014CB954302

National Science-technology Support Plan Project of China, No.2013BAC03B04

Copyright

Journal of Geographical Sciences, All Rights Reserved

Abstract

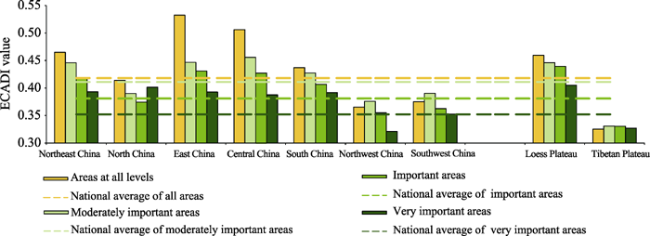
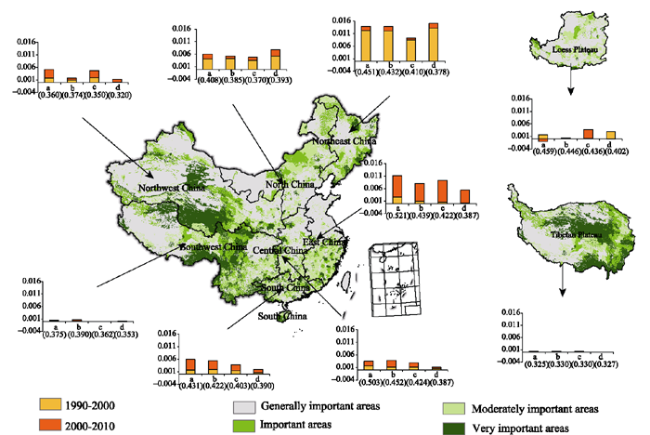
Land use change is one of the main drivers of biodiversity loss. In the last 20 years, China’s land use pattern has undergone profound changes. This study constructs an Ecosystem Comprehensive Anthropogenic Disturbance Index (ECADI) to assess disturbance impacts of land use change between 1990 and 2010 on biodiversity conservation priority areas at national and regional scales. Four levels of biodiversity conservation areas were categorized: generally important areas, moderately important areas, important areas, and very important areas. The results indicated a higher ECADI value in 2010 in Central and Eastern China than in Western China, and the values of the moderately important, important and very important regions were lower than the average value of the whole country at all levels. Notably, in recent 20 years, the change extent of ECADI values in Central and Eastern China were much greater compared with that in Western China, and ECADI values in the moderately important, important and very important biodiversity conservation areas all showed increasing trends, with the increasing extent lower than that of whole China at all levels. Due to human activities such as urbanization in Eastern China and cropland reclamation in Northeast China and Xinjiang, ECADI values showed a medium increase trend (the change rate was about 1%-5% in 10 years), which indicated the need for more conservation efforts in those regions. However, ECADI values in the Loess Plateau presented a low decline trend (the change rate was about -1% to -0.1% in 10 years) after 2000 because of the obvious effectiveness of Green for Grain Project. Furthermore, the variation was negligible in the Tibetan Plateau.

Cite this article

ZHAO Guosong , LIU Jiyuan , KUANG Wenhui , OUYANG Zhiyun , XIE Zhenglei . Disturbance impacts of land use change on biodiversity conservation priority areas across China: 1990-2010[J]. Journal of Geographical Sciences, 2015 , 25(5) : 515 -529 . DOI: 10.1007/s11442-015-1184-9

1 Introduction

Ecosystems such as forests, grasslands, and wetlands provide habitats for wildlife species. With an explosive increase in the extent and intensity of human activities, species habitats are being threatened by human activities such as urbanization, industrialization, farmland reclamation, climate change, and invasive species (Falcucci et al., 2007; Ficetola et al., 2010; Magura et al., 2004; Oliver et al., 2014; Ortega-Álvarez et al., 2009; Pekin et al., 2012; Pereira et al., 2010; Wei et al., 2014). As ecosystems sustain ever increasing pressure, endangered species and resources are in a state of continuous loss. Biodiversity conservation has received much attention in international and domestic governmental and research arenas. In April 2012, based on the Convention on Biological Diversity and other relevant international treaties and agreements, an Intergovernmental Platform on Biodiversity and Ecosystem Services (IPBES) was established (Turnhout et al., 2012). It is hoped that this will succeed in garnering a similar level of global scientific authority and policy influence for biodiversity compared with that garnered for climate change by the Intergovernmental Panel on Climate Change (IPCC). In the Chinese context of biodiversity protection activities, a series of administrative planning initiatives were developed and implemented. These include the Chinese nature reserve planning outline (1996-2010), the China biodiversity conservation strategy and action plan (2011-2030), and the national environmental protection planning of the 12th Five-Year Plan. These have all played a positive role in strengthening biodiversity research and conservation in China (Ma et al., 2012; Xu et al., 2009). Additionally, China has established a dedicated national council for biodiversity conservation that is responsible for overall coordination of national biodiversity conservation activities (http://www.zhb.gov.cn/ztbd/rdzl/sdwyh/), and for guiding Chinese activities during the United Nations Decade on Biodiversity.
Land use/land cover change (LUCC) is the most direct manifestation of the impacts of human activities on natural ecological systems on the Earth’s land surface (Mooney et al., 2013). It is the main process leading to fragmentation and loss of effective habitats for species, as well as the primary driving factor that threatens biodiversity (de Chazal et al., 2009; Haines-Young, 2009; Wei et al., 2014). LUCC effects can be reclassified into a set of pressures exerted on biodiversity. These include agricultural intensification, land abandonment, forestation, deforestation, drainage, and urbanization (Gerard et al., 2010; Başnou et al., 2013). Reidsma et al. (2006) assessed land use intensity and related biodiversity in agricultural landscapes of the EU-25 countries for the year 2000. Moreover, they used ecosystem quality calculations to explore future trends based on the four EURURALIS scenarios extending up to 2030. Falcucci et al. (2007) have examined changes in land use/land cover patterns in Italy, and their implications for biodiversity conservation. Accordingly, they have suggested that increased efforts should be made to protect Mediterranean-type forests and scrublands, as well as traditional agricultural practices. Wang et al. (2007) analyzed the vascular plant diversity of Beijing along an urban-suburban-rural gradient, and recommended improving the structure and ecological function of green spaces in urban region, preserving as much remnant natural habitats in the suburban region, and restricting the rural tourism and establishing a biosphere reserve in the exurban region. Newmark et al. (2011) conducted a multispecies analysis of the impact of habitat fragmentation on avian nest survival within an Afrotropical understory bird community. They found that maintaining large continuous forests is important for enhancing nest survival for Afrotropical understory birds.
China, which is the most populous country on Earth, also has one of the largest territories, and ranks among the richest countries for its biodiversity (Liu et al., 2003). However, as elsewhere, China’s biodiversity is subject to numerous pressures. During the last 20 years, with further expansion of the national economy and social development, China’s land use pattern has undergone profound changes. The area of cropland change has decreased in the south and increased in the north, and the reclaimed cropland gravity has shifted from the northeast to the northwest. Built-up land areas have rapidly expanded, mainly in eastern China, and have gradually spread to Central and Western China. Woodland first decreased and then increased, while grassland has continued to decrease (Li et al., 2010; Liu et al., 2014a). The purpose of this paper is to assess the disturbance impacts of land use changes between 1990 and 2010 on different categories of biodiversity conservation priority areas at national and regional scales by constructing an Ecosystem Comprehensive Anthropogenic Disturbance Index (ECADI). This would provide valuable scientific information for the study of biodiversity conservation and related topics.

2 Data and methods

2.1 Land use data

In the late 1990s, Liu et al. (2005) constructed a nation-wide land use database for China at a scale of 1:100,000, primarily by using Landsat TM/ETM+ satellite remote sensing data. In this classification scheme, there are six first-class land use types: farmland, woodland, grassland, water bodies, built-up land, and unused land. Moreover, there are 55 second-class land use types such as paddy fields, dry land, lakes, streams, and rivers (Liu et al., 2005; Zhang et al., 2012). This database has been updated every 5 years using the same information sources and the same methods of data interpretation. To date, through the consistent use of the same methods, a national 1:100,000 vector land use database and a 1 km gridded database of component classifiers have been completed for 1990, 1995, 2000, 2005, and 2010. A field survey found that the classification accuracy for each land use type was over 90% (Zhang et al., 2012). In this study, the 1 km grid proportion land use data for 1990, 2000, and 2010 and land use change data during different periods were used for the calculations and analysis described below.

2.2 Data for biodiversity conservation areas at different levels

A total of 2196 indicator species were selected from the national list of protected animals and plants to identify biodiversity conservation priority areas based on a Marxan model (Zhang et al., 2011). The biodiversity conservation areas were classified as four levels: generally important areas, moderately important areas, important areas, and very important areas (Figure 1). According to the evaluation results, very important areas accounted for 15.49% of the total land area, and mainly consisted of the Sanjiang Plain wetlands, the Changbai Mountains, the southern foothills of the Qilian Mountains, the Hengduan Mountains, the eastern Tibetan Plateau, and the southern part of the Three-River Headwaters region. Important areas accounted for 15.58% of the total land area and included the Greater and Lesser Hinggan Mountains, the Hulun Buir Grassland, the Altay region, and the Zoige wetlands. Moderately important areas accounted for 18.36% of the total land area and consisted mainly of the Xilin Gol grassland, the western portion of the Kunlun Mountains, the central wetlands of the Tibetan Plateau, and the Hetao Plain. This study focused on analyzing the status and change extent of disturbance in moderately important, important, and very important biodiversity conservation areas. However, disturbance in generally important areas was not analyzed independently, but was incorporated in the overall status or change trend at all levels.
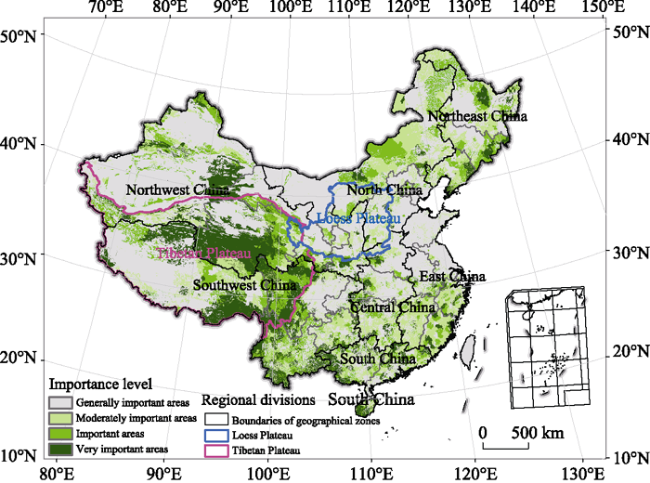
Figure 1 Spatial pattern of biodiversity conservation areas at different levels in China

2.3 Regional divisions

To highlight regional differences in land use change impacting on biodiversity conservation priority areas, the entire country was divided into seven regions. These were: North China, Northeast China, East China, Central China, South China, Northwest China, and Southwest China. North China includes Beijing, Tianjin, Hebei, Shanxi, and Inner Mongolia. Northeast China includes Liaoning, Jilin, and Heilongjiang. East China includes Shandong, Jiangsu, Shanghai, Zhejiang, Anhui, Fujian, Jiangxi, and Taiwan. Central China includes Henan, Hubei, and Hunan. South China includes Guangdong, Guangxi, Hainan, Hong Kong, and Macao. Northwest China includes Shaanxi, Gansu, Qinghai, Ningxia, and Xinjiang. Southwest China includes Chongqing, Sichuan, Guizhou, Yunnan, and Tibet. In addition to the above-mentioned seven geographical zones with their administrative boundaries, the Tibetan and Loess Plateaus were also considered for the analysis as two separate regions with natural boundaries (Figure 1).

2.4 Methods

In a study of land use status in Tibet, Liu (1992) proposed a land use degree model. The model postulated that humans use a variety of different ecosystem types to different degrees. For example, ecosystem types that are difficult to use, such as deserts, are rarely used. However, ecosystem types linked to human living and production needs, such as cropland and built-up areas are frequently used. Ecosystem types such as woodland, grassland, and water bodies are used more frequently than the rarely used types, but less frequently than cropland and built-up areas. In other words, disturbance levels of rarely used ecosystem types are very low, whereas disturbance levels of frequently used ecosystem types, such as cropland and built-up areas, are very high. Similar to the land use degree model, four disturbance levels, based on different levels of disturbance of ecosystem types, were defined and assigned to corresponding ecosystem types (Table 1). As we know, biodiversity conservation areas are rarely distributed in areas with no vegetation or sparse vegetation. Therefore, this paper only considered disturbances of ecosystem types that included vegetation distribution. Specifically, saline areas with halophyte distribution and swamps areas with hygrophilous vegetation distribution, among unused land categories, were included in the analysis. However, other unused land categories along with areas of permanent ice and snow in the first-class category of water bodies were excluded as they had no vegetation or sparse vegetation types. Pixels were regarded as absolutely dominant ecosystem types with no vegetation or sparse vegetation distribution only if pixels were with at least a proportion of 95% for those excluded ecosystem types, which were discarded from our statistics and analysis (Figure 2).
Table 1 Classification categories of the ECADI
Disturbance
classification index
Disturbance levels
0 1 2 3
Ecosystem types Saline, swamp Woodland, grassland, water
(snow and ice excluded)
Cropland Built-up
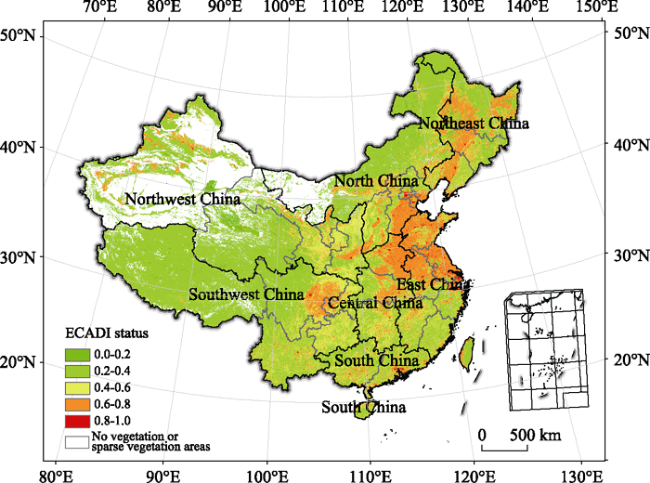
Figure 2 Distribution of ECADI status in 2010
A particular area often included a variety of ecosystem types of different area proportions and disturbance levels (Zhuang et al., 1997). Therefore, weighted summation was carried out to obtain a total value ranging from 0 to 3. The total value was then standardized to 0-1 as follows:
where Ai is the disturbance classification index of ecosystem type i, Pi is the area proportion of ecosystem type i, and D is the ECADI value with a range from 0-1. A higher ECADI value indicated a higher level of human disturbance, and consequently a higher threat to biodiversity conservation. It was expected that when the anthropogenic disturbance index value rose during different periods in the same area, this also indicated a rising threat to biodiversity conservation.
The ECADI change extent and change intensity were used to describe the change trend. The change extent was defined as the change value of ECADI within a certain period of time, and the change intensity was defined as the change ratio of ECADI in ten years. They were calculated as follows:
where Di and Dj are ECADI values during years i and j. E(i, j) is the change extent of ECADI values during the period from year i to year j. R(i, j) is the change intensity of ECADI values during the period from year i to year j. To further refine the description of the change trend of the disturbance index in a certain region, seven categories of change intensity types were delineated according to the change intensity of ECADI values. These were: high decline, medium decline, low decline, negligible change, low increase, medium increase, and high increase (Table 2).
Table 2 Categories of change intensity types
Change intensity (%) Change intensity types
<-5 High decline
-5 to -1 Medium decline
-1 to -0.1 Low decline
-0.1 to 0.1 Negligible change
0.1 to 1 Low increase
1 to 5 Medium increase
>5 High increase

3 Results

3.1 ECADI status in 2010

As shown in Figure 2, the ECADI status in 2010 was reclassified as five classes at equidistant intervals. It can be clearly seen that large urban agglomerations such as the Beijing-Tianjin-Tangshan region, the Yangtze River Delta region, and the Pearl River Delta region showed the highest ECADI values, indicating the highest levels of anthropogenic disturbance. Key areas of agricultural development, such as the Huang-Huai-Hai Plain, the Northeast China Plain, the Sichuan Basin, and the Hetao Plain showed the second highest values. ECADI values for forest, grassland, and wetland regions, such as the Greater and Lesser Hinggan Mountains, the Changbai Mountains, the Inner Mongolian Plateau, the Tibetan Plateau, the Poyang Lake, the Dongting Lake, the Taihu Lake and the Qinghai Lake, were relatively low. It is evident that ECADI can clearly depict levels of ecosystem anthropogenic disturbance, and that a change in the ECADI value reflects a change in the level of anthropogenic disturbance exerted on the ecosystem, thus reflecting a threat to biodiversity conservation.
The national average ECADI value at all levels of biodiversity conservation was 0.418. As shown in Figure 3, ECADI values of moderately important areas, important areas, and very important areas were less than the national average value. In descending order, they were moderately important areas (0.411), important areas (0.381) and very important areas (0.352). ECADI values at all levels of importance for the seven geographical zones were, in descending order: East China, Central China, Northeast China, South China, North China, Southwest China, and Northwest China. Among these zones, ECADI values for East and Central China were more than 0.5, and values for Northeast China, South China, and North China were more than 0.4. Values for Southwest and Northwest China were the lowest. Regarding the very important areas, the highest disturbance value was obtained for North China, followed by Northeast China, with the lowest value obtained for Northwest China. Among the important areas, the highest disturbance value occurred for East China, followed by Central China. As in the case of very important areas, the lowest value occurred for Northwest China. Among moderately important areas, the highest disturbance value was obtained for Central China, followed by East China, with Northwest China once again demonstrating the lowest value.
The anthropogenic disturbance values in the Loess Plateau were higher than the corresponding national averages, whereas the converse was true for the sparsely populated Tibetan Plateau. The descending order for different conservation levels in Loess Plateau matched the national situation (Figure 3). However a different situation was evident in the Tibetan Plateau where disturbance values were higher for moderately important and important areas compared with the regional overall value, and almost the same as the regional overall value for very important areas.

3.2 Change trends of ECADI during different periods on a pixel scale

To more clearly display regional differences in ECADI value changes during the last 20 years, the original resolution of 1 km was aggregated to a resolution of 10 km using the mean technique (Figure 4). During the period from 1990 to 2000, the phenomenon of farmland reclamation in the Northeast China Plain was very common, causing a relatively large increase in the disturbance level. A high increase trend of ECADI values was reflected in parts of this region. Farmland reclamation also occurred in parts of Xinjiang, and the ECADI value showed the same trend as in the Northeast China Plain. Moreover, urban expansion had mainly occurred in the eastern part of China. Disturbance values for regions such as East China, and parts of North and South China showed a relatively large increase, with parts of these areas, especially metropolitan residential areas, also showing a trend of high increase. During 2000-2010, China’s eastern coastal provinces were subjected to a new round of urban expansion (Liu et al., 2014a), resulting in a greater increase in the disturbance level compared with the period from 1990-2000. Metropolitan areas showed a similar high increase trend. As a result of the shift in reclaimed cropland gravity from the northeast to the northwest, larger parts of Xinjiang showed a clear high increase trend. Conversely, the disturbance level in parts of the Shaanxi-Gansu-Ningxia region showed a declining trend because of the implementation of the ecological Grain for Green Project.
Figure 3 ECADI values at a regional scale in China in 2010
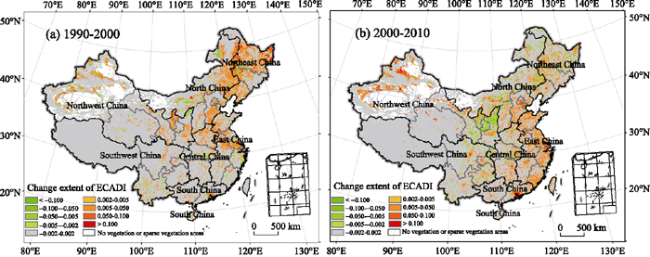
Figure 4 Change extent of ECADI values during different periods on a pixel scale

3.3 Change trend of ECADI during different periods on a regional scale

3.3.1 Overall change trend of areas at all levels of importance
During both periods from 1990 to 2000 and from 2000 to 2010, the national average value of ECADI increased by approximately 0.003 and there was a low increase trend. From 1990 to 2000, values for all seven geographical zones increased. In descending order, these were: Northeast China, North China, East China, Northwest China, South China, Central China, and Southwest China (Figure 5). As previously discussed, because of extensive farmland reclamation the disturbance value for Northeast China increased the most, showing a medium increase trend. The disturbance value for North China also showed a medium increase trend because of urban sprawl. However, in Southwest China, the change extent of the disturbance value was very small, showing a negligible change trend. Additionally, the four other regions showed a low increase trend. Moreover, the Loess Plateau showed a low increase trend, while the change trend in the Tibetan Plateau was negligible. During the period from 2000 to 2010, the change extent of disturbance values for the seven geographical zones were, in descending order: East China, South China, Northwest China, North China, Central China, Northeast China, and Southwest China. The lowest rate of change was still found in Southwest China where the change trend was negligible. However, because of a higher urban expansion rate during the period from 2000 to 2010, compared with the period from 1990 to 2000, and a shift in the cropland reclamation gravity from the northeast to the northwest, East China showed a change to a medium increase trend and Northeast China showed a change to a low increase trend. Moreover, the four other regions showed a low increase trend. Because of the implementation of the Green for Grain Project during this period, disturbance values in the Loess Plateau showed a low decline trend. The disturbance value for the Tibetan Plateau showed a minor increase and a low increase trend.
Figure 5 Change extent of ECADI values in biodiversity conservation areas at different levels during different periods on a regional scale (a. Areas at all levels; b. Areas at moderately important level; c. Areas at important level; d. Areas at very important level; and Numbers such as 0.451 with brackets represent ECADI value in 1990)
At the national level, during the period from 1990 to 2010, the change extent of ECADI at all levels of importance was approximately 0.0055, showing a low increase trend. In the seven geographical zones, disturbance values in Northeast and East China indicated a medium increase trend, with the value for Southwest China showing a trend of negligible change, and the values for the remaining four zones showing a low increase trend. The change trend for both Northeast and North China shifted from a medium increase trend in 1990-2000 to a low increase trend in 2000-2010, indicating that the increase in disturbance after 2000 was less than the increase in disturbance before 2000. However, East China’s change trend shifted from a low increase trend in 1990-2000 to a medium increase trend in 2000-2010, indicating that the more recent increase in disturbance after 2000 exceeded the increase which occurred before 2000. Over the last 20 years in the Loess Plateau, the change trend of the disturbance value shifted from a low increase trend in 1990-2000 to a low decline trend in 2000-2010, while showing a low increase trend over the last 20 years. Moreover, in the Tibetan Plateau, the change trend showed negligible change in 1990-2010. However, the more recent increase in disturbance after 2000 exceeded the increase which occurred before 2000, with a change trend from negligible change to a low increase.
3.3.2 Change trend of very important conservation areas
During both periods from 1990 to 2000 and from 2000 to 2010, the national average ECADI value in very important biodiversity conservation areas increased by about 0.001, and a low increase trend was observed. During the period from 1990 to 2000, the change extent in the disturbance values for the seven zones were, in descending order: Northeast China, North China, South China, Central China, East China, Northwest China, and Southwest China. Among these zones, Northeast China and North China showed the highest change extent, both showing medium increase trend as that for the overall change trend. The disturbance values for South and Central China indicated a low increase trend, while the remaining three zones indicated negligible change trend. The Loess and Tibetan Plateaus matched the overall change trend, showing a low increase trend and a negligible change trend, respectively. During the period from 2000 to 2010, values for the seven zones in descending order were: East China, North China, Northeast China, South China, Northwest China, Central China, and Southwest China, with all seven zones matching the overall change trend. The value for the Loess Plateau in 2010 was lower than the value in 2000, but the extent of the decrease was very low, showing a negligible change trend. Conversely, the value for the Tibetan Plateau was greater in 2010 than in 2000. However, the extent of the increase was also very low, showing a similar negligible change trend (Figure 5).
At the national level, during the period from 1990 to 2010, the change extent of ECADI in very important biodiversity conservation areas was more than 0.002, indicating a trend of low increase. Regarding the seven zones, the disturbance value for Northeast China indicated a medium increase trend, while the value for Southwest China indicated negligible change, and values for the remaining five zones indicated a low increase trend. Types of change trend in Northeast and North China, before and after 2000, were the same as the overall change trend, indicating that the more recent increase in disturbance in very important biodiversity conservation areas after 2000 was lower than the increase before 2000. However, the change trend in East China shifted from a negligible change trend to a medium increase trend, exerting more pressure on biodiversity conservation. During the last 20 years, the change trend for the disturbance value in the Loess Plateau shifted from a low increase trend in 1990-2000 to a negligible change trend in 2000-2010, which was beneficial for biodiversity conservation. For the Tibetan Plateau, a trend of negligible change over the last 20 years was observed.
3.3.3 Change trend of important conservation areas
During both periods from 1990 to 2000 and from 2000 to 2010, the national average ECADI value in important biodiversity conservation areas increased by about 0.002, which was twice the change extent occurring in very important conservation areas, and also indicative of a low increase trend. During the period from 1990 to 2000, the ECADI values in the seven zones were, in descending order: Northeast China, North China, Northwest China, South China, Central China, East China, and Southwest China. Among these zones, the disturbance value of Northeast China indicated a medium increase trend with the highest change extent, the disturbance value of Southwest China indicated negligible change trend, and the remaining five zones indicated a low increase trend. The Loess and Tibetan Plateaus both showed a negligible change trend. However, during the period from 2000 to 2010, the change extent in disturbance values in the seven zones were, in descending order: East China, Northwest China, South China, Central China, North China, Northeast China, and Southwest China, with the change trend in all seven zones matching the overall change trend. The disturbance value for the Loess Plateau indicated a low increase trend, while the value for the Tibetan Plateau indicated a negligible change trend (Figure 5).
At the national level, during the period from 1990 to 2010, the change extent of ECADI in important biodiversity conservation areas was more than 0.004, indicating a trend of low increase. The change trend of the seven zones was the same as that for the overall change trend. As for the change trend in areas at all levels, a similar shift occurred in Northeast and East China. During the past 20 years, the change trend regarding the disturbance value in the Loess Plateau shifted from a negligible change trend in 1990-2000 to a low increase trend in 2000-2010, indicating an overall low increase trend over the entire period. In the Tibetan Plateau, there has been a trend of negligible change during the last 20 years.
3.3.4 Change trend of moderately important conservation areas
During both periods from 1990 to 2000 and from 2000 to 2010, the change extent of the national average ECADI value in moderately important conservation areas was greater than that for very important and important conservation areas. The national average value of moderately important areas increased by 0.003 during the period from 1990 to 2000 (the change extent was almost three times that of very important areas), and by 0.002 during the period from 2000 to 2010 (the change extent was almost double that of very important areas). During the period from 1990 to 2000, values in the seven zones were, in descending order: Northeast China, North China, South China, Central China, Northwest China, East China, and Southwest China. The change trend for these zones was the same as the overall change trend. The Loess and Tibetan Plateaus showed a negligible change trend. During the period from 2000 to 2010, the change extent of disturbance values in the seven zones were, in descending order: East China, South China, Central China, Northeast China, North China, Northwest China, and Southwest China. The value for East China indicated a medium increase trend, while the remaining six regions also indicated a low increase trend. The values of the Loess and Tibetan Plateaus indicated a negligible change trend (Figure 5).
At the national level, during the period from 1990 to 2010, the change extent of ECADI in moderately important biodiversity conservation areas was about 0.0051, indicating a low increase trend. In the seven zones, the change trend was the same as that for very important areas. Types of change trend, before and after 2000, were almost the same as the overall change trend excluding Southwest China. The values for the Loess and Tibetan Plateaus indicated a negligible change trend during the last 20 years.

4 Discussion

4.1 The main impacts of land use changes on biodiversity conservation across China

During the period from 1990 to 2010, urbanization, cropland reclamation, afforestation, and grassland recovery resulting from the implementation of large ecological projects, such as the Green for Grain Project, were the main impacts of land use change on China’s biodiversity conservation. Urbanization mostly occurred in East China with an accelerating rate during the last 20 years. From 2000-2010, the increase of the built-up land area in East China was about 2.55 times the increase from 1990 to 2000. It is notable that the expanded area of built-up land with less vegetation distribution was mainly converted from semi-natural cropland, thus exerting considerable pressure on biodiversity conservation (Li et al., 2010; McDonald et al., 2008; Seto et al., 2012; Wang et al., 2007). Cropland reclamation mostly occurred in Northeast and Northwest China. In these two regions, cropland mainly increased during the period from 1990 to 2000, and the increase area is about 3.87 times that occurred from 2000 to 2010. The phenomenon of cropland reclamation was widespread in Northeast China, and newly increased cropland resulted from the exploitation of woodland, grassland, and wetland. Consequently, a rapid decline in waterfowl and plant species—with the loss and fragmentation of natural wetlands and wetland ecosystem degradation attributed to farmland development—has been observed in the Small Sanjiang Plain in Northeast China (Liu et al., 2004). After the implementation of the Green for Grain Project in the Loess Plateau, there was an evident increase in woodland and grassland resulting from the conversion primarily of sloping cropland (with slopes greater than 25°). Large-scale ecological conservation and reconstruction projects have inhibited further shrinking of natural forest areas and have also partially inhibited degradation of natural grassland (Liu et al., 2014a; et al., 2012). To some extent, this would have benefited biodiversity conservation.

4.2 Limitations of this study

In this study, only area changes of different land use types because of human-induced land use changes were taken into account. However, habitat fragmentation resulting from land use change is also an important disturbance factor, and a primary cause of species loss (Baral et al., 2014; Li et al., 2010; Newmark et al., 2011). Habitat fragmentation results in a reduction in area, an increase in remnant isolation, the creation of edge, and an alteration in the habitat structure of the remnants, all of which may contribute either directly or indirectly to changes in species survival (Newmark et al., 2011). There are also other disturbance factors such as multiple cropping intensity, levels of fertilizer and pesticide use in cropland, and grassland management systems (Grondin et al., 2013; Kleijn et al., 2009; Kuemmerle et al., 2013; Tao et al., 2008; Vačkář et al., 2012; Yan et al., 2013). Different patterns of cropping intensity or land use management systems would exert varying pressure on local biodiversity.
In contrast to studies that analyze direct relations between land use change and species richness and losses (Liu et al., 2014b; Ortega-Álvarez et al., 2009; Pekin et al., 2012), this research has indirectly analyzed the influence of land use change on biodiversity conservation through the construction of an ECADI. This reflects the threat to biodiversity conservation posed by land use activities. It is expected that the greater the recent increase in disturbance, the greater the threat to the conservation of local biodiversity. However, the question of whether recently increased disturbance or recently decreased disturbance causes species loss or richness requires further in-depth study.
In addition, several planning projects have been implemented in recent years. These include “Planning of the National Main Functional Areas”, “National Ecological Functional Regionalization” and “Planning of the National Nature Reserves” (Wang et al., 2014). Biodiversity conservation priority areas selected for this study were based on a Marxan model, and were categorized into four levels based on expert knowledge. Disturbances caused by human activities in functional areas and nature reserves with known boundaries, mainly for biodiversity conservation, also deserve further study.

5 Conclusions

Considering the influences of land use activities on biodiversity conservation services for different ecosystems, an ECADI was constructed to assess disturbance impacts of land use change between 1990 and 2010 on biodiversity conservation priority areas at national and regional scales. Main conclusions of this research are summarized as follows:
(1) In 2010, the ECADI value was higher in Central and Eastern China than in Western China, while ECADI values in regions of varying importance levels from moderate to very important were lower than the national average value at all levels. Therefore, the study showed that China’s current spatial pattern of land development is matched by the spatial distribution of biodiversity conservation areas categorized by levels of importance, and this correlation contributes to the overall layout of national biodiversity conservation.
(2) Over the past 20 years, national biodiversity conservation areas, including moderately important, important, and very important levels, have all shown trends of a low increase in ECADI values, and the ratio of the change extent for these three levels was 2.5:2:1. Moreover, the extent of the increase for the three levels was lower than the extent of the overall increase at the national level. Therefore, the regional spatial pattern for the change extent of ECADI also matched the spatial distribution of biodiversity conservation areas at different levels of importance. To some extent, this can be attributed to the implementation of various ecological protection policies and measures.
(3) Northeast China, East China, North China, and the Loess Plateau are the main areas experiencing disturbance relating to land use change on biodiversity conservation priority areas in the past 20 years. The change trend in disturbance values in Northeast and North China has shifted from a medium increase trend to a low increase trend, indicating a lower increase in more recent disturbance caused by land use changes after 2000. The change trend in the disturbance value in East China has conversely shifted from a low to a medium increase trend, indicating a greater increase in more recent disturbance caused by land use change after 2000, which need more biodiversity conservation efforts. In the Loess Plateau, following the implementation of the Grain for Green Project after 2000, the overall change trend in this region indicates a decreasing trend, especially for very important conservation areas, which is beneficial for biodiversity protection.

The authors have declared that no competing interests exist.

1
Baral H, Keenan R J, Sharma S Ket al., 2014. Spatial assessment and mapping of biodiversity and conservation priorities in a heavily modified and fragmented production landscape in north-central Victoria, Australia.Ecological Indicators, 36: 552-562.

2
Başnou C, Álvarez E, Bagaria Get al., 2013. Spatial patterns of land use changes across a Mediterranean metropolitan landscape: Implications for biodiversity management.Environmental Management, 52(4): 971-980.

3
De Chazal J, Rounsevell M D A, 2009. Land-use and climate change within assessments of biodiversity change: A review.Global Environment Change, 19(2): 306-315.

4
Falcucci A, Maiorano L, Boitani L, 2007. Changes in land-use/land-cover patterns in Italy and their implications for biodiversity conservation.Landscape Ecology, 22(4): 617-631.

5
Ficetola G F, Maiorano L, Falcucci Aet al., 2010. Knowing the past to predict the future: Land-use change and the distribution of invasive bullfrogs.Global Change Biology, 16(2): 528-537.

6
Gerard F, Petit S, Smith Get al., 2010. Land cover change in Europe between 1950 and 2000 determined employing aerial photography.Progress in Physical Geography, 34(2): 183-205.

7
Grondin P, Gauthier S, Borcard Det al., 2013. A new approach to ecological land classification for the Canadian boreal forest that integrates disturbances.Landscape Ecology, 29(1): 1-16.

8
Haines-Young R, 2009. Land use and biodiversity relationships.Land Use Policy, 26: S178-S186.

9
Kleijn D, Kohler F, Baldi Aet al., 2009. On the relationship between farmland biodiversity and land-use intensity in Europe.Proceedings of the Royal Society B: Biological Sciences, 276(1658): 903-909.

10
Kuemmerle T, Erb K, Meyfroidt Pet al., 2013. Challenges and opportunities in mapping land use intensity globally.Current Opinion in Environmental Sustainability, 5(5): 484-493.

11
Li TA, Shilling F, Thorne Jet al., 2010. Fragmentation of China’s landscape by roads and urban areas.Landscape Ecology, 25(6): 839-853.

12
Liu H Y, Zhang S K, Li Z Fet al., 2004. Impacts on wetlands of large-scale land-use changes by agricultural development: The Small Sanjiang Plain, China.AMBIO, 30(6): 306-310.

13
Liu J G, Ouyang Z Y, Pimm S Let al., 2003. Protecting China's biodiversity.Science, 300: 1240-1241.

14
Liu J Y, 1992. Land Use in the Tibet Autonomous Region. Beijing: Science Press. (in Chinese)

15
Liu J Y, Kuang W H, Zhang Z Xet al., 2014a. Spatiotemporal characteristics, patterns, and causes of land-use changes in China since the late 1980s.Journal of Geographical Sciences, 24(2): 195-210.

16
Liu J Y, Liu M L, Tian H Qet al., 2005. Spatial and temporal patterns of China’s cropland during 1990-2000: An analysis based on Landsat TM data.Remote Sensing of Environment, 98(4): 442-456.

17
Liu Y H, Rothenwöhrer C, Scherber Cet al., 2014b. Functional beetle diversity in managed grasslands: Effects of region, landscape context and land use intensity.Landscape Ecology, 29: 529-540.

18
Lü Y H, Fu B J, Feng X Met al., 2012. A policy-driven large scale ecological restoration: Quantifying ecosystem services changes in the Loess Plateau of China.PloS One, 7(2): e31782.

19
Ma J Z, Rong K, Cheng K, 2012. Research and practice on biodiversity in situ conservation in China: Progress and prospect.Biodiversity Science, 20(5): 551-558. (in Chinese)

20
Magura T, Tóthmérész B, Molnár T, 2004. Changes in carabid beetle assemblages along an urbanisation gradient in the city of Debrecen, Hungary.Landscape Ecology, 19(7): 747-759.

21
McDonald R I, Kareiva P, Forman RTT, 2008. The implications of current and future urbanization for global protected areas and biodiversity conservation.Biological Conservation, 141(6): 1695-1703.

22
Mooney H A, Duraiappah A, Larigauderie A, 2013. Evolution of natural and social science interactions in global change research programs.PNAS, 110(Suppl. 1): 3665-3672.

23
Newmark W D, Stanley T R, 2011. Habitat fragmentation reduces nest survival in an Afrotropical bird community in a biodiversity hotspot.PNAS, 108: 11488-11493.

24
Oliver T H, Morecroft M D, 2014. Interactions between climate change and land use change on biodiversity: Attribution problems, risks, and opportunities.Wiley Interdisciplinary Reviews: Climate Change, 5(3): 317-335.

25
Ortega-Álvarez R, MacGregor-Fors I, 2009. Living in the big city: Effects of urban land-use on bird community structure, diversity, and composition.Landscape and Urban Planning, 90(3/4): 189-195.

26
Pekin B K, Pijanowski B C, 2012. Global land use intensity and the endangerment status of mammal species.Diversity and Distributions, 8(9): 909-918.

27
Pereira H M, Leadley P W, Proenca Vet al., 2010. Scenarios for global biodiversity in the 21st century.Science, 330(6010): 1496-1501.

28
Reidsma P, Tekelenburg T, van den Berg Met al., 2006. Impacts of land-use change on biodiversity: An assessment of agricultural biodiversity in the European Union.Agriculture, Ecosystems & Environment, 114(1): 86-102.

29
Seto K C, Guneralp B, Hutyra L R, 2012. Global forecasts of urban expansion to 2030 and direct impacts on biodiversity and carbon pools.PNAS, 109(40): 16083-16088.

30
Tao L, Ma K, Ni H Wet al., 2008. Variation in species composition and diversity of wetland communities under different disturbance intensity in the Sanjiang plain.Acta Ecologica Sinica, 28(5): 1893-1900.

31
Turnhout E, Bloomfield B, Hulme Met al., 2012. Conservation policy: Listen to the voices of experience.Nature, 488: 454-455.

32
Vačkář D, Chobot K, Orlitová E, 2012. Spatial relationship between human population density, land use intensity and biodiversity in the Czech Republic.Landscape Ecology, 27(9): 1279-1290.

33
Wang G M, Jiang G M, Zhou Y Let al., 2007. Biodiversity conservation in a fast-growing metropolitan area in China: A case study of plant diversity in Beijing.Biodiversity and Conservation, 16(14): 4025-4038.

34
Wang W J, Zheng H, Xu Cet al., 2014. Spatial correlation and ecological characteristics analysis of management area for biodiversity conservation and relevant regionalization.Chinese Geographical Science, 24(1): 71-82.

35
Wei F W, Nie Y G, Miao H Xet al., 2014. Advancements of the researches on biodiversity loss mechanisms.Chinese Science Bulletin, 59(6): 430-437. (in Chinese)

36
Xu H G, Tang X P, Liu J Yet al., 2009. China's progress toward the significant reduction of the rate of biodiversity loss.BioScience, 59(10): 843-852.

37
Yan H G, Xiao X M, Huang H Qet al., 2013. Multiple cropping intensity in China derived from agro-meteorological observations and MODIS data.Chinese Geographical Science, 24(2): 205-219.

38
Zhang L, Ouyang Z Y, Xiao Yet al., 2011. Priority areas for biodiversity conservation in Hainan Island: Evaluation and systematic conservation planning.Chinese Journal of Applied Ecology 22(8): 2105-2112. (in Chinese)

39
Zhang Z X, Zhao X L, Wang X, 2012. Land Use Remote Sensing Monitoring in China. Beijing: Star Map Press. (in Chinese)

40
Zhuang D F, Liu J Y, 1997. Study on the model of regional differentiation of land use degree in China.Journal of Resources, 12(2): 105-111. (in Chinese)

Outlines

/