Orginal Article

Comprehensive analysis of changes to catchment slope properties in the high-sediment region of the Loess Plateau, 1978-2010

  • ZHOU Xu , 1, 2 ,
  • YANG Shengtian , 1, * ,
  • LIU Xiaoyan 3 ,
  • LIU Changming 4, 5 ,
  • ZHAO Changsen 1 ,
  • ZHAO Haigen 1 ,
  • ZHOU Qiuwen 1 ,
  • WANG Zhiwei 1
Expand
  • 1. State Key Laboratory of Remote Sensing Science, School of Geography, Beijing Normal University, Beijing Key Laboratory for Remote Sensing of Environment and Digital Cities, Beijing 100875, China
  • 2. School of Land and Resource, China West Normal University, Nanchong 637009, Sichuan, China
  • 3. Yellow River Conservancy Commission, Zhengzhou 450003, China
  • 4. College of Water Science, Beijing Normal University, Beijing 100875, China
  • 5. Key Laboratory of Land Cycle and Surface Processes, CAS, IGSNRR, CAS, Beijing 100101, China

*Corresponding author: Yang Shengtian (1965-), PhD and Professor, specialized in application of RS in water resources and eco-environment. E-mail:

Author: Zhou Xu (1981-), Associate Professor, specialized in application of RS in water resources and eco-environment. E-mail:

Received date: 2014-05-30

  Accepted date: 2014-09-08

  Online published: 2015-04-15

Supported by

National Key Technologies R&D Program, No.2012BAB02B00

Public Welfare Foundation of the Ministry of Water Resources, No.201101037

The Fundamental Research Funds for the Central Universities

Copyright

Journal of Geographical Sciences, All Rights Reserved

Abstract

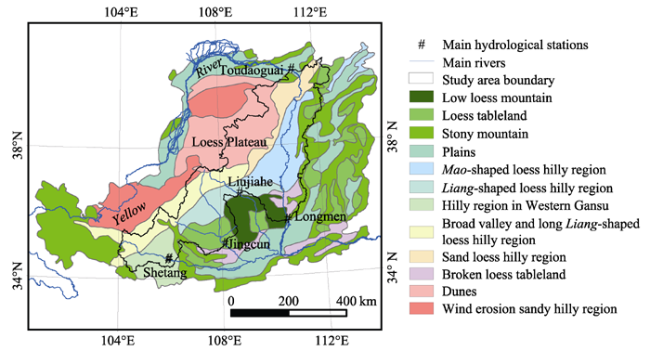
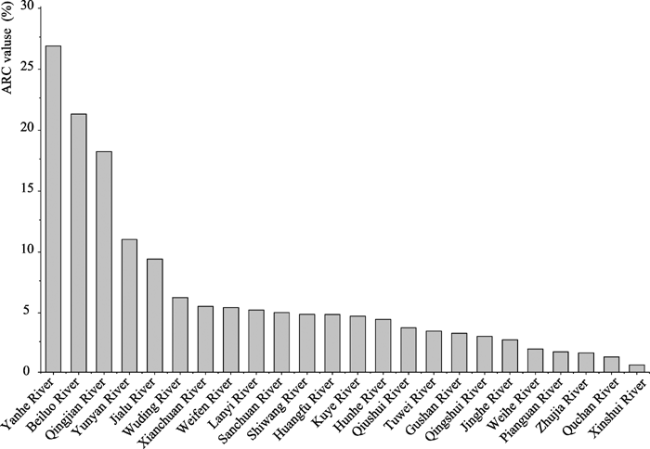
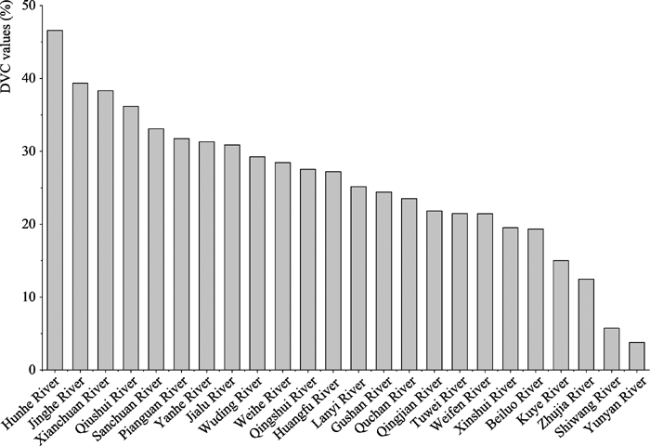
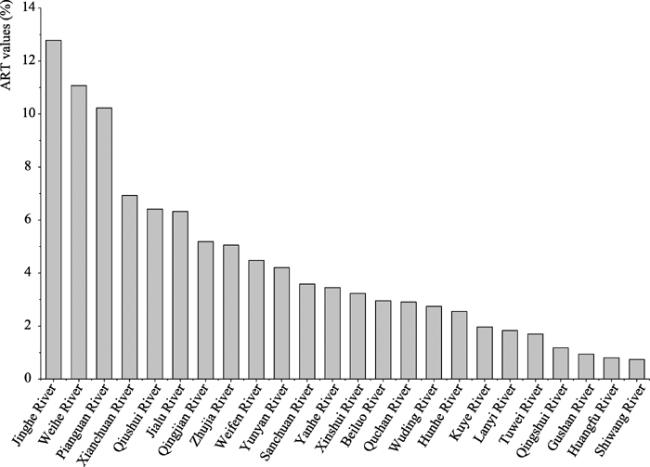
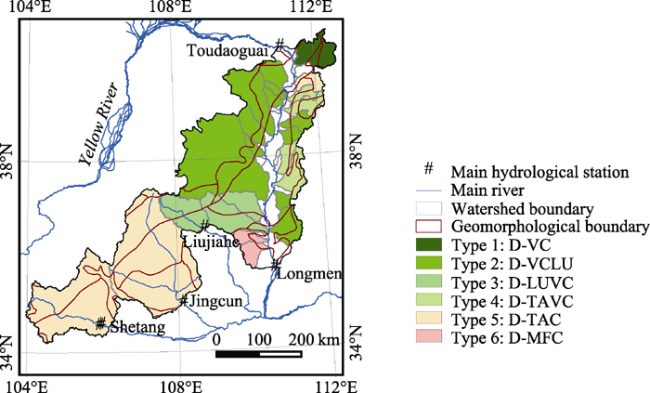
To control soil erosion and restore the degraded environment in the Loess Plateau, a large number of measures related to soil and water conservation have been employed that have profoundly affected catchment properties. This study constructed three indicators to characterize changes to the catchment slope, proposed both a method for a regression analysis of adjacent images and a sequence model, and applied multisource remotely sensed images and GIS spatial clustering analysis technologies to extract thematic information and comprehensively analyze the catchment change characteristics. The results indicate that the catchment slope properties changed significantly. At catchment scale, the average values of ARC, DVC and ART were 6.43%, 25.57% and 4.30%, respectively. There were six clustering types of catchment slope property changes. The maximum and minimum of the average similarities of the clustering types were 0.992 and 0.935. Each slope control measures had a distinct effect on catchment slope; the dominating factor of each clustering type was identified as: Type 1: D-VC, Type 2: D-VCLU, Type 3: D-LUVC, Type 4: D-TAVC, Type 5: D-TAC and Type 6: D-MFC. Type 5 and Type 1 covered the largest areas, respectively occupying 37.28% and 31.01%. Catchment slope property changes also had distinct types that depended on their geomorphological conditions. These findings provide a useful basis from which to further study catchment slope hydrological and soil erosion processes.

Cite this article

ZHOU Xu , YANG Shengtian , LIU Xiaoyan , LIU Changming , ZHAO Changsen , ZHAO Haigen , ZHOU Qiuwen , WANG Zhiwei . Comprehensive analysis of changes to catchment slope properties in the high-sediment region of the Loess Plateau, 1978-2010[J]. Journal of Geographical Sciences, 2015 , 25(4) : 437 -450 . DOI: 10.1007/s11442-015-1179-6

1 Introduction

The physical properties of a catchment, such as geologic substrate, topography (e.g., slope, aspect), soil type/depth, vegetation, and landscape patchiness, have long been known to influence runoff generation and sediment yield (Yang et al., 2001; Shankar et al., 2002; Roderick et al., 2011; Fenicia et al., 2014). For a given catchment, many of the properties, especially the geologic and topographic properties, will remain nearly constant over decadal to century time scales. Vegetation and landscape patchiness, however, can change significantly over this same time scale.
A rigorous understanding of the catchment water cycle and sediment yield process requires an understanding of catchment change characteristics. Catchment river networks in the Loess Plateau are in topologic and geometric equilibrium (Willett et al., 2014). Its catchment properties are mainly affected by changes in soil and water conservation and the resulting change to micro-geomorphology, land use and vegetation coverage (Fu et al., 1994). Since the 1970s, a number of soil and water conservation measures that seek to control slope, such as terrace building, tree planting and the sowing of grass, and that seek to control channel, such as the building of check dams, have been carried out in the plateau (Chen et al., 2007; Zhao et al., 2013). Particularly since 2000, a large number of programs to convert farmland to forestland or grassland have been implemented in China, and diverse catchment properties have been affected by unprecedented land use change and comprehensive catchment management (Wang et al., 2010; Jiao et al., 2012).
Catchment slope is the major source of soil erosion in the Loess Plateau. Slope control measures involving soil and water conservation have profoundly affected catchment slope and in turn have affected the relationship between runoff and sediment (Fu, 2005; Nyssen et al., 2010). The average efficiencies of level terraces on soil and water conservation are 86.7% and 87.7%, respectively (Wu et al., 2004). But spatial differences between terraces in building quality and soil and water conservation efficiencies exist (Ran et al., 2008). Tree plantings and grass sowing together with the construction of terraces have had a positive effect on the environment (Zha and Tang, 2003). But there are regional classification differences between countries in approaches to the conversion of farmland to forestland or grassland (Peng et al., 2002), and spatial differences in slope revegetation effects (Xu and Tian, 2002). As of 2005, 11.42 million hm2 of area has been planted with trees, and grass has been sown on 0.35 million hm2 in the Loess Plateau (Zhou et al., 2012). Terrace construction, tree planting and grass sowing have become the most important components of the comprehensive catchment management system, and are the major driving factors in catchment slope changes. Several runoff and sediment research projects of the Ministry of Water Resources of the People’s Republic of China have studied the amount of change and the soil and water conservation efficiencies of each component at plot scale (Kang et al., 2004; Chen et al., 2007). However, little attention has been paid to comprehensive catchment slope property changes and their spatial differences at regional scale. Further study is thus needed to rigorously support the simulation of catchment slope hydrological and soil erosion processes.
This study has two primary objectives. First, we construct three indicators to characterize the dynamic changes in soil and water conservation slope control measures. Second, the three indicators and their corresponding thematic data are used to comprehensively analyze the changes in catchment slope properties and their spatial differences from 1978 to 2010.

2 Study area

The high-sediment region of the Loess Plateau is the primary sediment source of the Yellow River Basin; about 85% of the Yellow River Basin sediment was produced there (Liu et al., 2014). The region is situated between 103°57′1″E to 112°39′50″E and 34°12′35″N to 40°36′46″N (Figure 1), with a total area of 187,000 km2, which covers the region between the Toudaoguai and Longmen hydrological stations on the Yellow River, the upstream region of Beiluo River from Liujiahe station, the upstream region of Jinhe River from Jincun station, and the upstream region of Weihe River from Shetang station. This region is characterized by dramatic geomorphological variations, which deeply influence soil erosion and become the background conditions for soil and water conservation (Lu et al., 2002). The region’s major geomorphological types include wind-eroded sandy hilly regions, stony mountains, broad valleys and long Liang-shaped loess hilly regions, plains, dunes, sand loess hilly regions, Mao-shaped loess hilly regions, Liang-shaped loess hilly regions, broken loess tableland, loess tableland, low loess mountains, and hilly regions in western Gansu. Its average annual precipitation varies from 300 to 650 mm and nearly 80% of the precipitation is dominated by rainstorms that occur during the rainy season, from June to September (Luo et al., 2014).
Figure 1 Location of the study area and the distribution of the different geomorphologic types

3 Materials

DEM, remotely sensed images, regional thematic maps and statistical data were used for this study. The 30-m ASTER GDEM was produced by NASA of the US, downloaded from the Geospatial Data Cloud (http://www.gscloud.cn), and used to extract catchment boundaries and slope information.
Remotely sensed images include HJ-CCD, ZY3-CCD, Landsat-MSS and KH-11. The 30-m HJ-CCD and 2.1-m ZY3-CCD fusion images were produced by the China Center for Resources Satellite Data and Application (http://www.cresda.com). HJ-CCD images were acquired from 2010 to 2011, and used to interpret land use information and retrieve vegetation coverage information in 2010. ZY3-CCD images were acquired from 2010 to 2011, and used to interpret effective terrace distribution information in 2010. The 56-m Landsat-MSS and 3.0-m KH-11 images were produced by NASA of the US. Landsat-MSS images were acquired from 1978 to 1979, and used to interpret land use information and retrieve vegetation coverage information in 1978. KH-11 images were acquired from 1977 to 1978, and used to interpret effective terrace distribution information in 1978.
Diverse thematic maps of the Loess Plateau include a 2000 land-use map, a soil type distribution map, a soil and water conservation zoning map, and a geomorphological type distribution map. The 1:100,000 land-use map for the year 2000 was produced by the Institute of Geographic Sciences and Natural Resources Research, and used as a reference to interpret land-use information. The 1:1,000,000 soil type distribution map was produced by Institute of Soil Science, and used as a reference to retrieve vegetation coverage information. The 1:2,500,000 soil and water conservation zoning map was produced by the Yellow River Conservancy of the Ministry of Water Resources of the People’s Republic of China. The 1:500,000 geomorphological type distribution map was produced by the Chinese Academy of Geological Sciences. Both of these were used as reference to comprehensively analyze the catchment slope changes and their spatial differences.
Statistical data include the first bulletin of water conservancy in China and basic information on soil and water conservation in the Yellow River Basin. The former was published by the Ministry of Water Resources of the People’s Republic of China. The latter was collected by the Upper and Middle Yellow River Bureau. Both were used as references to interpret and recognize effective terrace change information.

4 Methodology

4.1 Three indicators that characterize slope control measure changes

An analysis of catchment changes driven by soil and water conservation measures requires rational indicators and reliable information. This study used three indicators to characterize slope control changes from three aspects: land use area change, average vegetation coverage change, and cumulative changes to effective terraces.
(1) The area ratio of conversion of farmland to forestland or grassland
Farmland converted to forestland or grassland is the major land use change type in the Loess Plateau (Zhou et al., 2012). The area ratio of conversion of farmland to forestland or grassland (ARC) was used to quantify forestland and grassland area change on each catchment slope from 1978 to 2010. For a given catchment, ARC was calculated using the following formula:
where ARCi is the area ratio of conversion of farmland to forestland or grassland for the ith catchment; ACi is the area of conversion of farmland to forestland or grassland for the ith catchment; Ai is the total area of the ith catchment. The higher the value of ARC, the more intense the conversion of farmland to forestland or grassland, and vice versa.
(2) The difference of average vegetation coverage
Vegetation coverage change is the most significant change in surface landscape in the Loess Plateau (Xin et al., 2008). The difference of average vegetation coverage (DVC) was used to characterize positive vegetation coverage change on each catchment slope from 1978 to 2010. For a given catchment, DVC was obtained from the following formula:
where DVCi is the difference in average vegetation coverage for the ith catchment; AVC2010i is the average vegetation coverage of the ith catchment in 2010; AVC1978i is the average vegetation coverage of the ith catchment in 1978. The greater the value of DVC, the faster positive vegetation coverage change, and vice versa.
(3) The area ratio of cumulative effective terraces
Terraces can effectively stop or reduce soil erosion if they are well planned, correctly constructed and properly maintained (Van and Bruijnzeel, 2003). The area ratio of cumulative effective terraces (ART) was used to reveal terracing practices for effective soil and water conservation on each catchment slope from 1978 to 2010. For a given catchment, ART was evaluated using the following formula:
where ARTi is the area ratio of cumulative effective terrace for the ith catchment; CET2010i is the cumulative effective terrace area of the ith catchment in 2010; Ai is the total area of the ith catchment. The bigger the value of ART, the more effective cumulative terraces are, and vice versa.

4.2 Slope control measure information extraction and validation

(1) Interactive interpretation of land use
Based on the land-use classification standard of China (GB/T21010-2007), land use in the study area was classified into 6 types and 24 subtypes (Table 1). By reference to the 2000 land-use map, catchment slope, aspect and geomorphological types, images of HJ-CCD and Landsat-MSS, and the man-computer interactive visual interpretation method (Yang and Zhu, 2000), were used to extract land-use change information from 1978 to 2010.
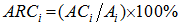
Table 1 Land-use classification system
Types Subtypes
Farmland Mountain paddy, hilly paddy, paddy plain areas, mountainous upland, hilly upland,
upland plains area
Forestland Forest, shrub, open woodland, other woodland
Grassland High coverage grassland, medium coverage grassland, low coverage grassland
Water body Canals, reservoirs, lakes, beaches
Construction land Urban construction land, rural residential land, industrial and communications
construction land
Unused land Sandy desert, gobi desert, bare land, gravel ground
Three field verifications were carried out to assess the accuracy of remote sensing thematic information extraction. Over 30% of the region with no land-use change was verified. In situ visual information, multidisciplinary expertise and local residents’ knowledge were used to assess land-use interpretation accuracy. The results showed that 178 effective sampling points were correctly interpreted, with an average accuracy of 89.0%.
(2) Quantitative retrieval of vegetation coverage
The Normalized Difference Vegetation Index (NDVI) was strongly correlated with vegetation growth, vegetation coverage and leaf area index. NDVI could eliminate remotely sensed irradiation errors to some extent. The dimidiate pixel model based on NDVI (Carlson and Ripley, 1998), as the following function, was used to retrieve vegetation coverage.
where VC is vegetation coverage; NDVIsoil is the NDVI of soil without any vegetation; NDVIveg is the NDVI of surface fully covered with vegetation; NIR is the reflectivity of the near-infrared band; R is the reflectivity of the red band.
Since the study area is relatively large, several scenes of images acquired at different times are needed to fully cover it. We proposed an adjacent images regression analysis method to eliminate the temporal difference of adjacent NDVI images. For an original NDVI image, this method can be described by the following formula:
(5)
Where is the corrected image data matrix of the ith NDVI image; imagei is the ith original image data matrix, the first original image is generally thought to be best, and the next adjacent image has an overlapping area with the former; ki-1 and Qi-1 are respectively the slope and intercept of regression analysis of the two overlapping areas of the adjacent images; n is the total number of images.
Reasonable values of NDVIsoil and NDVIveg are the key to retrieving vegetation coverage. We counted the NDVI change frequency of each soil type, and the NDVI value of the cumulative frequency of 5% was selected as NDVIsoil. We also counted the NDVI change frequency of forest and high coverage grassland, and the NDVI value of the cumulative frequency of 95% was selected as NDVIveg.
The vegetation coverage retrieval accuracy was assessed using the method described above. The results showed that 173 effective sampling points in the region with no vegetation coverage change were correctly retrieved, with an average accuracy of 86.5%.
(3) Comparative recognition of effective terraces
Effective terraces stop or reduce soil erosion by reshaping micro-geomorphology. They are small man-made landscapes, and their recognition requires high-resolution remotely sensed images. The 2010 effective terraces were identified from ZY3-CCD images that were compared with the First National Water Census Bulletin in 2011. The 1978 effective terraces were identified from KH-11 images that were compared with the statistical data provided by the Upper and Middle Yellow River Bureau.
The accuracy of the identification of effective terraces was also assessed using this method. The results showed that 161 effective sampling points in regions with no changes in effective terraces were correctly identified, with an average accuracy of 80.5%.

4.3 Comprehensive clustering analysis of catchment slope property changes

Catchment slope property changes were primarily driven by the interaction of soil and water conservation measures. We used a comprehensive clustering method to analyze catchment slope change (Köplin et al., 2012). First, a 3-dimensional space graph was used to represent the aggregation and similarity of characteristics of three slope indicators. Second, a Pearson correlation clustering method, as shown in the following formula, was used to quantify the similarity of different catchment slope changes. All catchments were then divided into several clustering types according to their similarities.
where PC(i, i+1) is the Pearson similarity between the ith catchment and the (i+1)th catchment; Zi,j is the standard value of the jth slope control measure of the ith catchment; n is the total number of slope control types.
Third, in order to identify the dominant factor for each clustering type, we proposed a sequence model, shown in the formula below, to evaluate the relative contributions of each slope control measure’s influence on catchment slope property.
where RWi,j is the relative weight of the jth slope control measure to the ith catchment; Si,j is the ascending sequence number of the jth slope control measure to the ith catchment. The greater the value of RWi,j, the more important the jth slope control measure to the ith catchment, and vice versa.

5 Results and analysis

5.1 Characteristics of each slope control measure changes

(1) Characteristics of conversion of farmland to forestland or grassland
Using the 2010 and the 1978 land-use interpreted information, the values of ARC were obtained by the GIS spatial overlay analysis method (Figure 2). The ARC values for the Yanhe River, Beiluo River and Qingjian River were the greatest. They were greater than 15%, and respectively reached 26.76%, 21.18% and 18.10%. Meanwhile, the ARC values of the Xinshui River, Quchan River and Zhujia River were the smallest. They were smaller than 2%, and respectively reached 0.61%, 1.26% and 1.59%. The average ARC value for all catchments was 6.43%. Overall, a significant amount of conversion of farmland to forestland or grassland has occurred in this region. But there were considerable differences between catchments in terms of tree plantings and grass sowing.
(2) Characteristics of positive changes to vegetation coverage
Using information retrieved on vegetation coverage in 2010 and 1978, values of DVC were obtained by the GIS spatial statistical analysis method (Figure 3). The DVC values for the Hunhe River, Jinghe River and Xianchuan River were the greatest. They were greater than 35%, and respectively reached 46.59%, 39.34 and 38.31%. Meanwhile, the DVC values for the Yunyan River and Shiwang River were the smallest. They were smaller than 10.0%, and respectively reached 3.79% and 5.74%. The average DVC value for all catchments was 25.57%. Overall, highly significant positive changes in vegetation coverage have taken place in this region. But there were also large differences in revegetation effects for different catchments.
Figure 2 ARC values of different catchments
Figure 3 DVC values of different catchments
(3) Characteristics of cumulative changes in effective terraces
Using data on effective terraces in 2010 and 1978, values of ART were obtained using the GIS spatial overlay and statistical analysis method (Figure 4). The ART values for the Jinghe River, Weihe River and Pianguan River were the greatest. They were greater than 10%, and respectively reached 12.79%, 11.07% and 10.23%. Meanwhile, the ART values for the Shiwang River, Huangfu River and Gushan River were the smallest. They were smaller than 1%, and respectively reached 0.74%, 0.81% and 0.95%. The average ART value for all catchments was 4.30%. A number of terraces have been constructed and maintained in this region, but there were certain quantitative differences in cumulative effective terraces in different catchments.
Figure 4 ART values of different catchments

5.2 Comprehensive clustering of catchment slope property changes

To intuitively present the quantitative relationships between different catchment slopes, a 3-dimensional spatial graph was drawn by OriginPro (Figure 5). In Figure 5, each colored dot represents a catchment. The X-axis represents the values of ARC, the Y-axis represents the values of DVC, and the Z-axis represents the values of ART. The distance between each dot indicates the quantitative characteristics of different catchment slope control measures. There is an obvious dot aggregation or separation phenomenon in this figure. This implies that those aggregative dots have substantially similar characteristics in terms of changes to the control of catchment slope, which further implies that they have roughly analogous catchment change characteristics.
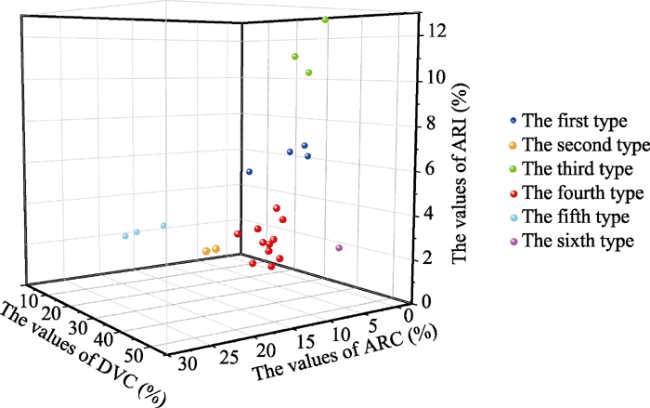
Figure 5 3-dimensional spatial graph of each catchment slope control change
According to Pearson correlation clustering results, there are six clustering types of catchment slope property changes in this region. Each type of catchment slope property changes was caused by a similar strength of catchment slope control change. Different clustering types of catchment slope property changes were caused by different strengths of catchment slope control changes. The first type has the following average values: ARC is 4.34%, DVC is 46.59% and ART is 2.55%; the second type average values are: ARC is 4.82%, DVC is 4.76% and ART is 0.67%; the third type: ARC is 22.01%, DVC is 24.16% and ART is 3.20%; the fourth type: ARC is 3.88%, DVC is 30.02% and ART is 6.24%; the fifth type: ARC is 2.17%, DVC is 33.18% and ART is 11.36%, and the sixth type: ARC is 4.11%, DVC is 24.13% and ART is 1.92%.
The average similarity and a comparison of catchments of different clustering types were presented in Table 2. The typical catchment of the first clustering type is Hunhe River, which has no similar catchment. The typical catchment of the second clustering type is Wuding River, and its similar catchments include Jialu River, Qingshui River, Tuwei River, Gushan River, Lanyi River, Weifen River, Kuye River, Huangfu River, Xinshui River and Quchan River, with an average similarity of 0.992. The typical catchment of the third clustering type is Yanhe River, and its similar catchments include Beiluo River and Qingjian River, with an average similarity of 0.988. The typical catchment of the fourth clustering type is Xianchuan River, and its similar catchments include Sanchuan River, Qiushui River and Zhujia River, with an average similarity of 0.983. The typical catchment of the fifth clustering type is Jinghe River, and its similar catchments include Weihe River and Pianguan River, with an average similarity of 0.975. The typical catchment of the sixth clustering type is Shiwang River, and its similar catchment is Yunyan River, with an average similarity of 0.935. The maximum and the minimum of all the average similarities are 0.992 and 0.935, respectively.
Table 2 Average similarity and comparison of catchments of different clustering types
Number Typical catchment Similar catchment The average
similarity
1 Hunhe River - -
2 Wuding River Jialu River, Qingshui River, Tuwei River, Gushan River, Lanyi River, Weifen River, Kuye River, Huangfu River, Xinshui River, Quchan River 0.992
3 Yanhe River Beiluo River, Qingjian River 0.988
4 Xianchuan River Sanchuan River, Qiushui River, Zhujia River 0.983
5 Jinghe River Weihe River, Pianguan River 0.975
6 Shiwang River Yunyan River 0.935

5.3 Dominant factors in the identification of catchment slope property changes

The slope control measures’ average contributions and geomorphological features for each clustering types were presented in Table 3. For the first clustering type, the average contribution of DVC is 72.29%. Its catchment slope changes were mainly driven by vegetation coverage change, so it was identified as type-1, dominated by vegetation coverage changes (Type 1: D-VC). For the second clustering type, the average contribution of DVC and ARC are 53.52% and 33.96%, respectively. Its catchment slope changes were mainly driven by vegetation coverage and land use changes, so it was identified as type-2, dominated by vegetation coverage and land use changes (Type 2: D-VCLU). For the third clustering type, the average contributions of ARC and DVC are 51.74% and 31.54%, respectively. Its catchment slope changes were mainly driven by land use and vegetation coverage changes, so it was identified as type-3, dominated by land use and vegetation coverage changes (Type 3: D-LUVC). For the fourth clustering type, the average contribution of ART and DVC are 54.33% and 30.98%, respectively. Its catchment slope changes were mainly driven by terraces and vegetation coverage changes, so it was identified as type-4, dominated by effective terrace and vegetation coverage changes (Type 4: D-TAVC). For the fifth clustering type, the average contribution of ART is 67.45%. Its catchment slope changes were mainly driven by effective terraces area changes, so it was identified as type-5, dominated by effective terraces area changes (Type 5: D-TAC). For the sixth clustering type, the average contributions of DVC, ARC and ART are 35.81%, 33.37% and 30.82%, respectively. Its catchment slope property changes were driven by approximately the same intensity of soil and water conservation slope control changes, so it was identified as type-6, dominated by multiple factors interactions (Type 6: D-MFC).
Table 3 Slope control measures’ contributions and geomorphological features of each clustering type
Number DVC contribution ARC contribution ART contribution Dominated
factors
Geomorphological features
1 72.29 14.51 13.20 Vegetation
coverage change
Includes sand loess hilly region, loess tableland and stony mountain
2 53.52 33.96 12.52 Vegetation
coverage and land-use change
Mainly includes dunes, sand loess hilly region, Mao-shaped loess hilly region, stony mountain, broken tableland and broad valley and long Liang-shaped loess hilly region
3 31.54 51.74 16.72 Land-use and vegetation
coverage change
Mainly includes Liang-shaped loess hilly region, Mao-shaped loess hilly region, broad valley and long
Liang-shaped loess hilly region and broken tableland
4 30.98 14.69 54.33 Terrace area and vegetation
coverage change
Includes Mao-shaped loess hilly region, stony mountain and loess tableland
5 20.44 12.11 67.45 Terrace area change Mainly includes Broad valley and long Liang-shaped loess hilly region, Hilly region in the Western Gansu, Loess tableland, Liang-shaped loess hilly region, Stony mountain and Low loess mountain
6 35.81 33.37 30.82 Multiple factors Mainly includes Low loess mountain and Broken tableland
The spatial distribution of different types of catchment slope changes was presented in Figure 6. The Type 1 area occupies 2.98% of the region with severe erosion in the Loess Plateau. Its typical geomorphological features include sand loess hilly region, loess tableland and stony mountain. The Type 2 area occupies 31.01%, and its typical geomorphological features mainly include dunes, sand loess hilly region, Mao-shaped loess hilly region, stony mountain, broken tableland and broad valley and long Liang-shaped loess hilly region. The Type 3 area occupies 10.20%, and its typical geomorphological features include Liang- shaped loess hilly region, Mao-shaped loess hilly region, broad valley and long Liang-shaped loess hilly region and broken tableland. The Type 4 area occupies 5.70%, and its typical geomorphological features include Mao-shaped loess hilly region, stony mountain and loess tableland. The Type 5 area occupies 37.28%, and its typical geomorphological features include broad valley and long Liang-shaped loess hilly region, hilly region in western Gansu, loess tableland, Liang-shaped loess hilly region, stony mountain and low loess mountain. The Type 6 area occupies 2.22%, and its typical geomorphological features include low loess mountain and broken tableland. Due to the lack of 1978 effective terraces information, 10.62% of the Yellow River coastal region has not been analyzed for this study. Overall, according to the local geomorphological conditions, a large number of soil and water conservation measures have been taken in the Loess Plateau, which have resulted in various types of changes in the properties of its catchments.
Figure 6 Spatial distribution of different types of catchment slope property changes

6 Conclusions

This study constructed three indicators, and applied RS and GIS technologies, to extract thematic information and comprehensively analyze changes in catchment slope in the high-sediment region of the Loess Plateau from 1978 to 2010. Three conclusions can be drawn:
(1) Catchment slope properties changed significantly. The changes primarily include a large increase in forestland, grassland and effective terraces, as well as an obvious improvement of vegetation coverage. At catchment scale, the average values of ARC, DVC and ART are 6.43%, 25.57% and 4.30%, respectively. However, undeniable regional differences also exist between catchments.
(2) There were 6 clustering types of catchment slope property changes. Any given type was caused by soil and water conservation slope control changes that were of a similar strength. The variation in types was caused by different strengths in slope control measures. The maximum and minimum of the average similarities of these clustering types were 0.992 and 0.935, respectively.
(3) The dominant factors of different catchment slope change types varied. According to the slope control measures’ average contributions, the dominant factor for each clustering type was identified as: Type 1: D-VC, Type 2: D-VCLU, Type 3: D-LUVC, Type 4: D-TAVC, Type 5: D-TAC and Type 6: D-MFC. The areas of Type 5 and Type 1 are the largest, respectively occupying 37.28% and 31.01%. They also have the most complex geomorphological conditions.
The study analyzed the comprehensive characteristics, dominant factors and spatial differences in catchment slope changes. These findings provide useful information for future regional parameter calibration and validation of hydrological and soil erosion process simulations.

The authors have declared that no competing interests exist.

1
Carlson T N, Ripley D A, 1998. On the relation between NDVI, fractional vegetation coverage, and leaf area index.Remote Sensing of Environment, 62(3): 241-252.

2
Chen L D, Wei W, Fu B Jet al., 2007. Soil and water conservation on the Loess Plateau in China: Review and perspective.Progress in Physical Geography, 31(4): 389-403.

3
Fenicia F, Kavetski D, Savenije H H Get al., 2014. Catchment properties, function, and conceptual model representation: Is there a correspondence?Hydrological Processes, 28: 2451-2467.

4
Fu B J, Gulinck H, 1994. Land evaluation in an area of severe erosion: The Loess Plateau of China.Land Degradation & Rehabilitation, 5: 33-40.

5
Fu B J, Zhao W W, Chen L Det al., 2005. Assessment of soil erosion at large watershed scale using RUSLE and GIS: A case study in the Loess Plateau of China.Land Degradation & Development, 16: 73-85.

6
Jiao J Y, Zhang Z G, Bai W Jet al., 2012. Assessing the ecological success of restoration by afforestation on the Chinese Loess Plateau.Restoration Ecology, 20(2): 240-249.

7
Kang L L, Wang Y Z, Chen J Net al., 2005. Review and evaluation of index systems on water storage and silt detention under the slope measures of soil and water conservation.Science of Soil and Water Conservation, 2(1): 83-88. (in Chinese)

8
Köplin N, Schädler B, Viviroli Det al., 2012. Relating climate change signals and physiographic catchment properties to clustered hydrological response types.Hydrology and Earth System Sciences, 16: 2267-2283.

9
Liu X Y, Yang S T, Dang S Zet al., 2014. Response of sediment yield to vegetation restoration at a large spatial scale in the Loess Plateau.Science China Technological Sciences, 57: 1482-1489.

10
Lu Z C, Chen S F, Yuan B Yet al., 2002. Development stage threshold of watershed landforms in Loess Plateau and separation of erosion mechanism.Journal of Geographical Sciences, 12(1): 81-90.

11
Luo Y, Yang S T, Zhao C Set al., 2014. The effect of environmental factors on spatial variability in land use change in the high-sediment region of China’s Loess Plateau.Journal of Geographical Sciences, 24(5): 802-814.

12
Nyssen J, Clymans W, Descheemaeker Ket al., 2010. Impact of soil and water conservation measures on catchment hydrological response: A case in north Ethiopia.Hydrological Processes, 24: 1880-1895.

13
Peng W Y, Zhang K L, Li S C, 2002. Studies of the regional classification about returning farmland to forests or grassland on the Loess Plateau.Journal of Natural Resources, 17(4): 438-443. (in Chinese)

14
Ran D C, Luo Q H, Zhou Z Het al., 2008. Sediment retention by check dams in the Hekouzhen-Longmen section of the Yellow River.International Journal of Sediment Research, 23: 159-166.

15
Roderick M L, Farquhar G D, 2011. A simple framework for relating variations in runoff to variations in climatic conditions and catchment properties.Water Resources Research, 47(12): 1-11.

16
Shankar U, Pearson C P, Nikora V Iet al., 2002. Heterogeneity in catchment properties: a case study of Grey and Buller catchments, New Zealand.Hydrology and Earth System Sciences, 6(2): 167-183.

17
Van D A I J M, Bruijnzeel L A, 2003. Terrace erosion and sediment transport model: A new tool for soil conservation planning in bench-terraced steeplands.Environmental Modelling & Software, 18: 839-850.

18
Wang S Y, Liu J S, Ma T B, 2010. Dynamics and changes in spatial patterns of land use in Yellow River Basin, China.Land Use Policy, 27: 313-323.

19
Willett S D, McCoy S W, Perron Tet al., 2014. Dynamic reorganization of river basins.Science, 343(7): 1117-1126.

20
Wu F Q, Zhan Y B, Wang J, 2004. Study on the benefits of level terrace on soil and water conservation.Science of Soil and Water Conservation, 2(1): 34-37. (in Chinese)

21
Xin Z B, Xu J X, Zheng W, 2008. Spatiotemporal variations of vegetation coverage on the Chinese Loess Plateau (1981-2006): Impacts of climate changes and human activities. Science in China Series D:Earth Sciences, 51(1): 67-78.

22
Xu Y, Tian J L, 2002. Eco-environmental rehabilitation and spatial differentiation based on enlarging terrace and de-farming in the loess hilly-gully region.Journal of Natural Resources, 17(4): 430-437. (in Chinese)

23
Yang D W, Herath S, Musiake K, 2001. Spatial resolution sensitivity of catchment geomorphologic properties and the effect on hydrological simulation.Hydrological Processes, 15: 2085-2099.

24
Yang S T, Zhu Q J, 2000. Affect of man-computer interactive interpretation method in soil erosion survey of large scale by remote sensing.Journal of Soil and Water Conservation, 14(3): 88-91. (in Chinese)

25
Zha X C, Tang K L, 2003. Eco-environment change and soil erosion process in the reclaimed forestland of the Loess Plateau.Chinese Geographical Science, 13(3): 232-237.

26
Zhao G, Mu X, Wen Zet al., 2013. Soil erosion, conservation, and eco-environment changes in the Loess Plateau of China.Land Degradation & Development, 24: 499-510.

27
Zhou D C, Zhao S Q, Zhu C, 2012. The Grain for Green Project induced land cover change in the Loess Plateau: A case study with Ansai county, Shanxi province, China.Ecological Indicators, 23: 88-94.

Outlines

/