Orginal Article

The synchronicity and difference in the change of suspended sediment concentration in the Yangtze River Estuary

  • YANG Yunping , 1, 2 ,
  • DENG Jinyun , 2, * ,
  • ZHANG Mingjin 1 ,
  • LI Yitian 2 ,
  • LIU Wanli 1
Expand
  • 1. Key Laboratory of Engineering Sediment, Tianjin Research Institute for Water Transport Engineering, Ministry of Transport, Tianjin 300456, China
  • 2. State Key Laboratory of Water Resources and Hydropower Engineering Science, Wuhan University, Wuhan 430072, China

*Corresponding author: Deng Jinyun (1975-), PhD, E-mail:

Author: Yang Yunping (1985-), PhD, specialized in estuary and coastal evolution and causes. E-mail:

Received date: 2014-10-15

  Accepted date: 2014-11-25

  Online published: 2015-04-15

Supported by

Fund from the Ministry of Science and Technology of China, No.2010CB429002

National Natural Science Foundation of China, No.51209112;No.41331174

Copyright

Journal of Geographical Sciences, All Rights Reserved

Abstract

The sediment discharge from the Yangtze River Basin has a stepwise decreasing trend in recent years. The impounding of the Three Gorges Reservoir exacerbated this decreasing trend and affected the change of the suspended sediment concentration (SSC) in the Yangtze River Estuary through the transmission effect. The SSC data of the Yangtze River Estuary during 1959-2012 showed that: (1) The SSC in the South Branch of the Yangtze River in the estuary and in the off-shore sea area displayed decreasing trends and decreased less towards the sea. At the same time, the difference in decreasing magnitude between SSC and sediment discharge became bigger towards the sea. (2) For the North Branch the preferential flow did not change much but the SSC tended to decrease, which was mainly caused by the decrease of SSC in the South Branch and China East Sea. (3) Due to the decreased runoff and the relatively strengthened tide, the peak area of the SSC in the bar shoal section in 2003-2012 moved inward for about 1/6 longitude unit compared with that in 1984-2002, and the inward-moving distance was in the order of flood season > annual average > dry season. (4) In the inlet of the South Passage, the SSC decreased mainly because the increase caused by resuspension and shore-groove exchange was less than the decrease caused by the sharp SSC decrease in the basin and the sea areas. The reverse was true in the middle section, where the SSC showed an increasing trend. (5) In the inlet of the North Passage, under the combined influence of decreased flow split and sediment split ratios, the decreased SSC in the basin and the sea area and decreased amount of resuspension, the SSC displayed a decreasing trend. In the middle section, because the increased amount caused by sediment going over the dyke was markedly more than the decreased amount caused by external environments, the SSC tended to increase. Holistically, the sharp decrease in sediment discharge caused synchronized SSC decreases in the Yangtze River Estuary. But there were still areas, where the SSC displayed increasing trends, indicating synchronicity and difference in the response of SSC to the sharp decrease in sediment discharge from the basin.

Cite this article

YANG Yunping , DENG Jinyun , ZHANG Mingjin , LI Yitian , LIU Wanli . The synchronicity and difference in the change of suspended sediment concentration in the Yangtze River Estuary[J]. Journal of Geographical Sciences, 2015 , 25(4) : 399 -416 . DOI: 10.1007/s11442-015-1176-9

1 Introduction

It is a global phenomenon that the construction of reservoirs in basins results in the reduction of sediment transport in the lower reaches (Milliman, 1997; Syvitski et al., 2005; Walling, 2006). For example: following the construction of the Aswan Dam and water diversion projects, the sediment discharge from the Nile River in Egypt decreased by approximately 98% (Fanos, 1995); after dams such as the Hoover Dam were constructed, the sediment discharge from the Colorado River in the USA decreased to almost zero (Carriquiry et al., 2001); and after the construction of the Panjiakou Reservoir and the “Luan-to-Jin Water Diversion” Project, the sediment discharge from the Luanhe River in China reduced by 94% (Qian, 1994). Moreover, there are a number of similar cases. The suspended sediment concentrations (SSCs) in the Suisun Bay and the Sacramento-San Joaquin River Delta of the San Francisco Estuary in the USA displayed phased decreasing treads between 1975 and 2010 (Rrin et al., 2013). The SSC in the EMS Estuary of Northern Germany tended to increase in both the periods between 1990 and 2010 (Victor et al., 2014) and 1954 and 2005 (Johan, 2011). Moreover, the SSCs in the maximum turbidity zone of the Elbe Estuary and the Weser Estuary in Germany dropped by 27.2% and 33.0%, respectively (Svenja et al., 2014). In the 11 years following the construction of the Manwan Dam in 1993, the sediment discharge from the Mekong River to the estuary reduced markedly (Fu et al., 2008) and the SSC decreased correspondingly (Kummu et al., 2007; Lu et al., 2006). Since the Alqueva Dam was constructed across the Guadiana River in Portugal, the maximum turbidity zone in the estuary has shifted upstream by 8-16 km (Morais et al., 2009). Dyer (Dyer, 1995) noted that in typical estuaries, relatively high SSCs can be maintained even when the sediment input is low. In summary, due to human activities, the sediment discharges from basins have caused corresponding changes in SSCs in estuary areas.
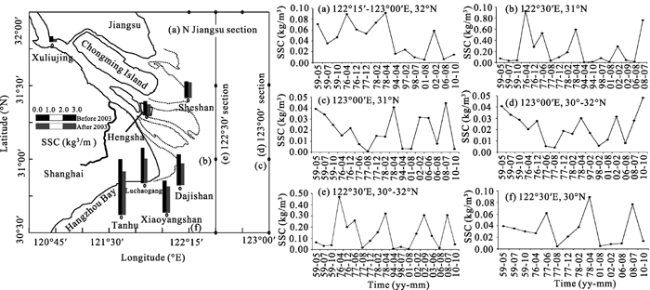
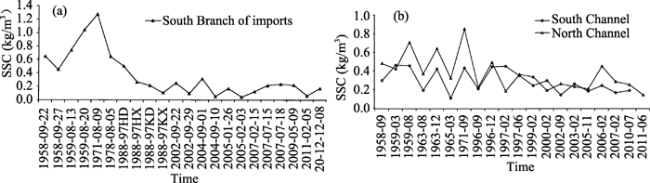
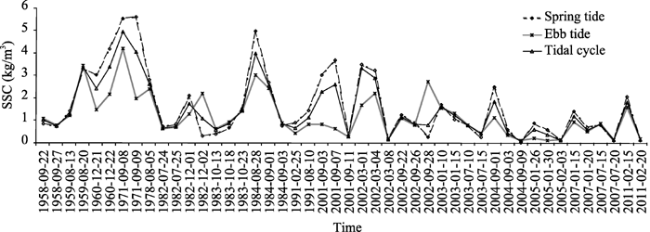
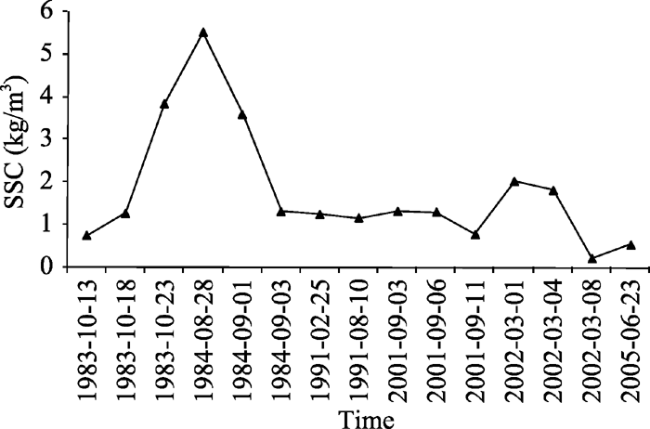
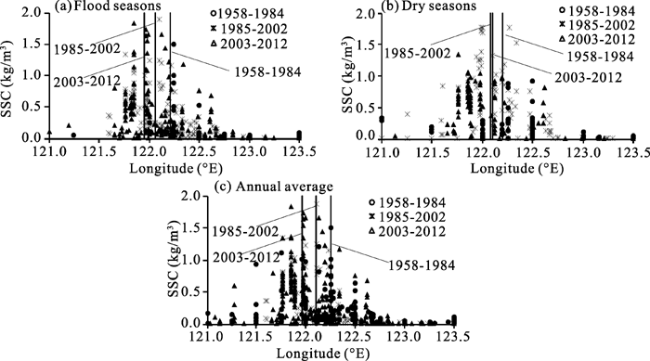
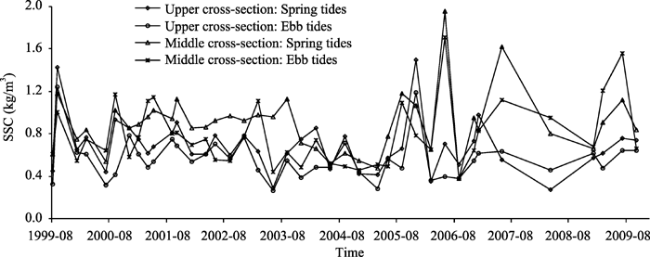
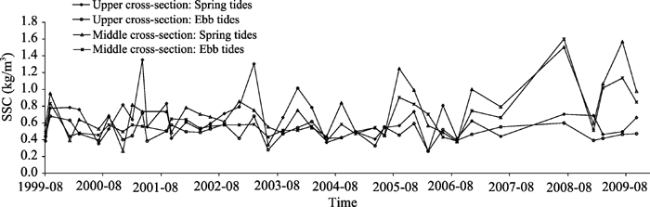
In recent years, human activities in the Yangtze River Basin have increased markedly, while the sediment discharge from the basin has tended to decrease sharply (Dai et al., 2008; Dai et al., 2009). Consequently, the decrease of the incoming sediment is bound to cause changes in the SSC in the estuary area. The measured data have revealed that: the SSC between 2003 and 2005 was clearly lower than that in 1982 (He, 2007); and compared with that in 2003 and before, the SSC in the estuarine coast and the Hangzhou Bay area displayed a decreasing trend in 2009 (Li et al., 2012). The SSCs at Xuliujing, Sheshan, and Hengsha did not reduce between 1998 and 2001, which can be attributed to the resuspension effect (Jin et al., 2006). The SSCs in the flood and dry seasons of 2003 and 2004 did not decrease when compared with their corresponding annual averages (between 1950 and 2002 at the Datong Hydrological Station) (
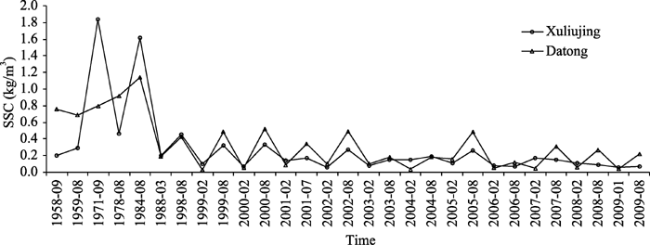
Zhai, 2006). Twenty-two measurements taken between 1959 and 2002 demonstrated that: the SSC in the East China Sea area tended to decrease, and it decreased by a larger magnitude in the offshore area than in the continental shelf area (Pang and Wang, 2004); the SSCs at Xuliujing and the South Branch section respectively decreased from between 0.40 and 0.50 kg/m3 and 0.445 kg/m3 in 2003 before impoundment, to 0.0602 kg/m3 and 0.148 kg/m3 in 2006 after impoundment, while that in the sea area changed little (Zhang, et al., 2007); Dai et al. have elucidated the asynchronous relationship between the decreases of SSCs at the typical observation points in the Yangtze River Estuary and the sharp decrease of sediment discharge (
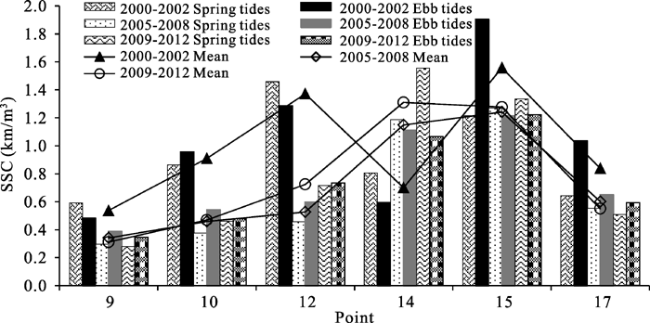
Dai et al., 2013); the average SSC in the Yangshan Port of the East China Sea was 0.75 kg/m3 between 2005 and 2008, decreasing by approximately 16.66% when compared with the 0.90 kg/m3 between 1998 and 2004, and the decrease was related to the volume of the sediment discharge (Zou et al., 2012); when investigating the relationships between the SSC and the runoff volume, sediment volume, tidal range and wave, Li et al. found that the runoff volume and sediment volume, especially the latter, were significantly related to the SSC (Li et al., 2012); and the surface SSC in the Luchao Harbor at the confluence of the Yangtze River Estuary and the Hangzhou Bay tended to decrease between 2002 and 2005 (Zhao, 2006). Twenty remote sensing image data for the period 1989-2008 showed that the SSC in the coastal area decreased between 2006 and 2008 (Bi et al., 2011); fifteen satellite image data for the period 1974-2009 demonstrated that the surface SSC in the estuary decreased by 40%, which concurred well with the sharp decrease in sediment discharge (
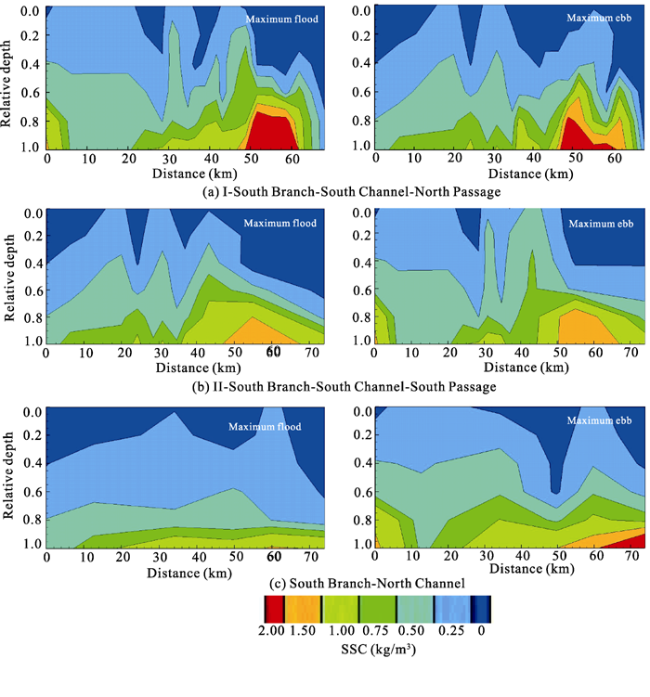
Chen et al., 2012); between 1979 and 2008, the area with a SSC of > 0.70 kg/m3 of the maximum turbidity zone in the estuary tended to shrink, which also concurred well with the sharp decrease of the sediment discharge (Jiang et al., 2013); according to the remote sensing data for the period 2000-2010, the surface SSC in the estuary and the Hangzhou Bay tended to decrease, and decreased by a greater magnitude in flood seasons than in dry seasons (Shen et al., 2013); the SSC in the North Jiangsu area did not exhibit decreasing trends in the spring seasons between 2007 and 2011, which may be related to the suspended sediment discharged from the basin (Zhang et al., 2013). To sum up, under the condition of a sharp decrease in a sediment discharge to the Yangtze River Estuary, whether the SSC in the estuary area will reduce is still a disputed scientific question, and further in-depth studies need to be conducted on the synchronicity and differences between SSC responses in different areas.
In this study, field observation data for more than 60 years between 1950 and 2013 were used to comprehensively investigate the changing process of the SSC in the Yangtze River Estuary, in order to demonstrate the synchronicity and differences between the SSC responses in the estuary when the sediment discharge from the basin decreased sharply. Furthermore the causes of the changes will be discussed.

2 The study area and changes in the hydrological characteristics

2.1 The study area

The Yangtze River Estuary stretches from the Datong Hydrological Station in Anhui Province, China down to the -30 m isobath of the continental shelf. The section from Xuliujing downwards is called the outlet/mouth section, which presents a “three-order-bifurcation- and-four-outlet” bifurcation pattern. The first order bifurcation results in the South and the North Branches. For the South Branch, the inlet cross-section was selected and referred to as the “South Branch inlet”. For the North Branch, the tide station at Qinglonggang in the upper section, and the tide station at Santiaogang in the lower section were chosen. The second order bifurcation led to the South and the North Channels, and thus both the inlet cross-sections were chosen. The third order bifurcation results in the South and the North Passages. For both passages, the cross-sections at the inlet and in the middle were selected. The mouth bar section is between E121°45'-122°30' and N30°45'-31°45'. For the adjacent sea area, cross-sections at N32°00', N30°00', E123°00' and E122°30' were chosen. Measuring line I was along the South Branch-South Channel-North Passage, measuring line II was along the South Branch-South Channel-South Passage, and measuring line III was from the South Branch to the North Channel area. Figure 1 shows the cross-sections chosen.
Figure 1 The location of the Yangtze River Estuary and the study area

2.2 Data source

The data of the water discharge and sediment discharge from the Yangtze River Basin between 1950 and 2013 were taken from the Hydrologic Yearbook for the Yangtze River Basin, which was compiled by the Yangtze River Water Resources Commission. The SSC data for the mouth bar section between 1958 and 2002 were provided by the Institute of Oceanology, Chinese Academy of Sciences, and data for the period 2003-2012 came from field observation or were taken from cited references. The data of the SSCs for the North and the South Passages, which were measured every August between 1999 and 2012 where processes of spring tides, moderate tides and neap tides were witnessed, were provided by the Shanghai Estuarine and Coastal Science Research Center. When the impacts of human activities were discussed based on different time periods, various tide type-runoff combinations were taken into account, which effectively lowered the statistical errors caused by the differences between the runoff-tidal current combinations.

2.3 The hydrological characteristics of the Yangtze River Estuary

The water and sediment discharges from the Yangtze River Basin were represented by those recorded at the Datong Hydrological Station. The water discharge between 1950 and 2013 did not display a clear trend of change. Furthermore, the water discharges in the moderately dry years between 2003 and 2013 decreased by approximately 8.05% compared with those between 1985 and 2002 (Figure 2a). The sediment discharge showed a stepwise decreasing trend, and the impoundment of the Three Gorges Reservoir after 2003 exacerbated the decreasing trend. The stepwise changes of the sediment discharge corresponded to the impoundments of the reservoirs in the basin, and the dividing years of 1968, 1986 and 2003 corresponded to the impoundments of the Danjiangkou Reservoir, the Gezhou Dam, and the Three Gorges Reservoir respectively (Figure 2a). Although the construction of reservoirs in the basin had exacerbated the decreasing trend of the sediment discharge, it was not the only cause. Soil and water conservation in the upper reaches, the river-lake relation change in the middle and lower reaches and sand mining in the river were also important factors (Yang et al., 2006; Wang et al., 2007; Chen et al., 2008).
The tide and wave features at the Lvhuashan were used to represent those at the Yangtze River Estuary. Between 1996 and 2011, the tidal range and mean tide level did not display clear changing trends, while the wave height dropped a little (Figure 2b). The ratio of the tidal range/runoff volume (T/R) was employed to study the hydrodynamic processes of the runoff and tidal current. The T/R tended to increase in the period 1996-2011, suggesting that between 2003 and 2012, the tidal current became stronger relative to the low runoff volume from the basin, and as a result the point where the runoff and tidal current were in hydrodynamic equilibrium moved upstream.
Figure 2 Hydrological characteristics of the Yangtze River Estuary

2.4 The SSC changes in the offshore area of the Yangtze River Estuary

To find out whether the SSC in the offshore area changed after 2003 when compared with that before 2003, data were obtained from the hydrological stations at Xuliujing, Hengsha, Sheshan, Tanhu, Xiaoyangshan and Dajishan. It was found that: the SSC data from Xuliujing Station showed a ~56% decrease; data from Sheshan Station displayed a ~5% decrease; while data from the other stations indicated 20%-30% decreases (Figure 3). As the above stations cannot cover the entire offshore area, more measured data for the period 1959-2010 were utilized. The cross-section at 122°30' was chosen for the mouth bar area, the cross-section at 123°00' for the sea area, the cross-section at 32° for the North Jiangsu area, and the cross-section at 30° section for the Hangzhou Bay area (Figure 3). The additional data showed that between 1959 and 2010, the SSCs at the cross-sections at 122°30' and 123°00' decreased slightly. Moreover, the SSC at the North Jiangsu cross-section tended to decrease. However, as it was approximately one order of magnitude lower than those in the offshore area and the mouth bar section, its changes had little effect on the SSC changes in the offshore area. The SSC at the Hangzhou Bay cross-section changed little and did not show a clear trend. In summary, the SSC in the offshore area of the Yangtze River Estuary decreased slightly.
Figure 3 The SSC changes at the offshore area (1959-2010)

(Note: “before 2003” refers to between 1999 and 2000 for Xuliujing, Hengsha, Sheshan, Dajishan and Xiaoyangshan, and between June 2002 and May 2003 for Luchao Harbor; “after 2003” refers to the period 2008-2009)

To summarize, the distribution of the SSC in the Yangtze River Estuary was influenced by the hydrodynamics of the runoff and tidal current. As the SSC in the sea area was relatively low and its decrease was limited, the SSC in the estuary was created by the volume of sediment discharge from the basin.

3 The SSC changes in the Yangtze River Estuary

3.1 The SSC changes at Xuliujing

The data for the period 1958-2009 showed that the SSC at Xuliujing changed in a similar way as that at Datong Station, i.e., it decreased as the latter decreased rapidly (Figure 4); this indicated that the reduction in the sediment discharge had affected the SSC at Xuliujing due to the transmission effect. When the data were grouped for the three time periods of 1958-1984, 1998-2002 and 2003-2009 (Table 1), it can be seen that the annual mean SSC and the SSC in flood seasons tended to decrease at both Xuliujing and Datong stations, while the SSC in dry seasons changed little at Xuliujing and decreased slightly at Datong. The SSC at Xuliujing and Datong stations decreased by 35.5% and 37.3% respectively between 2003 and 2009 compared with that between 1998 and 2002, and decreased by 56.1% and 53.3% respectively in the flood seasons. Synchronicity was evident between the SSC decreases at Xuliujing and Datong stations.
Figure 4 Secular variation of the SSC at Xuliujing Station
Table 1 The secular variation of the SSC at Xuliujing and Datong stations
Time Flood seasons Dry seasons Annual mean
Xuliujing Datong Xuliujing Datong Xuliujing Datong
1958-1984 0.700 0.859 - - - -
1998-2002 0.310 0.452 0.108 0.074 0.200 0.263
2003-2009 0.140 0.211 0.114 0.064 0.129 0.165

3.2 The SSC changes in the South Branch of the Yangtze River Estuary

The SSC at the inlet of the South Branch showed decreasing trends in the period 1958-2012, with a 69% decrease between 2003 and 2012 compared with that between 1958 and 2002. Moreover, a similar decrease of 66% was found for the same period at Datong Station (Figure 5a). Therefore, there was a good synchronicity between the SSC decrease in the inlet of the South Branch and the sharp SSC decrease at Datong Station. The SSC in the South Channel, the North Channel and Datong Station decreased by 37%, 43% and 62.6% respectively between 2003 and 2011 when compared with the period 1958-2002. The smaller decrease in the SSCs in the South and North channels when compared with those at Datong Station demonstrated that certain differences existed in the synchronic responses (Figure 5b).
Figure 5 Secular variation of the SSC in the South Branch (1958-2012)

3.3 The SSC changes in the North Branch of the Yangtze River Estuary

The mean SSC over a tidal cycle, at the spring tides or ebb tides, tended to decrease at the cross-section of Qinglonggang between 1958 and 2011 (Figure 6). For the same tidal range, the mean SSC over the period 2003-2011 decreased when compared with that over the period 1958-2002 (Figure 7). The SSC at the cross-section of Santiaogang showed a decreasing trend between 1983 and 2005, but the trend was not clear after 1991 (Figure 8). As the diversion ratio of the runoff was less than 5% during the ebb tides, the SSC in the North Branch was mainly controlled by the tidal current. However, the percentage of the predominant current at Qinglonggang and Santiaogang changed little over the years, suggesting a synchronicity between the changes in the runoff volume and tidal current volume in the North Branch, or little change in the hydrodynamics (Yun, 2004). When the hydrodynamics changed little, the provenance bases that sustained the SSC were the basin, the sea area and the resuspension effect. According to the above analyses, the hydrodynamic strengths of the runoff and tidal current in the North Branch did not change much, and the SSCs at Xuliujing, the South Branch and the offshore area tended to decrease. That is to say, the SSC in the North Branch’s surrounding areas decreased. Both the suspended sediment and the bed sediment in the North Branch tended to be finer in 2003 and 2007, which is indicative of strengthened resuspension effects (Liu et al., 2012). On the whole, the SSC in the North Branch displayed a decreasing trend, thereby demonstrating that the increase caused by the resuspension effect could not completely offset the decrease in the basin and sea area. Therefore, the SSC decrease in the North Branch was caused by the SSC decreases in the basin and the sea area.
Figure 6 Secular variation of the SSC in the North Branch (1958-2011)
Figure 7 Secular variation of the SSC at Qinglonggang station
Figure 8 Secular variation of the SSC at Santiaogang station (1983-2005)

4 The SSC changes at the mouth bar of the Yangtze River Estuary

4.1 The SSC changes at the mouth bar of the Yangtze River Estuary

The SSC data over the period 1958-2012 for the mouth bar section (121°30′-123°00′E, 30°45′-31°45′N) were grouped into three time periods of 1958-1984, 1985-2002 and 2003-2012. As there were not many data for the time period of 1958-1984, only the location changes of the peak SSC value zone were discussed. The data showed that: the SSC in the flood seasons between 2003 and 2012 was 0.50 kg/m3, decreasing by 23.1% when compared with the SSC of 0.65 kg/m3 for the period 1985-2002 (Figure 9a); the SSC in the dry seasons was 0.34 kg/m3 and 0.37 kg/m3 respectively, decreasing by 8.1% (Figure 9b); and the annual average was 0.33 kg/m3 and 0.42 kg/m3 respectively, decreasing by 21.4% (Figure 9c). The SSC at Datong Station was 0.17 kg/m3 for the period 2003-2012, decreasing by 56.4% when compared with the SSC of 0.39 kg/m3 between 1985 and 2002. The annual mean SSC and the SSCs in the flood seasons and dry seasons decreased by a smaller magnitude at the mouth bar when compared with those at Datong Station over the same time period; moreover the flood seasons saw a smaller decrease in the SSC than the dry seasons did, which is indicative of the differences between the SSC changes at the mouth bar and the sharp decrease of the sediment discharge. The peak SSC value zone was active between 121°30′ and 122°30′, and the center of the peak value zone for the annual average SSC and the SSC in the flood seasons between 2003 and 2012 shifted upstream for an approximate 1/6 longitude unit when compared with those between 1985 and 2002. The center of the peak SSC value zone did not change much in the dry seasons. The distance that the peak SSC value zone shifted upstream was in the order of flood reason > annual average > dry season.
Figure 9 Secular variation of the SSC in the Mouth Bar (1958-2012)

4.2 The SSC changes in the South Passage of the Yangtze River Estuary

Figure 10 shows the SSCs in the South Passage for the period 1999-2009. The data showed that the mean SSC during the spring tides and ebb tides was 0.69 kg/m3 and 0.56 kg/m3 respectively at the upper cross-section, and 0.89 kg/m3 and 0.79 kg/m3 respectively at the middle cross-section. These values were larger than the mean SSC at the mouth bar. The mean SSC at the upper cross-section of the South Passage changed little between 2006 and 2009 compared with that between 1999 and 2005, with a mean of 0.69 kg/m3 and 0.58 kg/m3 during the spring tides and ebb tides respectively in the period 2006-2009, and that of 0.68 kg/m3 and 0.56 kg/m3 respectively in the period 1999-2005. The SSC during the spring tides and ebb tides at the middle cross-section was 0.97 kg/m3 and 0.92 kg/m3 respectively between 2006 and 2009, increasing by 0.12 kg/m3 (or 14.12%) and 0.19 kg/m3 (or 26.03%) respectively compared with 0.85 kg/m3 and 0.73 kg/m3 between 1999 and 2005. In other words, the SSC at the middle cross-section of the South Passage tended to increase. Therefore, there were both synchronicity and differences between the SSC changes in the South Passage and the rapid decrease of the sediment discharge.
Figure 10 Secular variation of the SSC in the South Passage (1999-2009)

4.3 The SSC changes in the North Passage of the Yangtze River Estuary

Figure 11 shows the SSC in the North Passage of the Yangtze River Estuary for the period 1999-2009. The mean SSC during the spring tides and ebb tides was 0.57 kg/m3 and 0.46 kg/m3 respectively at the upper cross-section for 2006-2009, decreasing by 13.8% and 8.0% respectively compared with the respective 0.65 kg/m3 and 0.50 kg/m3 for 1999-2005. The percentage decreases were smaller than those at the mouth bar. The middle cross-section of the North Passage was located in the middle area and similar with the 14th measuring point. The mean SSC during the spring tides and ebb tides was 0.89 kg/m3 and 0.80 kg/m3 respectively between 2006 and 2009, increasing by 0.25 kg/m3 (or 39.1%) and 0.25 kg/m3 (or 47.3%) respectively compared with 0.64 kg/m3 and 0.55 kg/m3 for the period 1999-2005. Therefore, there were both synchronicity and differences between the SSC changes in the North Passage and the sharp decrease in sediment discharge.
Figure 11 Secular variation of the SSC in the North Passage (1999-2009)
The SSC data for the North Passage were grouped into three time periods of 2000-2002, 2005-2008 and 2009-2012. As August not only saw spring tide processes but also moderate tide and neap tide processes, data measured every August were chosen for each of the years. During the spring tides, the SSCs (Figure 12) at the 9th and 17th measuring points showed continuous decreasing trends; those at the 10th, 12th and 15th points decreased and then increased with a holistically decreasing trend; and the SSC at the 14th point tended to continuously increase. During the ebb tides: the SSCs at the 9th, 10th and 17th points tended to continuously decrease; those at the 12th and 15th points decreased and then increased with a holistically decreasing trend; and the SSC at the 14th point showed a continuously increasing trend. During moderate tides: the SSC at the 9th point displayed a continuously decreasing trend with that over the periods 2005-2008 and 2009-2012 decreasing by approximately 36.4% and 41.9% respectively compared with that between 2000 and 2002, and that over the period 2005-2012 decreasing by 39.5% compared with that between 2000 and 2002; the SSC at the 17th point tended to decrease with that over the periods 2005-2008 and 2009-2012 decreasing by 28.4% and 34.4% respectively compared with that over the period 2000-2002, and that over the period 2005-2012 decreasing by 32.4% compared with that between 2000 and 2002; the SSCs at the 10th, 12th and 17th points decreased and then increased with a holistic decrease of 48.4%, 47.2% and 18.0% respectively over the period 2009-2012, compared with those between 2000 and 2002; the SSC at the 14th point showed an increase trend, increasing by 67.4% and 87.2% over the periods 2005-2008 and 2009-2012 respectively compared with that between 2000 and 2002.
Figure 12 Secular variation of the SSC in the North Channel (2000-2012)
In summary, the SSCs at Xuliujing, the South Branch, the South and the North Channels, the mouth bar and the offshore area of the Yangtze River Estuary tended to decrease; moreover the closer to the outlets, the lower the percentage of the decrease and the bigger the differences in the percentage of decrease, compared with the sediment volume at Datong Station. The SSCs at the middle cross-sections of the South and the North Passages in the mouth bar section tended to increase, showing a large difference when compared to the sharp decrease in the SSC at both Datong Station and the estuary.

5 The causes of the different responses of the SSC at the Yangtze River Estuary

In addition to the basin and the sea area, the vertical transport, which is caused by the resuspension effect generated during the suspended sediment-bed sediment exchanging process, and the horizontal transport, which is caused by the bar-channel exchange, is another two sources of sediment in the Yangtze River Estuary. The latter two sources help to minimize the effects of the rapid decrease in the incoming sediments from the basin and the sea area. The movement of the peak SSC value zone is mainly related to the hydrodynamic strengths of the runoff and tidal current, which are seaward when the runoff gets stronger and upstream when the tidal current gets stronger. The hydrodynamics and sediment sources are different in the different areas of the Yangtze River Estuary, which results in both synchronicity and differences in the SSC responses to the sediment discharge.

5.1 Evidence for the changes in SSC distribution in the Yangtze River Estuary

The water discharge between 2003 and 2012 was 8.215×10¹¹ m3/y, decreasing by ~8.05% when compared with the 8.936×10¹¹ m3/y in the period 1985-2002. On the contrary, the tidal range increased by 2.7%. As a result, the hydrodynamic competition between the runoff and tidal current led to the upstream movement of the hydrodynamic equilibrium point between the runoff and tidal current, and the corresponding upstream movement of the peak SSC value zone. The chlorophyll concentration has a good correlation with SSC. The upstream movement of the peak value zone of the chlorophyll concentration has been observed, indicating a corresponding upstream movement of the peak SSC value zone (Cui et al., 2014). The central point of the siltation intensity also moved upstream in the deep waterway of the North Passage, indicating that the point where the suspended sediments settled down had changed (Liu et al., 2009); this was in line with the position change of the stagnation point in the North Passage (Yang et al., 2011). The sand-silt boundary in the estuary area near the continental shelf can indirectly reflect the characteristic changes of the sediment particles under the hydrodynamic effect. The boundary tended to shift upstream recently (Yang et al., 2014a), that is, the peak SSC value zone moved upstream. Geomorphologically, the slowdown of the siltation rate, or even the erosion at the sand islands at the front of the Yangtze River Estuary, and the emerging erosion tendency of the submerged delta (Yang et al., 2014b; Yang, 2014) also reflected the decrease in the SSC at the estuary area. To sum up, the peak SSC value zone at the Yangtze River Estuary area moved upstream, and this had an effect on the estuary’s eco-system, sediment transport and geomorphologic system.

5.2 The effects of resuspension and the suspended sediment-bed sediment exchange on the SSC at the estuary

Figure 13 shows the vertical SSC distribution along measuring lines I, II and III. The data demonstrated that the core zone of the peak SSC values along measuring line I appeared at the middle section of the North Passage. During times of maximum flood and maximum ebb, the SSC in the surface ~0.6 H water body over the whole section was less than 0.75 kg/m3, while that in the 0.8 H area and below was higher than 0.75 kg/m3, thereby increasing and then decreasing downwards. The peak SSC value zone along measuring line II was at the middle section of the South Passage. The SSC was less than 0.75 kg/m3 in the surface ~0.8 H water body and higher than 0.75 kg/m3 in the lower water body, thereby increasing and then decreasing downwards. The SSC distribution along measuring line III was similar to those along lines I and II.
Figure 13 Sediment distribution at maximum flood and maximum ebb in the waterway of the Yangtze River Estuary
Measuring lines I, II and III were home to the peak SSC value zones, and the SSC values were evidently higher than those in the upper and lower reaches. This area is defined as the mouth bar section in geomorphology, as the stagnation point active area in hydrodynamics, and as the turbidity zone or the stagnation point active area in sediment transport. That is, the relatively high SSC in this area is mainly because of the exchange between the bottom suspended sediments and the surface bed sediments, and the resuspension effect. The suspended sediment-bed sediment exchange and the resuspension process are related to the hydrodynamic force in the short term, but are affected by the composition of the suspended sediment and bed sediment and particle changes in the long term. A previous study showed that for the North Passage in 2005 and 2007, the stronger the hydrodynamic force of the runoff and tidal current, the higher the SSC and the greater the resuspension and exchange (Yang et al., 2014b). Furthermore, the greater the difference in composition, level curve process and median size between the suspended sediment and the bed sediment, the smaller the exchange volume of the bottom sediments or the lower the SSC. Along measuring line I: the suspended sediment and the bed sediment showed a large difference in their median sizes in the South Branch and the upper section of the South Channel, but a small difference in the lower section of the South Channel; and the suspended sediment and the bed sediment in the upper section of the North Passage differed greatly, with the difference tending to augment in the middle section (Figure 14a). Along measuring line II, the difference in median size between the suspended sediment and bed sediment was large in the South Branch and the upper section of the South Channel and small in the lower section of the South Channel and the South Passage; this indicated an active exchange between the suspended sediment and bed sediment in the South Passage (Figure 14b). Along measuring line III, the median size of the bed sediment decreased gradually and the suspended sediment-bed sediment exchange became increasingly active towards the lower reach (Figure 14c). According to previous studies (Yang, 2014; Ding, 2013), the median sizes of the suspended sediments in the South Branch, the South and North Channels, and the South and North Passages in the Yangtze River Estuary tended to reduce with the sharp decrease in the volume of the fine suspended sediments that were discharged from the basin, and the suspended sediments tended to be finer. Bed sediment data for the same period showed that on the whole, the bed sediments in the Yangtze River Estuary area were getting coarser (Luo et al., 2012), while the suspended sediments had recently displayed a trend of becoming finer (Liu et al., 2012). Therefore, the suspended sediment and bed sediment in the Yangtze River Estuary changed with regard to particle characteristics, and the process of suspended sediment-bed sediment exchange became less active. As a result, the SSC tended to decrease.
Figure 14 Suspended sediment and bed sediment particle size in value comparison (August 2007)

5.3 The effects of “bar-channel exchange” on the SSC in the Yangtze River Estuary

The sediment exchange between bars (including point bars and channel bars) and deep channels is widespread in estuary areas and influences the value and distribution of the local SSC. A sediment exchange occurred between the Nanhui Point Bar and the South Passage (Guo et al., 2012). Squeezed by the recent continuous reclamation at the Nanhui Point Bar, the watercourse of the South Passage became narrower, thereby enhancing the suspension of the surface bed sediment at the point bar and the sediment exchange between the bar and the channel. In addition, a great amount of sediment was carried along by the ebb tide to the main channel of the South Passage as the south bank at Jiuduansha was scoured; this increased the SSC in the South Passage to a certain degree. This process mainly happened at the middle section of the South Passage. The SSC at the middle section of the South Passage was mainly impacted by the sediment exchange between the bar and channel, whose increasing effect was greater than the decreasing effect of the sharp decrease in the sediments from the basin and the sea area, and also greater than the decreasing effect of the weakened resuspension effect caused by the widening of the river channel. As a result, the SSC at the middle section of the South Passage tended to increase.
A sediment exchange occurred between the North Passage and the neighboring Jiuduansha and Hengsha East Shoal. During the period 1998-2009 when the deep-water channel regulation works were carried out in the North Passage of the Yangtze River Estuary, water and sediment were observed to move across both the south and the north diversion dikes. The middle section of the North Passage was 14.2 km long, or 29.7% of the entire passage (47.8 km), but the volume of sediment going across the diversion dikes in the section was 43.1% of the total volume; this indicates that a significantly larger volume of the sediment went over the dikes in the middle section than in the upper reach or the lower reach. In addition, a large difference in the median size between the suspended sediment and bed sediment was found in the upper section of the North Passage, while a small difference was found in the middle and lower sections; this suggests a weak resuspension in the upper section and a strong resuspension in the middle and lower sections. A previous study showed that the median size of the suspended sediments in the North Passage tended to decrease (Yang et al., 2014b). The bed sediments in the upper section obviously became coarser, whilst those in the middle and lower sections tended to turn slightly coarser. As a result, the sediment resuspension became weaker. The SSCs displayed different changing trends in the upper, middle, and lower sections of the North Passage. The SSC decreases in the upper and lower sections was mainly because of the decrease in the volume of the sediment from the basin and the sea area, and the less active exchange between the suspended sediments and the bed sediments as the latter became coarser. The SSC increased in the middle section, because the increase in value caused by the sediment going across the dikes was greater than the decrease in value caused by the sharp decrease in the sediments from the basin and the sea area, and also because of the weakened resuspension effect due to the finer suspended sediments and coarser bed sediments. By utilizing physical models, Chinese experts recently noted that whether there are reclamation projects carried out in the Nanhui Point Bar or not, the bed sediments at Jiuduansha can move across the dikes into the deep-water course of the North Passage. However, siltation-promoting projects will lower the volume of sediment that enters the waterway of the North Passage from the upper part of Jiuduansha, but increase the volume of sediment entering the waterway of the North Passage from the middle part of Jiuduansha (Hu et al., 2013). Jin et al. believed that sediment exchange between the bar and channel had a fairly large influence on siltation in the North Passage, and that it was possible that the suspended sediment at high concentrations moving with the horizontal flow resulted in 2×10⁷-3×10⁷ m3 of silt deposited in the middle 12.5-m deep-water course (Jin et al., 2013). The 296.6 Mt/y (in 2007) and 317.1 Mt/y (in 2008) of sediments moving across the southern diversion dike of the North Passage (Liu et al., 2013) directly influenced the SSC changes in the North Passage area, particularly the middle section. Therefore, the volume of sediments going across the dikes was the main reason for the SSC increase in the middle section of the North Passage.

6 Conclusions

The SSC data from the period 1950-2013 for the Yangtze River Estuary demonstrated the synchronicity and differences between the SSC change at the estuary and the sharp decrease of the sediment discharge from the basin. The causes of the SSC changes were also explored. The results showed that:
(1) Water discharge from the Yangtze River Basin changed little and displayed no clear changing trend except that in the dry years between 2003 and 2012; and the water discharge decreased by ~8.05% compared with that in the period 1985-2002.
(2) The sediment discharge displayed a stepwise sharp decrease and the impoundment of the Three Gorges Reservoir exacerbated the reduction. The SSC at the Xuliujing cross-section tended to decrease. Furthermore, the SSCs at Xuliujing and Datong stations decreased by 35.5% and 37.3% respectively between 2003 and 2009 compared with those between 1998 and 2002, and decreased by 56.1% and 53.3% respectively in the flood seasons between 2003 and 2009 compared with those in the flood seasons between 1998 and 2002. The silimar values demonstrated a good synchronicity in the SSC decrease between the two sites.
(3) The SSCs in the South and the North Branches, the South and the North Channels, the mouth bar section and the offshore area also displayed a decreasing trend. Moreover, the SSCs decreased by a smaller percentage where they were closer to the outlets, and decreased by a smaller percentage than the sediment discharge did over the same time period; this further demonstrated a synchronicity. However, the SSC increases in the South Passage and the middle section of the North Passage demonstrated differences. The annual average SSC and the SSCs in the flood seasons and dry seasons in the mouth bar section decreased by 21.4%, 23.1% and 8.1% respectively in the period 2003-2012 compared with those in the period 1985-2002. Moreover, as it was affected by the hydrodynamic forces of the runoff and tidal current, the peak SSC value zone shifted upstream for approximately a 1/6 longitude unit in the period 2003-2012 compared with that in the period 1985-2002.
(4) The SSC at the inlet of the South Passage did not change much between 1999 and 2009, and the slight increase at the middle cross-section mainly resulted from the sediment exchange between the bar and channel and from resuspension. In each August between 1999 and 2012, the SSC at the inlet of the North Passage decreased a little, while that at the middle section increased markedly. Such a difference was mainly because in the middle section, the value of the increase caused by the sediments moving across the dikes was greater than the value of the decrease caused by the sharp decrease in the sediment discharge, and the less active exchange between the suspended sediment and bed sediment. On the whole, when the sediment discharge decreased sharply, the SSCs in different areas of the Yangtze River Estuary not only demonstrated synchronicity but also relatively clear differences in their responses.

The authors have declared that no competing interests exist.

1
Bi Shipu, Hu Gang, He Yongjunet al., 2011. Remote sensing monitoring of surface suspended sediments at Yangtze Estuary in the past two decades.Marine Geology & Quaternary Geology, 31(5): 17-24. (in Chinese)

2
Carriquiry J D, Sanchez A, Camacho-Ibar V F, 2001. Sedimentation in the northern Gulf of California after cessation of the Colorado River discharge.Sedimentary Geology, 144(1/2): 37-62.

3
Chen X Q, Yan Y X, Fu R Set al., 2008. Sediment transport from the Yangtze River, China, into the sea over the post-Three Gorges Dam period: A discussion.Quaternary International, 186: 55-64.

4
Chen Yong, Han Zhen, Yang Lijunet al., 2012. The spatial and temporal distribution of suspended sediment concentration and its response to environmental change in the Changjiang Estuary.Acta Oceanologica Sinica, 34(1): 145-152. (in Chinese)

5
Cui Yanping, Wang Baodong, Chen Qiuwenmet al., 2014. The spatial-temporal dynamics of chlorophyll a and DO in the Yangtze Estuary after normal impoundment of the Three Gorges Reservoir.Acta Ecologica Sinica, 21: 1-13. (in Chinese)

6
Dyer K R, 1995. Sediment transport processes in estuaries. In: Perllo G M E ed. Geomorphology and Sedimentlogy of Estuaries, 53: 423-449.

7
Dai Shibao, Liu X X, Yang Shilunet al., 2008. A preliminary estimate of human and natural contributions to the decline in sediment flux from the Yangtze River to the China Sea.Quaternary International, 186: 43-54.

8
Dai Shibao, Yang Shilun, Li Ming, 2009. The sharp decrease in suspended sediment supply from China’s rivers to the sea: Anthropogenic and natural causes.Hydrological Sciences Journal, 54(1): 134-146.

9
Dai Zhijun, Chu Ao, Li Weihuaet al., 2013. Has suspended sediment concentration near the Mouth Bar of the Yangtze (Changjiang) Estuary been declining in recent years?Journal of Coastal Research, 29(4): 809-818.

10
Ding Pingxing, 2013. Rivers into the sea matter flux variations and environmental effects of estuarine ecology. In: Chinese Academy of Engineering Consultation Report. (in Chinese)

11
Erin L Hestir, David H Schoellhamer, Tara Morgan-Kinget al., 2013. A step decrease in sediment concentration in a highly modified tidal river delta following the 1983 El Niño floods.Marine Geology, 345: 304-313.

12
Fanos A M, 1995. The impacts of human activities on the erosion and accretion of the Nile Delta coast.Journal of Coastal Research, 11(3): 821-833.

13
Fu K D, He D M, Lu X X, 2008. Sedimentation in the Manwan Reservoir in the Upper Mekong and its downstream impacts.Quaternary International, 186: 91-99.

14
Guo Xiaobin, Li Jiufa, Li Zhanhaiet al., 2012. Characteristics of recent now and suspended sediment transport in beaches and channels of South Channel of Yangtze River Estuary.Yangtze River, 43(11): 1-6. (in Chinese)

15
He Chao, 2007. Comparison study of suspended sediment distribution in the Yangtze Estuary’s adjacent sea area in recent 20 years [D]. Shanghai: East China Normal University. (in Chinese)

16
Hu Zhifeng, Jia Xiao, Wu Hualinet al., 2013. Impact to Yangtze Estuary deepwater channel by sediment transportation of north part of Jiuduansha shoal.Port & Waterway Engineering, 485(11): 95-99. (in Chinese)

17
Jin Miu, Yu Zhiying, He Qing, 2006. On the relationship between maintenance conditions of Yangtze Estuary deep-water channel and water & sediment transport from the valley.Port & Waterway Engineering, (3): 46-51. (in Chinese)

18
Jin Miu, Yu Zhiying, He Qinget al., 2013. Response of deepwater channel in north passage to water and sediment exchange between channel and shoal in the Yangtze Estuary.Port & Waterway Engineering, 474(1): 101-108. (in Chinese)

19
Jing Xuezhong, Lu Bing, He Yuhong, 2013. Response of the turbidity maximum zone to fluctuations in sediment discharge from river to estuary in the Changjiang Estuary (China). Estuarine, Coastal and Shelf Science, (131): 24-30.

20
Johan C Winterwerp, 2011. Fine sediment transport by tidal asymmetry in the high-concentrated Ems River: Indications for a regime shift in response to channel deepening.Ocean Dynamics, 61: 203-215.

21
Liu Meng, Wu Hualin, Li Weiuhaet al., 2013. The temporal and spatial variations of the sediment flux overtopping the South Leading Jetty in the North Passage of the Changjiang Estuary.Acta Oceanologica Sinica, 33(2): 161-167. (in Chinese)

22
Kummu M and Varis O, 2007. Sediment-related impacts due to upstream reservoir trapping, the Lower Mekong River.Geomorphology, 85(3): 275-293.

23
Li Peng, Yang Shilun, Milliman J Det al., 2012. Spatial, temporal, and human-induced variations in suspended sediment concentration in the surface waters of the Yangtze Estuary and adjacent coastal areas.Estuaries and Coasts, (35): 1316-1327.

24
Liu Hong, He Qing, Wang Yaet al., 2012. Processes of suspended sediment mixture in the Yangtze River Estuary.Acta Geographica Sinica, 67(9): 1269-1281. (in Chinese)

25
Liu Jie, Xu Zhiyang, Zhao Dezhaoet al., 2009. Change of re-siltation in the Yangtze Estuary deepwater channel during 1st and 2nd stages.Journal of Sediment Research, (2): 22-28. (in Chinese)

26
Lu X X, Siew R Y, 2006. Water discharge and sediment flux changes over the past decades in the Lower Mekong River: Possible impacts of the Chinese dams.Hydrology and Earth System Sciences, 10(2): 181-195.

27
Luo X, Yang S L, Zhang J, 2012. The impact of the Three Gorges Dam on the downstream distribution and texture of sediments along the middle and lower Yangtze River (Changjiang) and its estuary and subsequent sediment dispersal in the East China Sea.Geomorphology, 179: 126-140.

28
Milliman J D, 1997. Blessed dams or damned dams?Nature, (386): 325-327.

29
Morais P, Chicharo A, Chicharo L, 2009. Change’s in a temperate estuary during the filing of the biggest European dam.Science of the Total Environment, 407(7): 2245-2259.

30
Pang Zhongguang, Wang Fan, 2004. The distributing features and temporal variability of suspended matter concentration in the East China Sea.Studia Marina Sinica, 46: 22-31. (in Chinese)

31
Qian Chunlin, 1994. Effects of the water conservancy projects in the Luanhe River basin on Luanhe River Delta Hebei Province.Acta Geographica Sinica, 49(2): 158-166. (in Chinese)

32
Shen Fang, Zhou Yunxuan, Li Jiufaet al., 2013. Remotely sensed variability of the suspended sediment concentration and its response to decreased river discharge in the Yangtze Estuary and adjacent coast.Continental Shelf Research, 69: 52-61.

33
Svenja Papenmeier, Kerstin Schurottke, Alexander Bartholoma, 2014. Over time and space changing characteristics of estuarine suspended particles in the German Weser and Elbe estuaries.Journal of Sea Research, 85: 104-115.

34
Syvitski J P M, Vorosmarty C J, Kettner A Jet al., 2005. Impact of humans on the flux of terrestrial sediment to the global ocean.Science, 2005, (308): 376-380.

35
Victor N de Jonge, Hemk M Schuttelaars, Justus E Eet al., 2014. The influence of channel deepening on estuarine turbidity levels and dynamics, as exemplified by the Ems estuary. Estuarine, Coastal and Shelf Science, 139: 46-59.

36
Walling D E, 2006. Human impact on land-ocean sediment transfer by the world’s rivers.Geomorphology, 79(3/4): 192-216.

37
Wang Z Y, Li Y T, He Y P, 2007. Sediment budget of the Yangtze River.Water Resources Research, 43(W04401): 1-14.

38
Yang Yunping, 2014. Impact of water-sediment condition variation on geomorphic system in Yangtze Estuary [D]. Wuhan: Wuhan University. (in Chinese)

39
Yang Yunping, Li Yitian, Sun Zhaohuaet al., 2014a. Surface sediment in the offshore area of the Yangtze River: Change characteristics and causes.Acta Sedimentologica Sinica, 32(5): 863-872. (in Chinese)

40
Yang Yunping, Li Yitian, Sun Zhaohuaet al., 2014b. Suspended sediment load in the turbidity maximum zone at the Yangtze River Estuary: The trends and causes.Journal of Geographical Sciences, 24(1): 129-142.

41
Yang Yunping, Li Yitian, Wang Donget al., 2011. Progress of study of stagnation point in Yangtze River Estuary.Journal of Sediment Research, (6): 1-6. (in Chinese)

42
Yang Z, Wang H, Saito Y, et al., 2006. Dam impacts on the Changjiang (Yangtze) River sediment discharge to the sea: The past 55 year san dafter the Three Gorges Dam.Water Resources Research, 2006, 42(W04407): 1-10.

43
Yun Caixing, 2004. Recent Evolution of the Basic Law of the Yangtze River Estuary. Beijing: China Ocean Press. (in Chinese)

44
Zhai Xiaoming, 2006. Elementary discussion of hydrodynamic and suspended sediment distribution characteristic in the Yangtze Estuary [D]. Shanghai: East China Normal University. (in Chinese)

45
Zhang Huaijing, Zhai Shikui, Fan Dejianget al., 2007. Distribution of suspended matter concentration in the Changjiang Estuary and adjacent area after the first-stage storage of the Three Gorges Project.Environmental Science, 28(8): 1655-1661. (in Chinese)

46
Zhang Xinfeng, Ye Xuchang, Zhang Shuo, et al., 2013. Distributions of suspended sediment concentration in the Yangtze Estuary and coastal seas in spring. In: Third International Conference on Intelligent System Design and Engineering Applications, 607-611.

47
Zhao Huayun, 2006. Influence of the Three Gorges Dam on suspended sediment concentration in the delta front of the Yangtze: Take Luchaogang as an example [D]. Shanghai: East China Normal University. (in Chinese)

48
Zou Shuhua, Zhang Ningchun, Li Beiet al.,2012. A study of suspended sediment concentration in Yangshan deep-water port in Shanghai, China. International Journal of Sediment Research, 27: 50-60.

Outlines

/