Orginal Article

Spatial-temporal pattern changes of main agriculture natural disasters in China during 1990-2011

  • DU Xindong ,
  • JIN Xiaobin , 1, 2, * ,
  • YANG Xilian 3 ,
  • YANG Xuhong 1 ,
  • XIANG Xiaomin 1 ,
  • ZHOU Yinkang 1, 2
Expand
  • 1. School of Geographic and Oceanographic Sciences, Nanjing University, Nanjing 210023, China
  • 2. Natural Resources Research Center of Nanjing University, Nanjing 210023, China
  • 3. Land Resources Reserve and Development Center of Anhui Province, Hefei 230601, China

*Corresponding author: Jin Xiaobin (1974-), PhD, E-mail:

Author: Du Xindong (1981-), PhD Candidate, specialized in land use/cover change, land consolidation, space simulation and optimization. E-mail:

Received date: 2014-05-18

  Accepted date: 2014-11-20

  Online published: 2015-04-15

Supported by

National Natural Science Foundation of China, No.41340016

Natural Science Foundation of Jiangsu Province, China, No.BK2012731

Copyright

Journal of Geographical Sciences, All Rights Reserved

Abstract

China is a disaster prone country, and a comprehensive understanding of change of disasters is very important for China’s agricultural development. In this study, statistical techniques and geographic information system tools are employed to quantify the main agriculture disasters changes and effects on grain production in China during the period of 1990-2011. The results show that China’s grain production was severely affected by disasters including drought, flood, hail, frost and typhoon. The annual area covered by these disasters reached up to 48.7×10⁶ ha during the study period, which accounted for 44.8% of the total sown area, and about 55.1% of the per unit area grain yield change was caused by disasters. In addition, all of the disasters showed high variability, different changing trends, and spatial distribution. Drought, flood, and hail showed significantly decreasing trends, while frost and typhoon showed increasing trends. Drought and flood showed gradual changes and were distributed across the country, and disasters became more diversified from north to south. Drought was the dominated disaster type in northern China, while flood was the most important disaster type in the southern part. Hail was mainly observed in central and northern China, and frost was mainly distributed in southern China. Typhoon was greatly limited to the southeast coast. Furthermore, the resilience of grain production of each province was quite different, especially in several major grain producing areas, such as Shandong, Liaoning, Jilin and Jiangsu, where grain production was seriously affected by disasters. One reason for the difference of resilience of grain production was that grain production was marginalized in developed provinces when the economy underwent rapid development. For China’s agricultural development and grain security, we suggest that governments should place more emphasis on grain production, and invest more money in disaster prevention and mitigation, especially in the major grain producing provinces.

Cite this article

DU Xindong , JIN Xiaobin , YANG Xilian , YANG Xuhong , XIANG Xiaomin , ZHOU Yinkang . Spatial-temporal pattern changes of main agriculture natural disasters in China during 1990-2011[J]. Journal of Geographical Sciences, 2015 , 25(4) : 387 -398 . DOI: 10.1007/s11442-015-1175-x

1 Introduction

Global climate change has received increasing attention in recent years (Houghton et al., 2001). It has been acknowledged that natural disasters are likely to become more frequent, more severe, and sustained along with climate change (Easterling, 2000; McMichael et al., 2006; Morrissey and Reser, 2007; Xiao and Xiao, 2010). For example, there is a drying trend in Sahel (Held et al., 2005) and more severe droughts are likely to occur in the future in the United States (Woodhouse and Overpeck, 1998), while Delgado et al. (2010) pointed out that extreme floods showed an increasing trend in the Mekong River in the past decades. Natural disasters can significantly hinder human and economic development (McMichael et al., 2006; Morrissey and Reser, 2007; Kim et al., 2013; Ni et al., 2010). According to data from the Center for Research on the Epidemiology of Disasters (CRED), since 1980 the top three wind storm disasters resulted in more than 160 thousand deaths. The total losses caused by flood during 1970-2006 in Europe amounted to US $140 billion (Barredo, 2009). In addition, losses resulting from natural disasters have grown steadily with time (Kunkel et al., 1999; Changnon et al., 2000; Greenough et al., 2001). Agricultural production is dependent on natural resources, which makes it more vulnerable to natural disasters, such as drought, flood, hail and frost, as compared with other industries (Lambert and Parker, 1998; Sivakumar, 2006; Iglesias et al., 2011). In particular, drought and flood are widely distributed across the world. Edmeades (2013) reported that drought in the midwest US caused a reduction of 15% in national maize production in 2012. Wet rice production was also significantly affected by flood in Vietnam (Chau et al., 2013). In brief, natural disasters are a major threat factor to the sustainable development of grain production.
Due to its complex geographical environment, China is acknowledged as one of the most vulnerable countries in the world to disasters (Liu and Diamond, 2005; Xiao and Xiao, 2010). The main disaster types include drought, flood, earthquake, landslide and storm (Wang et al., 1995; Liu and Diamond, 2005; Zhou et al., 2013). Wang et al. (1995) discussed the spatial characteristics of natural disasters in China, and found that the Huang-Huai-Hai region experienced the most serious economic losses by natural disasters among all regions, while the border zone of Yunnan-Shichuan-Guizhou-Guangxi underwent the highest number of casualties. In total in China, there were annual averages of 4840 people killed and about US $3.41 billion in direct economic loss caused by major natural disasters during the period of 1990-2011 (Zhou et al., 2013). In particular, the 1998 floods of the Yangtze River caused thousands of deaths and more than US $18 billion in direct economic losses (Wang et al., 1999). Previous studies have shown that China’s grain yield was sensitive to natural disasters (Lambert and Parker, 1998; Simelton, 2011; Chen et al., 2008). Wang et al. (2012) found that grain loss by disasters was about 55.4 million tons, accounting for 10.4% of the total grain yield in 2009. Thus it is critical for China to maintain stable grain production, as the population of China accounts for more than 20% of the world’s population (Qiang et al., 2013). The effects in grain production by natural disasters have drawn great attention from scholars. Liu and Diamond (2005) reported that about 160,000 km2 of cropland were damaged by drought in China, and the drought affected area showed an increasing trend (Li et al., 2009; Liu, 2012; Qiu et al., 2013). The flood situation is also becoming more severe (Jia and Pan 2013). Therefore, it is necessary to understand the spatial-temporal pattern change of natural disasters. However, most of the previous studies have concentrated on a certain type of natural disasters (Zhang, 2004; Li et al., 2009; Xiao and Xiao, 2010; Liu, 2012; Qin et al., 2013) or disasters which caused serious casualties (Zhou et al., 2013), and few studies have explicitly explored the spatial dynamics of natural disasters and their effects on grain production. In this paper, we analyzed the trends and spatial changes of major disasters from 1991 to 2011 and their influence on grain production. The study results may provide support for policy makers to mitigate natural disasters and ensure the stable development of agricultural production.

2 Data sources and methods

2.1 Data sources

In this paper, disaster data was obtained from China Agriculture Statistical Report, sown area data and grain yield data were obtained from China Statistical Yearbook. All of the statistical yearbooks were compiled by the Chinese official agencies and other authoritative agencies, for every year from 1990 to 2011 at the provincial scale.
Due to data availability issues, Hong Kong, Macao and Taiwan are excluded. In addition, the data of Chongqing was added to Sichuan Province, as its data from before 1997 are unavailable. Among these provinces and municipalities, Beijing, Shanghai and Tianjin are municipalities, which are characterized by high degrees of urbanization and industrialization. Liaoning, Hebei, Shandong, Jilin, Inner Mongolia, Jiangxi, Hunan, Sichuan, Henan, Hubei, Jiangsu, Anhui and Heilongjiang are the major grain producing areas, the grain yield of which accounts for more than 75% of China’s total grain yield. According to the statistical yearbooks, grain production was mainly affected by drought, flood, hail, frost and typhoon. Therefore, here we focus on these five types of disasters, and the data include disaster area, sown area and grain yield. Meanwhile, in order to eliminate the impact of sown area change, the ratio of disaster area to sown area was used to quantify the disaster change. All data were input to the geographic information system (GIS).

2.2 Methods

2.2.1 Changing trend analysis
Various techniques have been developed in previous studies to detect the trend of time series (Hirsch et al., 1991; Yu et al., 1993; Xu et al., 2005), and the changing trends of disasters were analyzed by the collected time series data. In this paper, the Mann-Kendall (M-K) test was employed to analyze the disaster changing trend. The M-K test is acknowledged as an effective tool for identifying whether or not trends exist in the time series data, and has been widely used in different fields. For a time series, the M-K test statistics can be defined as:
where
and xi and xj are the disaster area in time i and j, n is the number of samples. S will be positive if there is an increasing trend and negative if there is a decline trend. The significance of the trend can be calculated by comparing the standardized variable Z in Eq. (3) with the standard normal variable at the expected significance level P.
Furthermore, the magnitude of the change trend can be quantified by Eq. (4).
where and is the trend magnitude. At an expected significance level, negative values indicate a decreasing trend, while positive values indicate an increasing trend.
Generally speaking, disaster area fluctuated significantly with time. In this paper, the coefficient of variation (CV) was employed to analyze the overall change of disaster. The CV can quantify the variability of a series of numbers independent of their unit and mean, and it can also be used to compare the variability among different series. It is defined as the ratio of the standard deviation of the series data to the mean (Eq.(5)).
2.2.2 Spatial pattern change
The spatial distributions of disasters are uneven, thus it is necessary to quantify the spatial pattern changes of disasters. Previous studies have shown that spatial statistical approaches may improve our understanding of spatial-temporal dynamics (Getis and Ord, 1992; Anselin, 1995). In our study, Moran's I and Getis-Ord Gi* are employed to evaluate the spatial pattern of disasters. Moran's I is the most commonly used to measure the degree of spatial concentration or dispersion of disasters at a global scale, the index of which ranges from -1 to 1 (Eq.(6)).
where n is the number of observations, s is the aggregate of all spatial weights, xi and xj are the observations for area i and j, 
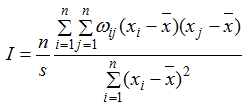
is the mean of observations, and ωij is the spatial weight between area i and j. Negative values indicate dispersed patterns or negative spatial autocorrelation, while positive values indicate clustered patterns or positive spatial autocorrelation. In particular, value -1 indicates perfect dispersion, value 1 indicates perfect cluster, and value 0 indicates a random spatial pattern (Diniz et al., 2003).
Getis-Ord Gi* can generate a Z-score, which describes the degree of clustering of either high or low values, and has been widely used to detect hot spots and cold spots of disasters (Myint et al., 2007; Cheng and Yuqi, 2009). Furthermore, the results of Getis-ord Gi* were reclassified to four classes by the natural break method, including hot spots, sub-hot spots, cold spots and sub-cold spots. The spatial pattern change analysis was conducted in ArcGIS 9.3.
2.2.3 Linear regression model
Linear regression model is widely used to evaluate the relationship between two variables. Generally speaking, a set of observed data is known to be the dependent variable, another set is called to be the explanatory variable. The model can be expressed as follows,
where y is the dependent variable, x is the explanatory variable, αis the intercept, βis the regression coefficient. The strength of the linear association between the two variables is commonly quantified by the correlation coefficient, which is known as R2. The value of R2 is between 0 and 1, indicating the strength of the association of the observed data for the two variables. However, the R2 value is affected by the number of explanatory variable. In this paper, we use the adjusted R2 to replace R2, which eliminates the influence of the number of explanatory variable, and it can be calculated by Eq. (8).
where n is the number of observed data, and k is the number of explanatory variable.

3 Results and discussions

3.1 Changes of disasters

As shown in Figure 1, China’s grain production was severely affected by natural disasters. Especially in 1991, the disaster area was about 83.2×10⁶ ha, accounting for 74.1% of the sown area. The annual disaster coverage area reached up to 48.7×10⁶ ha during the period of 1990-2011, accounting for 44.8% of the sown area. Meanwhile, the disaster coverage area fluctuated significantly, with CV being as high as 0.21. As can be seen from the figure, drought was the most serious disaster type, accounting for about 50.9% of the annual disaster area. Flood was the second major disaster type, with 26.7% of the annual disaster area. Hail and frost accounted for 9.7% and 9.8% of the annual disaster, respectively. The area affected by typhoon was quite small, with 2.9% of the annual disaster area. The trend of disaster coverage area showed a decreasing trend (Table 1), and the results calculated from
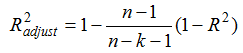
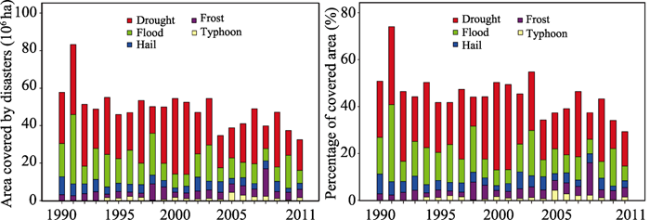
Figure 1 Disaster change from 1990 to 2011 in China
Table 1 M-K tests of disasters change of China
Type Total Drought Flood Hail Frost Typhoon
Disaster area -0.498* -0.342* -0.385* -0.342* 0.307* 0.033
Ratio of disaster area -0.437* -0.307* -0.351* -0.325* 0.299 0.033
CV of disaster area 0.21 0.34 0.54 0.37 0.61 0.66

Note: *, P=0.05.

disaster area and the ratio of disaster area to sown area (ratio of disaster area) were basically the same, which showed the results were credible. According to Table 1, the area covered by each disaster type showed different changing trends. Drought, flood and hail showed decreasing trends, while frost and typhoon showed increasing trends. Furthermore, the interannual variability of each disaster type was quite different. Typhoon had the maximum annual variation, followed by frost and flood, of which the CVs were 0.66, 0.61 and 0.54, respectively. The CVs of drought and hail were also high, being 0.34 and 0.37. The higher CVs indicated that the disaster had high variability and less stability, which would increase the grain production instability.
In terms of each province, the composition of disasters showed a gradual change from north to south and from west to east (Figure 2). Provinces in the north and west were dominated by drought, especially in Inner Mongolia and Shaanxi, where drought accounted for more than 70% of total disasters. The proportion of drought decreased from north to south and from west to east, while the other disaster types increased, and flood became the most important disaster in the east and south. Meanwhile, disasters became diversified from north to south. The CVs of drought and flood showed trends which are opposite to their compositions. The CV of flood was larger than that of drought in drought dominated provinces, while that of drought was larger than flood in flood dominated provinces. This further confirms the fact that the north mainly faces drought threat and the south faces flood threat throughout all time periods.
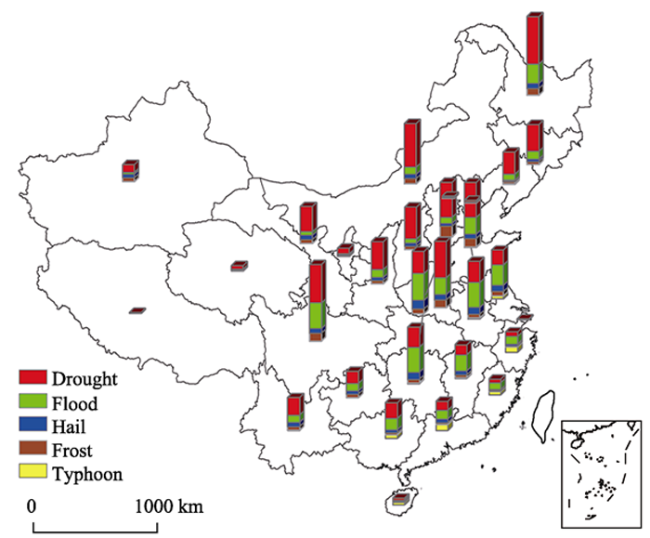
Figure 2 Annual composition of disasters of each province during 1990-2011
The disaster areas not only exhibited highly interannual variability, but were also uneven in terms of spatial distribution. Figure 3 describes the spatial distribution of the overall disaster area in the past 22 years. It is clear that the distribution of disasters possesses significant geographical distribution characteristics. Drought in northern China was more severe than that in southern China, and covered a larger area than other disaster types. The main reason for this is that the geographical distribution of water resources and cropland in China is uneven and mismatched. Khan et al. (2009) pointed that about 81% of China’s water resources are distributed in southern China, while more than 64% of croplands are located in the northern part. Due to their sown areas, Xinjiang and Tibet were classified as cold spot areas, thus it was not indicated that their grain productions were less affected by drought. The distribution of flood was opposite to that of drought. All hot spot areas of flood were distributed within four provinces in southern China, namely Hunan, Jiangxi, Zhejiang and Fujian. Grain production in central and northern China was more affected by hail than in other areas. Although the average annual temperature of southern China was much higher than that in the northern (Fan et al., 2011), frost in the south was more severe than in the north. This was mainly due to the fact that the temperature in winter in the north was too low for seeding. Similar to the distribution of flood, typhoon was largely limited to the southeast coast of China. Generally speaking, the hot spot and sub-hot spot areas of disasters were mainly distributed in central, eastern and northeastern China. All cold spot areas were concentrated in western China, while sub-cold spot areas were dispersed throughout north and south China.
For the interannual instability, the spatial pattern of disasters also changed along with time. Table 2 shows the Moran's I change during the study period. As mentioned in Section
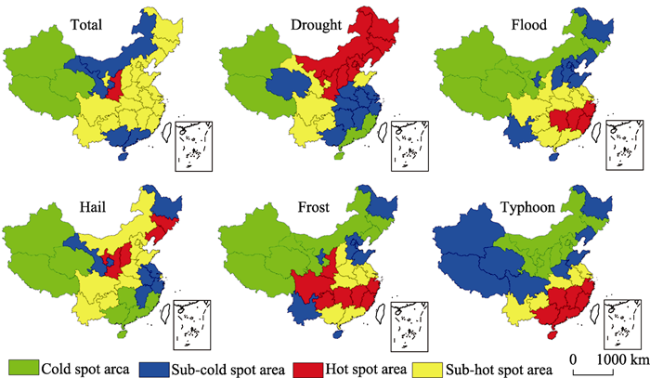
Figure 3 Spatial pattern of the overall disasters during 1990-2011
Table 2 Moran's I change from 1990 to 2011
Year Total Drought Flood Hail Frost Typhoon Year Total Drought Flood Hail Frost Typhoon
1990 0.06 0.27* 0.06 -0.07 0.13* - 2001 -0.01 -0.85 0.21* 0.21* 0.03 0.13*
1991 0.08 0.07 0.12* -0.13 -0.10 - 2002 -0.10 0.15* 0.27* -0.07 -0.03 0.14*
1992 -0.06 0.13* 0.24* -0.10 0.09 - 2003 -0.04 -0.07 0.12 -0.17* 0.05 0.12*
1993 -0.10 0.13* 0.02 -0.14 0.03 - 2004 -0.00 -0.19* 0.12* -0.06 0.05 0.07
1994 -0.05 0.07 0.09 -0.02 0.10 0.11* 2005 0.10 0.11 0.05 0.01 0.23* 0.27*
1995 -0.02 -0.03 0.11 -0.09 0.07 0.18* 2006 -0.09 0.01 0.07 -0.12 -0.04 0.28*
1996 -0.06 0.14* 0.06 -0.03 0.25* 0.23* 2007 0.02 -0.13 0.12 -0.06 0.18 0.16*
1997 -0.30* 0.02 0.19* -0.06 -0.01 0.09 2008 0.14* -0.08 0.20* -0.10 0.26* 0.15*
1998 0.11 0.13* 0.11 -0.2* 0.16* 0.12* 2009 0.00 -0.06 -0.02 -0.10 -0.08 0.14*
1999 -0.07 0.13* 0.30* -0.11 0.03 0.10* 2010 0.04 0.07 0.16* -0.08 -0.01 0.15*
2000 0.02 -0.05 0.07 -0.03 0.28* 0.06 2011 0.07 0.12* 0.05 -0.01 0.29* 0.15*

Note: *, P=0.05; -, No data

2.2.2, the value ranging from 1 to -1 indicates that the spatial pattern was either clustered, random or dispersed. In other words, the values of Moran's I varied from year to year, indicating that the spatial pattern was constantly changing. In terms of specific disaster type, drought, flood and frost showed relatively clustered patterns, and especially in several certain years the value of Moran's I reached 0.30 and passed the 5% significance test. Hail mainly showed random patterns, except in 1998, 2001 and 2003, when it showed significantly dispersed and clustered patterns, respectively. Contrary to hail, typhoon showed a predominantly clustered pattern. Generally speaking, the spatial pattern of total disasters showed random patterns throughout the period of 1990-2011. However, the spatial pattern of each year was quite different, and the values of Moran's I ranged from -0.30 to 0.14, which indicated a significantly dispersed pattern and clustered pattern, respectively.
Meanwhile, the changing trend of disasters of each province was different. As shown in Figure 4 (as data of typhoon were not successive and mainly distributed in several provinces, M-K tests of typhoon in each province were not performed), the total disaster areas of most of the provinces showed declining trends, with the exceptions of Xinjiang, Yunnan, Inner Mongolia and Heilongjiang, which showed increasing trends. Xinjiang and Yunnan showed particularly significant increasing trends. Meanwhile, all disaster types showed increasing trends in Xinjiang and Heilongjiang. In addition, it should be noted that Heilongjiang was one of the major grain producing areas. In terms of the specific disaster type, drought showed increasing trends in Xinjiang, Tibet, Inner Mongolia, Yunnan, Heilongjiang and Jilin. Flood showed increasing trends in Xinjiang, Heilongjiang, Hunan and Hubei. Hail also showed increasing trends in Xinjiang and Heilongjiang. Different from the other disaster types, frost showed increasing trends in most of the provinces, except seven provinces where it showed decreasing trends.
Potential area covered by disasters was affected by the sown area. The trend of ratio of disaster area was slightly different when considering sown area. For example, drought in Heilongjiang and Tibet changed from an increasing trend to a declining trend, flood in Guangxi and Qinghai changed from decreasing to increasing trend, and the trends of hail and frost also changed to the opposite in several provinces. Overall, the greatest differences were located in Heilongjiang and Guangxi, where the trends changed to the opposite. Heilongjiang changed from increasing to decreasing, while Guangxi changed from decreasing to increasing.
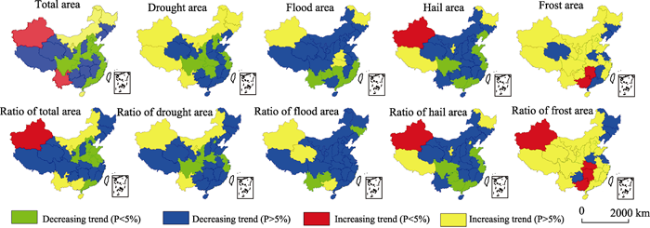
Figure 4 M-K tests of disaster areas and ratios of disaster areas

3.2 Effects on grain production

As shown in Figure 1, there was at least 32.5×10⁶ ha, accounting for 29.4% of the sown area, affected by disasters during the study period. In particular, almost all major grain producing areas were located in the sub-hot spot areas, except Inner Mongolia (Figure 2). Furthermore, a CV of 0.21 indicated that grain production was instable, which suggested that disasters may threaten China’s food security. This result was similar with those of previous studies. It should be noted that the area covered by disasters depended not only on the intensity of the disasters, but also on the sown area. Hot spot areas of disasters merely reflect the overall situation of grain production affected by disasters. In other words, the disaster areas cannot quantify the relative impact of disasters or the sensitivity of grain production to disasters. Per unit area grain yield change can provide a direct response to the impact of disasters. In order to evaluate the effects on grain production, the linear regression model was employed to analyze the relative influence, and the results show that disasters played an important role in per unit area grain yield (Table 3). The regression coefficient (β) was less than 0, indicating that disasters had negative effects on grain production, which would lead to a reduction of per unit area grain yield.
Table 3 Summary of linear regression analysis of disasters’ effects on per unit area grain yield
Area β Adjusted R2 P Area β Adjusted R2 P
China -0.756 0.551 0.000 Henan -0.654 0.399 0.001
Beijing -0.071 0.000 0.847 Hubei -0.560 0.279 0.007
Tianjin -0.741 0.526 0.000 Hunan -0.213 0.000 0.342
Hebe -0.700 0.464 0.000 Guangdong -0.474 0.185 0.026
Shanxi -0.820 0.656 0.000 Guangxi -0.350 0.079 0.110
Inner Mongolia -0.027 0.000 0.903 Hainan -0.168 0.000 0.454
Liaoning -0.779 0.598 0.000 Sichuan -0.698 0.461 0.000
Jilin -0.770 0.573 0.000 Guizhou -0.672 0.424 0.001
Heilongjiang -0.521 0.235 0.013 Yunnan -0.362 0.088 0.098
Shanghai -0.217 0.000 0.332 Tibet -0.255 0.018 0.252
Jiangsu -0.770 0.572 0.000 Shaanxi -0.857 0.720 0.000
Zhejiang -0.655 0.400 0.001 Gansu -0.451 0.164 0.035
Anhui -0.719 0.479 0.000 Qinghai -0.673 0.425 0.001
Fujian -0.601 0.329 0.003 Ningxia -0.071 0.000 0.754
Jiangxi -0.253 0.017 0.256 Xinjiang -0.386 0.107 0.076
Shandong -0.833 0.679 0.000
The values of adjusted R2 varied from 0 to 0.720, denoting that the sensitivity of grain production of each province was quite different. Especially in some major grain producing areas, such as Shandong, Liaoning, Jilin and Jiangsu, the adjusted R2 was larger than 0.572, while the adjusted R2 of Inner Mongolia was 0.017. This suggests that provinces which were seriously affected by disasters, especially those in major grain producing areas, should allot greater amounts of financial and policy support to increase agricultural resilience. Overall, the adjusted R2 of China’s average per unit area grain yield was as high as 0.551, which indicated that 55.1% of the per unit area grain yield change was caused by disasters.
It should be noted that the value 0 did not suggest that disasters had no effects on grain production. The possible reason for the significant difference among adjusted R2 was that per unit area grain yield may be improved by increasing agricultural material inputs and technical progress, such as agricultural infrastructure development, chemical fertilizer, and good seed (Neumann et al., 2010; Zhou et al., 2012). For example, it has been widely accepted that water conservancy construction may increase agricultural resilience and promote agricultural development. However, infrastructure construction projects typically require large amounts of funds, which was a great obstacle for individual farmers under the current household responsibility system. Meanwhile, grain production may be marginalized when the economy underwent rapid development, the typical characteristics were cropland and labor loss. Liu et al. (2005) found that a large amount of cropland was occupied by built-up land in the Yangtze River Delta, Huang-Huai-Hai region and Sichuan Basin, while large areas of the new cropland were converted from other land use types in northern and northeastern China. Long et al. (2010) pointed out that loss of rural labor may be a major issue of rural development, and along with cropland and labor loss, agricultural inputs may also be reduced (Gao et al., 2006), which would lower down grain production’s ability to withstand disasters. This was one reason that Jiangsu and Shandong, which are among the most developed provinces of China, had high adjusted R2.

4 Conclusions

This study explored the spatial pattern change of major agriculture disasters in China and the results indicated that grain production in China was severely affected by disasters. The main conclusions were as follows:
(1) The annual area covered by disasters reached 48.7×10⁶ ha during the study period, accounting for 44.8% of the total sown area. Meanwhile, disasters fluctuated dramatically, which resulted in grain yield instability and food security issues. Generally speaking, the most serious disaster types in China were drought, followed in the order of flood, hail, frost and typhoon. All of the disasters showed high variability and different changing trends. Drought, flood, and hail showed significantly decreasing trends, while frost and typhoon showed increasing trends. Due to the geographical environment, the spatial distribution of each disaster was uneven. Drought and flood showed a gradual change and were distributed across the country. Drought was the dominant disaster type in northern China, while flood was most important disaster type in the southern part. Hail was mainly located in central and northern China, and frost was mainly distributed in southern China. The distribution of typhoon was quite different from the other disasters. It was considerably concentrated and was greatly limited to the southeast coast of China. Furthermore, the Moran's I changed year by year, indicating that the spatial pattern of disasters also changed along with time.
(2) Disasters had negative effects on grain production, causing a large fluctuation in per unit area grain yield. The results indicated that about 55.1% of per unit area grain yield change in China was caused by disasters during the study period. The effects of disasters on each province were quite different. The values of adjusted R2 varied from 0 to 0.72, and the larger the adjusted R2, the worse the resilience of grain production. In particular, some major grain producing areas, such as Shandong, Liaoning, Jilin and Jiangsu, were very seriously affected by disasters, which would threaten China’s food security. It should be noted that the economic development did not enhance the resilience of grain production, as China is currently undergoing rapid urbanization and industrialization. Jiangsu and Shandong were typical regions, and are among the most highly developed provinces in China, but grain production there was seriously affected by disasters, and the adjusted R2 was greater than 0.572. In brief, reducing disaster risk and mitigating the impact of disasters are very important for China’s agricultural development and grain security. One reason for the difference of resilience in grain production was that grain production was marginalized in developed provinces when the economy was undergoing rapid development. Therefore, governments should place more emphasis on grain production and invest more funds in disaster prevention and mitigation, especially in the major grain producing provinces.

The authors have declared that no competing interests exist.

1
Anselin L, 1995. Local indicators of spatial association—LISA.Geographical Analysis, 27(2): 93-115.

2
Ballantine D J, Davies-Colley R J, 2014. Water quality trends in New Zealand rivers: 1989-2009.Environmental Monitoring and Assessment, 186(3): 1939-1950.

3
Barredo J I, 2009. Normalised flood losses in Europe: 1970-2006.Natural Hazards and Earth System Sciences, 9(1): 97-104.

4
Changnon S A, Pielke R A, Changnon Det al., 2000. Human factors explain the increased losses from weather and climate extremes.Bulletin of the American Meteorological Society, 81(3): 437-442.

5
Chau V N, Holland J, Cassells Set al., 2013. Using GIS to map impacts upon agriculture from extreme floods in Vietnam.Applied Geography, 41: 65-74.

6
Chen P, Yu M, Chang Cet al., 2008. Total factor productivity growth in China’s agricultural sector.China Economic Review, 19(4): 580-593.

7
Cheng J, Lu Y Q, 2009. Evolvement of spatial pattern of economy in Jiangsu Province at county level.Acta Geographica Sinica, 64(6): 713-724. (in Chinese)

8
Delgado J M, Apel H, Merz B, 2010. Flood trends and variability in the Mekong River.Hydrology and Earth System Sciences, 14(3): 407-418.

9
Diniz J A F, Bini L M, Hawkins B A, 2003. Spatial autocorrelation and red herrings in geographical ecology.Global Ecology and Biogeography, 12(1): 53-64.

10
Easterling D R, 2000. Climate extremes: Observations, modeling, and impacts.Science, 289(5487): 2068-2074.

11
Edmeades G O, 2013. Progress in achieving and delivering drought tolerance in maize: An update. ISAAA: Ithaca, NY.

12
Fan Z M, Yue T X, Chen C Fet al., 2011. Spatial change trends of temperature and precipitation in China.Journal of Geo-Information Science, 13(4): 526-533. (in Chinese)

13
Gao X W, Zhang L Y, Dong Y Get al., 2006. Demonstration analysis of financial funds to agriculture in China.Review of China Agricultural Science and Technology, 8(1): 64-68. (in Chinese)

14
Getis A, Ord J K, 1992. The analysis of spatial association by use of distance statistics.Geographical Analysis, 24(3): 189-206.

15
Greenough G, McGeehin M, Bernard S Met al., 2001. The potential impacts of climate variability and change on health impacts of extreme weather events in the United States.Environmental Health Perspectives, 109(2): 191-198.

16
Held I M, Delworth T L, Lu Jet al., 2005. Simulation of Sahel drought in the 20th and 21st centuries.Proceedings of the National Academy of Sciences of the United States of America, 102(50): 17891-17896.

17
Hirsch R M, Alexander R B, Smith R A, 1991. Selection of methods for the detection and estimation of trends in water quality.Water Resources Research, 27(5): 803-813.

18
Houghton J T, Ding Y, Griggs D J, et al., 2001. IPCC Climate Change: The Scientific Basis. Cambridge, United Kingdom and New York, NY, USA: Cambridge University Press.

19
Iglesias A, Mougou R, Moneo Met al., 2011. Towards adaptation of agriculture to climate change in the Mediterranean.Regional Environmental Change, 11(1): 159-166.

20
Jia H C, Pan D H, 2013. On the spatial and temporal patterns of flood and drought hazards of China.Disaster Advances, 6(3): 12-18.

21
Khan S, Hanjra M A, Mu J, 2009. Water management and crop production for food security in China: A review.Agricultural Water Management, 96(3): 349-360.

22
Kim S, Shin Y, Kim Het al., 2013. Impacts of typhoon and heavy rain disasters on mortality and infectious diarrhea hospitalization in South Korea.International Journal of Environmental Health Research, 23(5): 365-376.

23
Kunkel K E, Pielke R A, Changnon S A, 1999. Temporal fluctuations in weather and climate extremes that cause economic and human health impacts: A review.Bulletin of the American Meteorological Society, 80(6): 1077-1098.

24
Lambert D K, Parker E, 1998. Productivity in Chinese provincial agriculture.Journal of Agricultural Economics, 49(3): 378-392.

25
Li Y P, Ye W, Wang M, 2009. Climate change and drought: A risk assessment of crop-yield impacts.Climate Research, 39(1): 31-46.

26
Liu J G, Diamond J, 2005. China’s environment in a globalizing world.Nature, 435(7046): 1179-1186.

27
Liu J Y, Liu M L, Tian H Qet al., 2005. Spatial and temporal patterns of China’s cropland during 1990-2000: An analysis based on Landsat TM data.Remote Sensing Environment, 98(4): 442-456.

28
Liu Z H, 2012. Comprehensive analysis of drought disasters in China from 1483 to 2010.Disaster Advances, 5(4): 1275-1280.

29
Long H L, Liu Y S, Li X Bet al., 2010. Building new countryside in China: A geographical perspective.Land Use Policy, 27(2): 457-470.

30
McMichael A J, Woodruff R E, Hales S, 2006. Climate change and human health: Present and future risks.The Lancet, 367(9513): 859-869.

31
Morrissey S A, Reser J P, 2007. Natural disasters, climate change and mental health considerations for rural Australia.Australian Journal of Rural Health, 15(2): 120-125.

32
Myint S W, Wentz E A, Purkis S. J, 2007. Employing spatial metrics in urban land-use/land-cover mapping: Comparing the Getis and Geary indices.Photogrammetric Engineering and Remote Sensing, 73(12): 1403-1415.

33
Neumann K, Verburg P H, Stehfest Eet al., 2010. The yield gap of global grain production: A spatial analysis.Agricultural Systems, 103(5): 316-326.

34
Ni J R, Sun L Y, Li Tet al., 2010. Assessment of flooding impacts in terms of sustainability in mainland China.Journal of Environmental Management, 91(10): 1930-1942.

35
Qiang W L, Liu A M, Cheng S Ket al., 2013. Agricultural trade and virtual land use: The case of China’s crop trade.Land Use Policy, 33: 141-150.

36
Qin Z H, Tang H J, Li W Jet al., 2014. Modelling impact of agro-drought on grain production in China. International Journal of Disaster Risk Reduction, 7: 109-121.

37
Qiu H J, Cao M M, Hao J Qet al., 2013. Relationship between frequency and magnitude of drought damage in China in 1950-2010.Scientia Geographica Sinica, 33(5): 576-580. (in Chinese)

38
Simelton E, 2011. Food self-sufficiency and natural hazards in China.Flood Security, 3(1): 35-52.

39
Sivakumar M V K, 2006. Climate prediction and agriculture current status and future challenges.Climate Research, 33(1): 3-17.

40
Wang R, Jiang T, Gao J Fet al., 1999. 1998 Yangtze River flood: Causes and analysis.Journal of Natural Disasters, 8(1): 16-20. (in Chinese)

41
Wang X F, Li M S, 2012. Analysis on decoupling relationship between natural disasters and grain production in China.Journal of Catastrophology, 27(1): 94-97. (in Chinese)

42
Wang Z, Zhang P Y, Liu X L, 1995. The spatial characteristics of natural disasters in China.Acta Geographica Sinica, 50(3): 248-255. (in Chinese)

43
Woodhouse C A, Overpeck J T, 1998. 2000 years of drought variability in the central United States.Bulletin of American Meteorological Society, 79(12): 2693-2714.

44
Xiao F J, Xiao Z N, 2010. Characteristics of tropical cyclones in China and their impacts analysis.Natural Hazards, 54(3): 827-837.

45
Xu Z X, Takeuchi K, Ishidaira H, 2002. Long-term trends of annual temperature and precipitation time series in Japan.Journal of Hydroscience and Hydraulic Engineering, 20(2): 11-26.

46
Xu Z X, Takeuchi K, Ishidaira Het al., 2005. Long-term trend analysis for precipitation in Asian Pacific FRIEND river basins.Hydrological Processes, 19(18): 3517-3532.

47
Yu Y S, Zou S M, Whittemore D, 1993. Nonparametric trend analysis of water-quality data of rivers in Kansas. Journal of Hydrology,150(1): 61-80.

48
Zhang J Q, 2004. Risk assessment of drought disaster in the maize-growing region of Songliao Plain, China.Agriculture, Ecosystems & Environment, 102(2): 133-153.

49
Zhou D, An P, Pan Zet al., 2012. Arable land use intensity change in China from 1985 to 2005: Evidence from integrated cropping systems and agro economic analysis.The Journal of Agricultural Science, 150(2): 179-190.

50
Zhou Y, Li N, Wu W Xet al., 2013. Exploring the characteristics of major natural disasters in China and their impacts during the past decades.Natural Hazards, 69(1): 829-843.

Outlines

/