Orginal Article

Spatial energy efficiency patterns and the coupling relationship with industrial structure: A study on Liaoning Province, China

  • GUAN Wei , 1, 2 ,
  • XU Shuting 2
Expand
  • 1. Research Center for Marine Economy and Sustainable Development, Liaoning Normal University, Dalian 116029, Liaoning, China
  • 2. School of Urban and Environment, Liaoning Normal University, Dalian 116029, Liaoning, China

Author: Guan Wei (1959-), Professor, specialized in regional economy and industrial planning. E-mail:

Received date: 2014-07-04

  Accepted date: 2014-08-20

  Online published: 2015-03-15

Supported by

The MOE Project of Key Research Institute of Humanities and Social Sciences in University, No.14JJD790044

Science and Technology Research Program Supported by the Education Department of Liaoning Province, No.L2013411

Copyright

Journal of Geographical Sciences, All Rights Reserved

Abstract

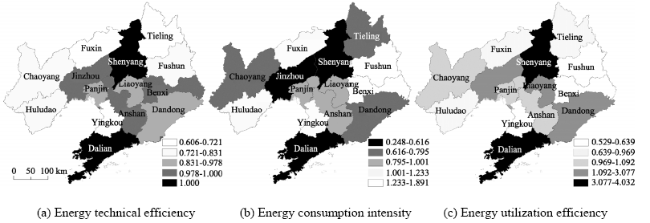
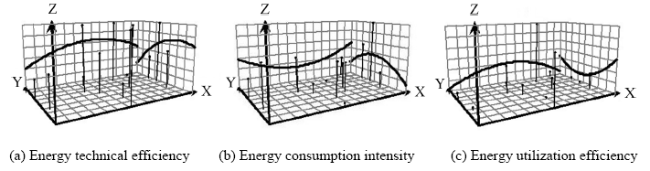
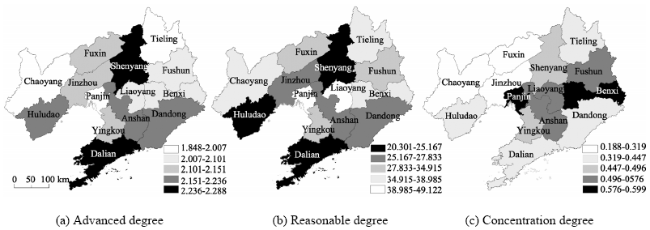
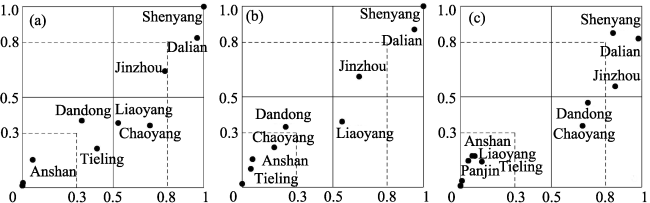
Using a sample of 14 prefecture-level cities in Liaoning Province, this study first explored the spatial hierarchy and structural characteristics of energy efficiency from the following three viewpoints: energy technical efficiency based on data envelopment analysis, energy consumption per unit of GDP, and energy utilization efficiency combining the previous two indexes. After measuring and analyzing the advancement, rationality, and concentration of the industrial structure in each city, we made some generalizations about the coupling features of the energy efficiency and industrial structure in Liaoning, using the coupling degree rating model. Some of our conclusions are as follows: (1) The 14 cities differ significantly in their energy efficiency, with Shenyang, Dalian, Anshan, and Jinzhou enjoying the highest energy efficiency. Northwestern Liaoning and other heavy-industrial cities such as Fushun and Benxi belong to low-efficiency and high-consumption areas. (2) In areas with higher efficiency, the spatial patterns of the energy technical efficiency, energy consumption per unit of GDP, and energy utilization efficiency are, respectively, "π"-,"Ⅱ"- and "H"- shaped. Geographically, the energy utilization efficiency shows different trends from east to west and from north to south. Factors such as the binuclear structure of economic development have a major effect on this spatial pattern of energy efficiency. (3) Southeastern Liaoning enjoys a highly advanced industrial structure. Areas with a highly rational industrial structure form an “H” shape, with Shenyang and Dalian at the two poles. The urban agglomerations in middle and southern Liaoning have a highly concentrated industrial structure. (4) Overall, the coupling between energy efficiency and industrial structure is low in Liaoning, except for Shenyang and Dalian at both ends, where the coupling between an advanced industrial structure and energy efficiency is higher than in other cities.

Cite this article

GUAN Wei , XU Shuting . Spatial energy efficiency patterns and the coupling relationship with industrial structure: A study on Liaoning Province, China[J]. Journal of Geographical Sciences, 2015 , 25(3) : 355 -368 . DOI: 10.1007/s11442-015-1173-z

1 Introduction

With the increasingly apparent imbalance between energy supply and demand, conserving energy and improving energy efficiency are the main approaches to a coordinated economic and energy development program. Economic development strongly depends on energy and, at the same time, has a direct influence on improving energy efficiency. Energy efficiency contributes to energy consumption in order to maintain sustainable development of the whole economy-society-environment system. Energy efficiency is a generalized term and can be measured by a variety of indexes (Wei et al., 2007). Wei Yiming and Liao Hua (2010) divided energy evaluation into seven indexes, including energy macroeconomic efficiency, practice efficiency, physical efficiency, and so on (Wei et al., 2010). Energy efficiency is usually calculated as single-factor or total-factor energy efficiency (Hu et al., 2006). Compared with single-factor energy, total-factor energy efficiency can better reflect the interaction between energy and the economy, and has been widely used by scholars and research institutions (Boyd et al., 2000; Wei, 2007; Zhao, 2010). Total-factor energy efficiency is evaluated mainly through the data envelopment analysis (DEA) method. Considering that labor, capital, technology, and other elements are substituted for energy, this study first adopted the DEA method to measure and analyze the energy efficiency of the 14 prefecture-level cities in Liaoning Province. The energy efficiency measured by the DEA method is the technical efficiency of various elements. Although the method has many advantages, it does not give due consideration to energy as the most important input factor, nor does it effectively evaluate areas with similar factor endowments. To solve this problem, this study used a new index - the ratio of energy technical efficiency measured by DEA to energy consumption per unit of GDP - to analyze the spatial characteristics of energy efficiency and its coupling relationship with the industrial structure.
The regional spatial structure is the spatial distribution and the spatial combination of economic activities in the area (Li, 2006). The spatial structure of economic development consists of the positional relationships, the cluster degree, and the direction and intensity of economic objects in the geographical space (Lu, 2001). It is the result of spatial coupling among the natural environment, market, and government (Wang et al., 2007). The regional industrial structure represents the internal relationship among various industries in the regional economy. The most important function of the industrial structure is to obtain maximum economic benefits from limited resources through industrial transformation and efficient allocation of resources (Dang, 2011). In recent years, the academia has focused on a quantitative analysis of the relationship between energy efficiency and the industrial structure (Qu, 2009; He et al., 2009). However, the distribution structures and relationships were not adequately explored from a spatial perspective. From an analysis of spatial characteristics based on the advancement, rationality, and concentration of the industrial structure in each city, some generalizations are drawn about the spatial coupling features of energy efficiency and the industrial structure.

2 Research area and methods

Liaoning Province is located in the south of Northeast China. Its geographical coordinates are between 118°53′E-125°46′E and 38°43′-43°36′N. It lies in the east of the Eurasian continent and has a temperate continental monsoon climate. Jilin Province borders in the northeast of Liaoning. To the northwest of Liaoning is Inner Mongolia Autonomous Region. To the southwest is the adjacent Hebei Province. Along the southeast of Liaoning flows the Yalu River, and on the other side is the Democratic People’s Republic of Korea. To the south of Liaoning is the Yellow Sea and the Bohai Sea. The land area of Liaoning is about 140,000 km2, accounting for 1.5% of China’s land area. The province has 266 oceanic islands and covers an area of 191.5 km2. Its coastline extends over 2292 km, accounting for 12% of China’s total length. The terrain can be divided into the eastern hilly area, central plains, and the western hilly area. This province has more than 300 rivers flowing though it. The drainage area of more than 5000 km2 covers 17 rivers-Liaohe, Hunhe, and so on.
Liaoning is an important international shipping center and transportation junction of Northeast Asia. It has nearly 100 years of industrial history, and its industrial system, characterized by heavy industries such as petrochemicals, machinery, and metallurgy, plays an important role in the Chinese economy. As one of the important early industrial bases of China, Liaoning uses a huge amount of energy. It consumed about 223.139 million tons of standard coal in 2012, accounting for about 6% of the total national energy consumption. Besides, the large proportion (over 70%) of coal in the energy consumption structure, low energy reserves and exploitation, limitations of the environment, and transport capacity constraints are energy bottleneck problems that will increasingly hamper economic development. Therefore, in the process of transforming the economic structure, improving the energy utilization efficiency is a problem that needs to be solved urgently.
We adopt DEA, a non-parametric statistical method based on the concept of relative efficiency to measure total factor energy efficiency, and compare the relative efficiencies of a group of decision-making units (DMU) with multiple inputs and outputs by constructing a non-parametric envelope production frontier (Wei, 2000, 2011). Energy efficiency research is an analysis of input-output productivity, for which DEA is a suitable technique (Fan et al., 2014). The DEA method can help calculate the technical and allocation efficiencies of a group of DMUs. Technical efficiency measures the ability of a DMU to minimize the input and maximize the output, and allocation efficiency evaluates the ability of achieving an optimal combination of elements, which gives the relative price of input factors. Allocation efficiency is generally not considered as it involves price, but the technical efficiency of a DMU is regarded as a comprehensive efficiency measure. In the case of variable returns to scale (VRS), the comprehensive technical efficiency can be divided into pure technical efficiency and scale efficiency. Pure technical efficiency reflects the production efficiency of a unit of an input factor of production under a certain scale, and scale efficiency represents the gap between the actual scale and the optimal production scale (Liang et al., 2012). To highlight the significance of energy consumption in energy efficiency, this study evaluated the total factor energy efficiency measured by DEA and then analyzed the spatial characteristics of energy efficiency, using a new index that combines the energy technical efficiency estimated by DEA with energy consumption per unit of GDP. At the same time, the geographical statistics method was adopted to analyze the spatial pattern of energy efficiency in Liaoning. Spatial trends reflect the main features of change in a geographical area of objects in a space, mainly revealing the general rules of space objects and neglecting local variation. Trend surface analysis consists in fitting a mathematical surface based on spatial sampling data to reflect the spatial distribution, especially in the east-west and north-south directions (Liu et al., 2011).
After a full consideration of the choice of input and output indicators for each analysis, this study chose GDP as the proxy for output and total investment in fixed assets, number of employees, and the total energy consumption of the whole society as proxies for capital, labor force, and energy, respectively, to measure DEA energy efficiency. To calculate capital stock, most scholars adopt the perpetual inventory method and Zhang Jun’s approach (Zhang et al., 2004). Capital stock data for prefecture-level cities in Liaoning are difficult to obtain, so total investment in fixed assets was selected as the proxy for capital. Based on the export-oriented model of VRS, this study evaluated the comprehensive energy efficiency by DEA of prefecture-level cities in Liaoning based on average values for the 2008 to 2012 period. All data were derived from Liaoning Statistical Yearbook (2000-2013), 2013 Liaoning Yearbook, and China Energy Statistical Yearbook 2013. The software used for data calculation and analysis includes MaxDEA Pro5.2, Mapinfor11.0, and ArcGIS10.0.

3 Spatial patterns of energy efficiency

3.1 Energy technical efficiency

From the results of energy technical efficiency, five cities (Shenyang, Dalian, Anshan, Benxi, and Jinzhou) were DEA efficient, constituting the energy efficiency frontier, and enjoyed the highest energy efficiency in Liaoning. Four cities (Fuxin, Chaoyang, Yingkou, and Tieling) were relatively inefficient, and their comprehensive energy technical efficiency was less than 0.750, far below the average of Liaoning. Five cities (Dandong, Liaoyang, Panjin, Huludao, and Fushun) were regions with medium energy efficiency. Energy technical efficiency can be divided into pure technical efficiency and scale efficiency. Pure technical efficiency is the efficiency from technology and management, and scale efficiency reflects the gap between actual scale and optimal production scale under the premise of a certain technology and management environment. Five cities (Shenyang, Dalian, Anshan, Benxi, and Jinzhou) were all efficient with pure technical efficiency and scale efficiency. Of the other nine cities, Fuxin and Liaoyang were pure technology effective but not scale effective. This showed that these two cities could not reduce investment with the present output, and the input factors were fully utilized. Three cities (Dandong, Panjin, and Huludao) failed to realize pure technical efficiency and enjoyed medium energy efficiency. Yingkou was far below the average level and was relatively inefficient. As far as energy scale efficiency is concerned, the nine cities were all scale inefficient. Moreover, they had the facts that extra investment of energy and other elements or lack of economic output, even increasing part of the input, the level of output will not change currently. Huludao and Panjin are typical of this situation.
From the viewpoint of space, energy technical efficiency formed a “π”-shaped structure composed of Jinzhou, Shenyang, Benxi, Anshan, and Dalian, all highly energy-efficient regions. Low-energy-efficiency regions were mainly in the northwest of Liaoning (Tieling, Fuxin, Jinzhou, and Chaoyang). Energy technical efficiency presented uneven development in the cities of Liaoning Coastal Economic Zone. From Figure 1, Dalian, Jinzhou, Panjin, Dandong, Huludao, and Yingkou represented five different grades of energy technical efficiency, similar to the Shenyang Economic Zone. The space distribution showed the following trends: it first rose and then dropped from east to west; the high points were concentrated in the central region; energy technical efficiency was higher in the eastern than the western regions; the trend in north-south direction was mainly upward; the high points were concentrated in the central and southern regions.
Figure 1 Grade distribution of energy efficiency in Liaoning Province

3.2 Energy consumption intensity

Energy consumption intensity is the most commonly used economic indicator of energy efficiency. It is the energy consumption of output per unit during a period of time in a country, area, sector, or industry. The economic foundation, industrial structure, technical level, and other factors differ across regions, leading to significant regional differences in energy consumption. Energy consumption intensity usually refers to the energy consumption per unit of GDP, and the reciprocal of energy consumption per unit of GDP is called energy productivity or macroscopic energy efficiency.
The lower the energy consumption intensity is, the higher the energy efficiency. The dark area in Figure 1b indicates the low-energy-intensity area, that is, the high-energy-efficiency area. Intuitively, energy consumption intensity forms a “Ⅱ”-shaped structure composed of the high-energy-efficiency regions of Chaoyang, Jinzhou, Shenyang, Tieling, Dalian, and Dandong. These areas can be divided into three types. The first category includes Shenyang and Dalian, the two poles of economic growth in Liaoning. The second category includes Dandong and Jinzhou, the highlighted areas among the light and tertiary industries. The third category includes Tieling and Chaoyang, which hosts a large proportion of primary industries and are major grain-producing areas. High-energy-consumption areas are concentrated in two major heavy industry bases: Fushun and Benxi. Yingkou too consumes an enormous amount of energy. The energy consumption of Yingkou reflects the importance of economies of scale, one of the factors determining energy consumption. The energy consumption per unit of GDP showed the following trends: it initially dropped and then rose from east to west; the low consumption points were concentrated in the central region; the eastern regions showed higher consumption than the western regions; consumption first rose and then dropped from north to south; the high points were concentrated in the central region; the northern regions showed higher consumption than the southern regions (Figure 2b). From a national perspective, Liaoning overall has a single energy structure, and a weak supply diversification capacity. Coal accounts for about 76% of total energy consumption. This proportion is much higher than the national average. Liaoning should actively adjust the uneven development of energy intensity among regions, and gradually narrow the gap with other provinces.
Figure 2 Trend distribution of energy efficiency in Liaoning Province

3.3 Energy utilization efficiency

Energy utilization efficiency is a technical term, and there is no clear quantitative criterion to measure it. Generally speaking, energy utilization efficiency is the ratio of energy inputs to the effective output. The energy utilization efficiency indicator constructed in this study is the ratio of energy technical efficiency measured by DEA to energy consumption per unit of GDP, which is equal to the product of energy technical efficiency measured by DEA and energy productivity. This index, which combines technical factors with energy intensity, shows a higher degree of differentiation for municipal energy efficiency evaluation.
As shown in Figure 1c, the spatial patterns of energy utilization efficiency are obviously different from those of energy technical efficiency and energy productivity. Energy utilization efficiency had an “H”-shaped structure (but not the “π” and “Ⅱ” forms), composed of the high-energy-efficiency regions of Jinzhou, Shenyang, Liaoyang, Dandong and Dalian. The “H” shape was obviously a combination of the “π” and “Ⅱ” shapes. Influenced by the dual structure characteristics of economic development in Liaoning, the areas with higher energy utilization efficiency formed an “H”-shaped structure, with Shenyang and Dalian representing the two poles and the Shenyang-Dalian railway lines constituting the axis of the “H.”
The distribution of space showed the following trend: energy utilization efficiency first rose and then dropped from east to west, and from south to north; it was higher in the eastern regions than in the western regions, and in the southern regions than in the northern regions. Overall, this spatial trend was opposite to that of energy consumption per unit of GDP. However, it was similar to the energy technical efficiency trend in the east-west direction, and opposite to the north-south trend. On the one hand, these results indicated that the energy utilization efficiency indicator constructed in this study was greatly influenced by energy consumption intensity and that energy technical efficiency could be taken as the coefficient of the reciprocal of energy consumption intensity. On the other hand, the spatial difference between the three kinds of energy efficiency was mainly reflected in the north-south direction, suggesting that the energy efficiency imbalance is more pronounced in the latitudinal direction. Figure 2 shows an obvious directivity in the spatial distribution of the equal-efficiency area and an irregular zonal pattern in the northeast-southwest distribution. The spatial distribution of the main traffic arteries in the northeast-southwest direction had a great relevance to the spatial distribution of energy utilization efficiency. Overall, the spatial structure of energy utilization efficiency showed a point-axis mode.

3.4 Energy efficiency driven by differences

Regional difference in natural conditions is the basic reason for the spatial character of energy utilization efficiency in Liaoning. The terrain in Liaoning can be divided into the eastern hilly area, the central plain area, and the western hilly area. The central plain area is rich in resources, has a developed traffic system, and enjoys immense location advantages. Areas with high energy efficiency are concentrated in the central plains. Precipitation is the main water source in Liaoning. Near the Yellow Sea, the rainfall in southeastern mountains is abundant. The rainfall in the northwest is less because of drought and a sandy wind. The water resources in Liaoning decrease from southeast to northwest. Water resources in central area constitute 30% of the province’s total. Drought, barren, and other natural conditions in northwest area restrict the improvement of energy utilization efficiency.
The binuclear structure formed by Shenyang and Dalian, as the growth poles of economic development, is the economic rationale of the spatial pattern of energy efficiency. Shenyang, the capital of Liaoning, is located in the middle of the province and is the center of the northeast Asia economic circle and Bohai economic circle. Shenyang has a strong manufacturing base and technological strength; its industrial structure has a highly complementary and associative relationship with that of the surrounding city. Located in the southernmost tip of the Liaodong peninsula, Dalian is the core city of the historic northeastern industrial base and the Liaoning coastal economic zone. With obvious geographical and industrial advantages, Dalian is well placed to undertake international industrial transfer and realize industrial structure optimization and upgrading. Shenyang and Dalian, two cities with a strong economic foundation and economic status, are the two poles of the spatial pattern of energy efficiency.
The resource-oriented industry layout is the historical reason for the formation of spatial patterns of energy efficiency. The oil resources of Liaoning are mainly distributed in the middle and lower reaches of the Liaohe River, Panjin, southwest of Shenyang, and the west of Liaoyang. Coal resources are mainly distributed in Shenyang, Tieling, Fuxin, Fushun, and Liaoyang. Fushun is an important national base for the energy and raw materials industries, is the largest petrochemical city in northern China, and hosts the Liaoning power plant, the largest in Northeast China. Benxi is a production base for the iron and steel industry in China. The economic development of these cities is founded on energy-intensive industries, in which energy consumption per unit of GDP is relatively high. This is a common problem faced by the old industrial cities of the northeast.

4 Spatial characteristics of industrial structure

4.1 Advanced industrial structure

Industrial structure optimization denotes the dynamic transformation process of the industrial structure from a low level to a high level, as well as the successive transfer processes from primary to secondary and tertiary industries. Using the industrial weighting vector and the corresponding angle of axis ratio, which varies with industry proportionality, this study constructed an index of advanced degrees (Zheng et al., 2011). 
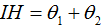
, whereθ1 denotes the effect of the transformation of a primary industry to a secondary and tertiary industry. The greater the value ofθ1 andθ2, the higher the transfer level is. The greater the value of IH, the higher the level of industrial structure is. 
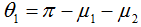
.μ1 andμ2 denote the vector angles from (x1, x2, x3) to (0, 1, 0) and from (x1, x2, x3) to (0, 0, 1), respectively. x1, x2, and x3 denote, respectively, the proportion of primary, secondary, and tertiary industries’ value added in GDP. 
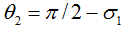
.σ1 denotes the vector angle between (x2, x3) and (0, 1). The following is the calculation formula for the two- and three-dimension angles.
This paper evaluates the degree of advancement of the industrial structure according to the IH index for 14 cities of Liaoning. The results showed that, for Shenyang, Dalian, Anshan, Fushun, Benxi, and Liaoyang, the industrial structure did not change from 2008 to 2012. The industrial structure continued to grow for Yingkou, Panjin, Tieling, and Huludao; it changed to the V type for Dandong, Jinzhou, Fuxin, and Chaoyang. For a more reasonable comparison of the current industrial structure of cities, the analysis was based on the five years’ mean values. The following analysis of the reasonableness and concentration of the industrial structure was also based on the five years’ mean values.
According to the high-low regional development type, Shenyang, Dalian, Anshan, Dandong, and Huludao are highly developed regions as far as industrial structure is concerned. Jinzhou, Yingkou, Fuxin, and Fushun are moderately developed regions. Benxi, Liaoyang, Chaoyang, Liaoning, and Panjin are the least-developed regions. The industrial structure of Liaoning is mainly based on secondary industries. Among the secondary industries, the proportion of heavy and basic industries is relatively large. Compared with the southeast coastal provinces, Liaoning has a lower-level industrial structure. Shenyang and Dalian have a significant binuclear spatial industrial structure. Areas with highly developed industrial structures are mainly concentrated in the south of Liaoning coastal cities, where most industries are competitive. Besides, new high-technology industries are highly developed, and coastal tourism and other modern service industries play an important role.

4.2 Reasonable industrial structure level

Rationalization is the basis of an advanced industrial structure. Industrial structure rationalization refers to the adoption of production processes needed for proportionality. It is the process of pursuing harmonious growth on a moderate scale. It is also the process of strengthening coordination and improving relationships among industries continuously. There are numerous methods and parameters for the evaluation of rationalization. The criterion selected in this study is to judge whether the industrial structure, in different stages of economic development, is reasonable according to the international benchmark based on a standard industrial structure proposed by Chenery. The analysis is based on a deviation index to evaluate the reasonableness of the industrial structure, as well as the traditional industry classification method. Xi denotes the proportion of industrial added value in GDP. In terms of the industrial structure corresponding to the global GDP per person as the reference, the exchange rate method was used to measure the standard industrial structure in Liaoning. According to the criterion of GDP per person and the industrial structure changes in the 2010 World Development Report of the World Bank and research findings on Liaoning (Li et al., 2012), this study adopted X*=(8.32, 34.74, 56.94) as a standard vector to measure the reasonableness of the industrial structure in Liaoning. The deviation index is as follows:
P indicates the deviation in the industrial structure, that is, the gap between the regional industry structure (i.e., the lower level of industrial structure rationalization) and the standard structure. According to the results for each city in Liaoning, the spatial characteristics were similar between reasonable-level and advanced-level industrial structures. Shenyang, Dalian, Anshan, Huludao, and Jinzhou are highly developed regions. Dandong, Fuxin, Fushun, Yingkou, and Chaoyang are moderately developed regions. Tieling, Benxi, Liaoyang, and Panjin are less-developed regions. The spatial distribution of reasonable industrial structure levels formed an H shape, similar to energy efficiency. Shenyang, Dalian, and Huludao were the leaders, and Panjin and Liaoyang the laggards. Industrial structure represents not only the state of regional economic development but also the resource and environmental foundation. Primary industries are mainly based on water and land resources. Secondary industries mainly depend on mineral and energy resources. Tertiary industries cover elements such as the environment and human intelligence. A reasonable industrial structure represents rational development and utilization of resources. Reasonable degrees of industrial structure, to some extent, also reflect the degree of rational utilization of energy resources.

4.3 Concentration of the industrial structure

Industrial layout is an important spatial resource allocation system. Differences in the distribution of factors such as natural resources lead to differences in the regional industrial layout. At the same time, the imbalance in economic development promotes the industrial agglomeration phenomenon and industrial structure convergence. The centralization index is an indicator to evaluate the degree of spatial concentration of geographic elements, or degree of specialization of economic factors. It can be used to analyze the concentration of regional industry, as well as its changes, in a certain period. The formula of the centralization index is I = (A - R)/(M - R), where A, M, and R denote the total cumulative percentages of the three industries in each city. The total cumulative percentage assumes that the three industries are concentrated, and evenly distributed, in each city. The centralization index ranges from 0 to 1; 1 indicates absolute concentration, and 0 represents even distribution.
The calculation showed that cities with high-concentration industrial structures were mainly located in the central and southern urban agglomerations of Liaoning. This suggested that the industrial structure of the urban agglomerations was greatly isomorphic, and regional industrial division was not obvious. This would hinder the growth of comprehensive competitiveness in urban agglomerations. Panjin and Benxi were the cities with the highest degree of concentration. Cities with heavy industry, such as Fushun and Anshan, had a relatively high degree of concentration, too. Concentration was low in the cities of Dandong, Jinzhou, and Chaoyang, which showed remarkable changes during the five years. Obviously, these areas had dynamic factors leading to a variety of industrial structures. From Figure 3c, regions with low-concentration industrial structures were mainly located in the northwest of Liaoning. These regions were characterized by a relatively great proportion of traditional agriculture and a low-level economy. The agglomerations in Liaoning are backward (Guan et al., 2008, 2012), and improving their crop productivity and ensuring food security through all development stages is one of the toughest tasks (Zhang et al., 2014).
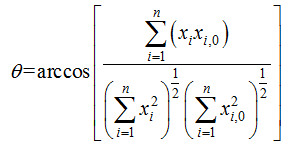
Figure 3 Spatial distribution of industrial structure in Liaoning Province

5 Spatial coupling relationships

5.1 Rating model for the degree of coupling

The degree of coupling is an effective measure of the interaction between systems. Industrial development creates stress effects on energy resources, which in turn lead to constraint effects on the industrial structure. They interact with each other, constituting coupling interaction. Coupling between systems can be measured in discrete degrees between the variables, and the coefficient of variation is an important indicator of the degree of coupling. The coupling model, which is based on the coefficient of variation, can effectively analyze the coupling relationship between two systems. The greater the value of C in the coupling model, the higher the degree of coupling is.
where E(x) and Si(y) represent the comprehensive index of energy efficiency and industrial structure. E(x) is the value of energy utilization efficiency. Si(y) represents the advanced, reasonable, and concentration degrees of industrial structure. K is the difference coefficient, ranging from 2 to 5. To clearly differentiate the degrees, this study assumed a k value of 4. C is the horizontal axis and R the longitudinal axis that divide the spatial coupling type of energy efficiency and industrial structure. R is the coupling coefficient, whose weights are set at 0.6 and 0.4.
Before calculation, the min-max standardized methods are applied for standardization of data. The values of C and R are both between 0 and 1 (Ma et al., 2012) according to the median method for the segmentation of coupling degrees, as shown in Table 1.
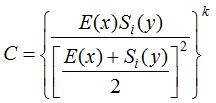
Table 1 The reference standard of coupling & coordinating stage
Coupling degree Coupling stage Coupling
coordination degree
Coupling
coordination degree
Comprehensive
coordination stage
0<C≤0.3 Separate stage 0<R≤0.3 Low coupling
coordination stage
Low coordination
separate stage
0.3<C≤0.5 Antagonistic stage 0.3<R≤0.5 Middle coupling
coordination stage
Middle coordination
antagonistic stage
0.5<C≤0.8 Run-in stage 0.5<R≤0.8 High coupling
coordination stage
High coordination
run-in stage
0.8<C≤1 Coupling stage 0.8<R≤1 Extreme coupling
coordination stage
Extreme coordination
coupling stage

5.2 Spatial coupling between energy efficiency and industrial structure

Figure 4 shows the coupling conditions for energy efficiency and industrial structure in Liaoning. Figures 4a, 4b, and 4c show the spatial coupling distribution of energy efficiency for the advanced, reasonable, and concentrated industrial structure types, respectively. The figures do not show some cities because their degree of coupling was close to zero. Intuitively, the coupling distributions in the three figures show similar structural features. On the whole, the most notable features of spatial coupling between energy efficiency and industrial structure were as follows: energy efficiency and industrial structure showed a low degree of coupling in Liaoning, except for Shenyang and Dalian. Anshan, Fushun, Benxi, Yingkou, Panjin, and Huludao were each at a low stage of coordination. These cities manifested a vague and uncoordinated relationship between energy efficiency and industrial structure. Of these cities, Anshan displayed a significantly higher degree of coupling than the other six cities, and had great potential for a coordinated approach to economic development through energy efficiency. In addition to Shenyang and Dalian, the cities of Jinzhou, Dandong, Liaoyang, and Chaoyang had a high degree of coupling. Jinzhou and Dandong were coupled with a high level and Liaoyang and Chaoyang with a low level of energy efficiency and industrial development.
Figure 4 Coupling distribution of energy efficiency and industrial structure
Specifically, in the coupling relationship between energy efficiency and advanced industrial structure, Dandong was at the middle antagonistic coordination stage, Tieling was at a low antagonistic coordination stage, Liaoyang and Chaoyang were at the middle coordination run-in stage, and Jinzhou was at a high coordination run-in stage. In the coupling relationship between energy efficiency and rational industrial structure, Dandong was at the middle antagonistic coordination stage, Liaoyang was at the middle coordination run-in stage, and Jinzhou was at a high coordination run-in stage. In the coupling relationship between energy efficiency and concentration of industrial structure, Dandong and Chaoyang were at a high coordination stage.
On the whole, the coupling relationship between an advanced industrial structure and energy efficiency is significantly better than in the other two charts; the coupling points in Figure 4a are more evenly distributed. Moreover, regarding the value of each coupling point, the mean and median degrees of the coupling between energy efficiency and industrial structure advancement were both higher than the degrees of rationality and concentration of the industrial structure. This shows a close relationship between upgrading the industrial structure and improving energy efficiency; upgrading the industrial structure is the key to improving energy efficiency and implementing an energy conservation policy (Wang et al., 2011). This is mainly due to the huge energy density differences among different industries, such as metallurgy, chemicals, and construction, in which the energy consumption per unit is about 3 to 4 t standard coal. It is more than 50 times in electronic, communication equipment, and precision instrument manufacturing industries (Zhang, 2005).

6 Conclusions and discussion

6.1 Conclusions

(1) From the perspective of regional differences and spatial characteristics of energy efficiency, regional energy efficiencies were significantly different, and the spatial distribution structure had generally been established. The binuclear structure of economic development and other factors had a major effect on the formation of the spatial pattern of energy efficiency. The northwestern part of Liaoning and cities with heavy industries, such as Fushun and Benxi, were the key areas for improving energy efficiency.
(2) From the development and industrial structure perspectives, the advancement and rationality of the industrial structure were characterized by the same spatial pattern, but the industrial structure concentration showed a quite different spatial pattern. The southeastern regions of Liaoning enjoyed a highly advanced industrial structure.
(3) From the perspective of the spatial coupling relationship between energy efficiency and industrial structure, the overall degree of coupling was low and imbalanced in geographical space. The degree of coupling between the industrial structure and energy efficiency was relatively high. Upgrading the industrial structure was an important means to improving energy efficiency.

6.2 Discussion

(1) According to the inverted “U”-shaped theory proposed by Jeffery G. Williamson in the 1960s, regional development first presents balances with economic growth, then shows an imbalance, and finally achieves equilibrium. This is partly because of the unbalanced and non-coupling condition of energy utilization efficiency in Liaoning and the impossibility of establishing an industrial structure based on regional development in the economic development stage. As regards its social and economic development status, Liaoning is a microcosm of China. Ever since China adopted reforms and opened up its economy, the country has followed an unbalanced development policy, which has led to economic disparity among East, Central, and West China. This disparity in development is also reflected within provinces, Liaoning Province is a typical case because of the large proportion of state-owned enterprises.
(2) The lack of harmony between energy efficiency and industrial structure in Liaoning is mainly due to the following reasons: Liaoning has failed to establish a rational division of labor system based on the comparative advantages of its three economic zones, to fully exploit its complementary advantages, and to implement resource sharing. A unified planning system to promote regional economic integration has not been established on a sound footing. The extensive energy use and industrial structure convergence have not been integrated with economic factors. The polarization and diffusion effects have not been given full play in their respective roles.

The authors have declared that no competing interests exist.

1
Boyd G A, Pang J X, 2000. Estimating the link-age between energy efficiency and productivity.Energy Policy, 28(5): 289-296.

2
Dang Yaoguo, Liu Sifeng, Wang Qingfeng, et al., 2011. Theory and Practice of the Regional Industrial Structure Optimization. Beijing: Science Press, 39-48. (in Chinese)

3
Fan Fei, Du Debin, Wang Xinzhou, 2014. The measure and characteristics of spatial-temporal evolution of China’s science and technology resource allocation efficiency.Journal of Geographical Sciences, 24(3): 492-508.

4
Guan Wei, Guo Jiajing, Zhou Xintong, 2012. Evaluation on logistics industry development in the central cities of Northeast China based on principal component analysis.Journal of Liaoning Normal University: Natural Science Edition, 35(2): 252-258. (in Chinese)

5
Guan Wei, Zhu Haifei, 2011. Temporal-spatial analysis of inter-country economic differences in Liaoning province based on ESDA.Geographical Research, 30(11): 2008-2016. (in Chinese)

6
He Canfei, Wang Junsong, 2009. Economic transition and energy intensity in China.Scientia Geographica Sinica, 29(4): 461-469. (in Chinese)

7
Hu J L, Wang S C, 2006. Total-factor energy efficiency of regions in China.Energy Policy, 34(17): 3206-3217.

8
Li Xiaojian, 2006. Economic Geography. Beijing: Higher Education Press, 173-190. (in Chinese)

9
Li Xinzhan, Song Hemin, Zheng Xin, 2012. The rationalization analysis of industrial structure of Liaoning province based on deviation degree model.Journal of Shenyang University of Technology, 31(2): 35-37. (in Chinese)

10
Liang Liutao, Yang Jiantao, 2012. Analysis of the tourism efficiency and its decomposition based on DEA.Geographical Research, 31(8): 1422-1430. (in Chinese)

11
Liu Fengchao, Yang Ling, Zhao Chenhao, 2011. The spatial structure analysis of the economic development in Liaoning province: The measurement on the GIS platform.Journal of Dalian University of Technology: Social Sciences, 32(3): 1-5. (in Chinese)

12
Lu Dadao, 2001. An analysis of spatial structure and optimal regional development.Acta Geographica Sinica, 56(2): 127-134. (in Chinese)

13
Ma Li, Jin Fengjun, Liu Yi, 2012. Spatial pattern and industrial sector structure analysis on the coupling and coordinating degree of regional economic development and environment pollution in China.Acta Geographica Sinica, 67(10): 1299-1307. (in Chinese)

14
Qu Xiao’e, 2009. An analysis on Chinese inter-provincial differences in energy efficiency and their determinations.Economic Theory and Business Management, (2): 46-52. (in Chinese)

15
Wang Qiang, Zheng Ying, Wu Shidaiet al., 2011. Mechanism of energy efficiency response to industrial restructuring and energy consumption structure change.Acta Geographica Sinica, 66(6): 741-749. (in Chinese)

16
Wang Yang, Zhao Wanmin, Guo Yue, 2007. Measuring regional economical non-balanced status based on geo-info technology: A case study of Chongqing.China Soft Science, (9): 61-68. (in Chinese)

17
Wei Chu, Shen Manhong, 2007. Energy efficiency and energy productivity: A comparison based on the panel data by province.The Journal of Quantitative & Technical Economics, (9): 110-121. (in Chinese)

18
Wei Chu, Shen Manhong, 2007. Energy efficiency and its influencing factor: Based on the positive analysis of DEA.Management World, (8): 66-76. (in Chinese)

19
Wei Quanling, 2000. Date envelopment analysis.Chinese Science Bulletin, 49(17): 1793-1808. (in Chinese)

20
Wei Quanling, 2012. Data Envelopment Analysis Models for Estimating Relative Efficiency-DEA and Network DEA. Beijing: China Renmin University Press, 1-6. (in Chinese)

21
Wei Yiming, Liao Hua, 2010. Seven energy efficiency indicators and their measurement approaches.China Soft Science, (1): 128-137. (in Chinese)

22
Zhang Jun, Wu Guiying, Zhang Jipeng, 2004. The estimation of China’s provincial capital stock: 1952-2000.Economic Research, (10): 35-44. (in Chinese)

23
Zhang Xiaoping, 2005. Temporal-spatial characteristics of energy consumption in China and its determination since the 1990s.China Population, Resources and Environment, 15(2): 38-41. (in Chinese)

24
Zhang Zhao, Wang Pin, Chen Yiet al., 2014. Spatial pattern and decadal change of agro-meteorological disasters in the main wheat production area of China during 1991-2009.Journal of Geographical Sciences, 24(3): 387-396.

25
Zhao Yuan, Hao Lisha, Yang Zuying, 2010. Regional differentiation of energy efficiency and its causes in Jiangsu.Acta Geographica Sinica, 65(8): 920-927. (in Chinese)

26
Zheng Shaozhi, Chen Zhihui, 2011. An empirical study on industry structure and economic growth-based on the analysis of China, Guangdong and Guangzhou.Industrial Economic Review, (5): 55-60. (in Chinese)

Outlines

/