Orginal Article

A novel method for approximating intercity networks: An empirical comparison for validating the city networks in two Chinese city-regions

  • ZHAO Miaoxi , 1 ,
  • WU Kang , 2, * ,
  • LIU Xingjian 3 ,
  • BEN Derudder 4
Expand
  • 1. College of Architecture/State Key Laboratory of Subtropical Building Science, South China University of Technology, Guangzhou 510640, China
  • 2. College of Urban Economics and Public Management, Capital University of Economics and Business, Beijing 100070, China
  • 3. Department of Geography and Earth Sciences, University of North Carolina at Charlotte, Charlotte, NC, 28223, USA
  • 4. Department of Geography, Ghent University, Ghent, B9000, Belgium

*Corresponding author: Wu Kang (1985-), PhD and Assistant Professor, specialized in urban economic geography and planning. E-mail:

Author: Zhao Miaoxi (1979-), PhD and Associate Professor, national registered urban planner, specialized in urban and regional planning. E-mail:

Received date: 2014-03-17

  Accepted date: 2014-04-02

  Online published: 2015-03-15

Supported by

National Natural Science Foundation of China, No.51478189;No.41401178

National Social Science Fund, 11&ZD154

State Key Laboratory of Subtropical Building Science, No.2013KB20

Fundamental Research Funds for the Central Universities, No.2013ZZ0022

Copyright

Journal of Geographical Sciences, All Rights Reserved

Abstract

A network perspective has increasingly become an organizational paradigm for understanding regional spatial structures. Based on a critical overview of existing empirical models for estimating intercity networks based on firm linkages, this study extends the recently proposed regional corporate city model algorithm by proposing a new method for approximating urban networks based on the locational strategies of firms. The new method considers both regional and hierarchical network features and avoids the information loss associated with the conversion from two-mode firm-city networks to one-mode city-city networks. In addition, networks estimated by using the method proposed herein are suitable when employing social network analysis. Finally, this method is empirically validated by examining intercity firm networks formed by advanced producer services firms in China’s two largest metropolitan areas, namely the Yangtze River Delta and Pearl River Delta. The presented empirical analysis suggests two main findings. First, in contrast to conventional methods (e.g., the interlocking city network model), our new method produces regional and hierarchical urban networks that more closely resemble reality. Second, the new method allows us to use social network analysis to assess betweenness and closeness centralities. However, regardless of the model applied, the validity of any method that measures urban networks depends on the soundness of its underlying assumptions about how network actors (firms, in our case) interact.

Cite this article

ZHAO Miaoxi , WU Kang , LIU Xingjian , BEN Derudder . A novel method for approximating intercity networks: An empirical comparison for validating the city networks in two Chinese city-regions[J]. Journal of Geographical Sciences, 2015 , 25(3) : 337 -354 . DOI: 10.1007/s11442-015-1172-0

1 Introduction

In the past 30 years, global urban systems have been deeply influenced and reshaped by globalization and informatization, leading to a complicated change to geographical scope combined with widening spatial differentiation and mushrooming connectivity (Sheppard, 2002; Dicken et al., 2001; Florida, 2005). Against this background, connections between cities and regions have been reconstructed, resulting in city networks, spatial organizational structures that comprise different sized cities interconnected at different spatial scales (Camagni et al., 2004). Being an appropriate metaphor for the complicated relationship between social actors in this new era, the term “network” has lately also become popular in the field of social science and economics (Dicken et al., 2001). On the one hand, interactions between globalization and regionalization have led to networked global production. On the other hand, the coexistence of space of places and space of flows due to informatization has facilitated networked regional spaces (Henderson et al., 2002; Castells, 1996; Wu et al., 2013).
Further, there has recently been increasing interests in conducting network-related research within economic geography and urban geography, two large sub-disciplines of human geography. Such explorations focus on researching global production and world city networks (Henderson et al., 2002; Taylor, 2004; Gregory et al., 2009). Typically, city network research can be classified into studies of world city networks and polycentric urban regions depending on the spatial scale, which investigate intercity connections and interactions at the global, national and regional spatial scales, respectively (Taylor, 2002; Hall et al., 2006). The empirical research of intercity networks has inspired a large body of literature, by three main strands including firm organization networks (Wall et al., 2011), infrastructure networks (Derudder et al., 2005; Choi et al., 2006), and socio-cultural mechanisms (Taylor, 2005). More specifically, the first one is the primary approach in existing study, while the dominant concern on network study in western urban geography is the advanced producer services (APS) network research (Taylor et al., 2009).
The regional restructuring of producer services has become one of the most important manifestations of economic globalization. Sassen (2001) believed that even though the production activities of multinational corporations have been dispersing increasingly, demand for spatial aggregation in management and decision-making processes has also risen. According to Sassen (2001), global cities are the management centers of global economic networks, while the fact that APS represent the core industry in those global cities indicates their leading function in the world economy. The status of the global cities in the global production system is further reflected by the APS multinational corporations, which are closely related to the theory of world cities proposed by Hall (1966) and Friedmann (1986).
In the study of world city networks, Taylor (2001) proposed an algorithm based on the interlocking world city network model (IWCNM), which provides a powerful tool to reveal the characteristics of world city networks quantitatively. In China, although the introduction to and interpretation of the theory of world cities emerged very early, empirical studies of APS networks have only been carried out in recent years. For example, the intercity network research carried out by Zhao et al. (2012), Tang et al. (2010), Tan et al. (2011), and Lu et al. (2012) has investigated producer services network in the typical city-regions in China such as the Yangtze River Delta (YRD), the Chengdu-Chongqing region, and the Pearl River Delta (PRD). Moreover, Taylor et al. (2013) and Derudder et al. (2013) have researched the connectivity of Chinese cities among world city networks. Nevertheless, most of the empirical studies above are based on the IWCNM, whereas investigations that employ the network model or its algorithm are relatively scarce.
Recently, the discussion and reflection on the IWCNM have become key theoretical issues; many scholars have questioned the IWCNM algorithm. For instance, Neal (2012) analyzed the use of the IWCNM algorithm to examine multi-location corporations and pointed out that it is actually a one-mode network derived via the transpose computing of a two-mode network with social networks. Liu et al. (2012; 2013) systematically compared existing algorithms related to city networks, while Hennemann (2013) explored geographical networks through visualization. Hennemann et al. (2014) further pointed out that the IWCNM algorithm overlooks the geographical characteristics of linkages between firms and proposed a substitute algorithm that takes account of geographical spaces and the hierarchy of firms.
In this paper, we aim to improve the alternative algorithm proposed by Hennemann et al. (2014) based on western studies of intercity advanced producer service networks. Following the presentation of the model’s assumptions and an empirical comparison, two typical urban-regions in China (YRD and PRD) are selected to explore and empirically research the algorithm for intercity APS networks. In this regard, we strive to extend the use of social network analysis in the research of city networks, which is the major innovation of our study.

2 Major algorithms of city networks

2.1 The IWCNM algorithm

The IWCNM, first proposed by Taylor in 2001, is a quantitative method that approximates intercity networks based on APS data. To understand network linkages, Taylor (2001) assumed that there are m producer services firms located in n cities. The service value of city a can be defined as the importance of the firm’s local office in one city within all its overall office networks. This can be expressed by Vaj, which represents the service value of firm j in city a. The n×m matrix consists of the service values of all the producer services firms in different cities. According to Neal (2012), Liu et al. (2012), and Hennemann et al. (2014), the compiled database of the producer services matrix is a two-mode network that comprises cities and firms. This database should be transposed into a one-mode network in order to project it as intercity relationships. Hence, the essentiality of the IWCNM algorithm is a transformation from a two-mode city-by-firm network matrix to a one-mode city-by-city network matrix. The fundamental transformation of service value matrix V can be expressed as follows:
where Vaj and Vbj are the service values of firm j in cities a and b, respectively, and Cab, j indicates the linkages between city a and b based on firm j. Then, the total connections in cities a and b can be expressed as follows:
For each city, it has (n-1) similar links at most. Furthermore, any city’s node degree Ca can be expressed as follows:
However, although the IWCNM algorithm introduces an effective way to convert a two-mode network into a one-mode network, it results in numerous invalid linkages. Specifically, because this conversion overlooks the spatial characteristics of cities and hierarchical nature of firms, it leads to inevitable information losses and flattens the nodality of city networks (Neal, 2012; Liu et al., 2012; Hennemann et al., 2013). Moreover, technically, the IWCNM algorithm does not sufficiently reflect the degrees of closeness, betweenness, in-degree, and out-degree nor other network statistical indices because of the limitations of the model’s assumptions, which lead to a technical deficiency when analyzing intercity APS networks.

2.2 Regional core city model (RCCM) algorithm

Based on the limitations of the IWCNM described above, Hennemann et al. (2014) proposed a new model algorithm characterized by hierarchical and geographic features in comparison with the IWCNM. Based on these characteristics, two modifications are mainly performed by the RCCM algorithm. First, firms’ worldwide hierarchical distribution information is incorporated into the calculation. By allowing for spatiality in the organization of APS firms’ office networks, and based on the APS firms’ distribution within the global office organization, a city with the maximum geographic service value is selected as the external linkage portal in each region. Moreover, the manufacturing services firms with lower geographic values connect to high-level cities through portal cities. This approach reflects the importance of geographical adjacency on network linkage and is closer to the network linkage of the producer services sector in real life. More importantly, this approach overcomes the flat city nodes produced by the IWCNM.
Second, a baseline model is established for the network linkage in order to preserve the basic parameter distribution properties of the network structure (e.g., degree distribution). For this purpose, the shuffling approach is applied to randomly shuffle the several iterative swapping steps necessary for node linkages (i.e., permutation or bootstrapping in the social network). After this random upper-level directed change, the linkage routes and directions among network nodes are retained for the intermediary calculation and analysis of nodes.
The basic process of the RCCM algorithm can be briefly described as follows: for any firm j, find its maximum service value in region k where the firm is registered by considering the following two cases. Firstly, if both the regional service values of firm j in cities a and b of the same region k are larger than 0, but not equal, then mark the intercity linkage of firm j’s network between a and b as 1, and 0 otherwise. Similarly, if cities a and b are from different regions, but each is the largest regional service value city in their own region, then the intercity linkage is marked as 1, and 0 otherwise. On this basis, we calculate the unidirectional Cab,jas follows:
This formula, which reflects the directional and multiple relations between cities, can be used to calculate the degrees (in-degree and out-degree) of every city in the network. In-degree can be understood as all the relations a branch in a certain city has with its headquarters, while out-degree indicates all the relations that the headquarters has with its branches. Furthermore, the vector feature of (Cab+Cba) can be used to represent all relation linkages between cities a and b. In other words, out-degree reflects the power of a city in which the firms’ headquarters is located, while in-degree reflects a city’s prestige and ability to attract investments (Alderson et al., 2004).

3 Major drawbacks and improvements for the RCCM algorithm

As described in section 2, it is often difficult to use the IWCNM algorithm to analyze network structures in depth because some key indices such as closeness degree and betweenness degree in social network analysis cannot be calculated by the IWCNM. Betweenness, initially introduced by Freeman (1979), has been used by Hennemann et al. (2014) to evaluate the importance of a city as a node in a network. Betweenness in city networks can be calculated by identifying the shortest paths between cities and then analyzing the number of times each city as a node is passed through when using these shortest paths. Hennemann et al. (2014), for example, adopted a stochastic network algorithm, which is an indirect measurement that only provides an approximate search calculation of these paths. Finally, the RCCM algorithm uses the path analysis of intercity connectivitity matrices that result from merged firms instead of calculating all the possible paths among individual firms. Hence, the formula is as follows:
The algorithm proposed above faces the authenticity problem of social network linkages. According to the detailed study of city linkages conducted by Rozenblat (2010), the hierarchical linkages among firms and cities have to be considered when estimating intercity networks since two firms located in the same place/city may have no definitely in a business relationship (a social network linkage). The process of network linkages between three firms (1, 2, and 3) and four cities (a, b, c, and d) is illustrated in Figure 1. Here, it is assumed that firm 1 is involved in city linkage a-b; firm 2 incity linkage b-c; and firm 3 in city linkages b-d and c-d. If we add up all the linkages generated by these three firms, a topological structure that consists of a triangle and an extra edge is formed.
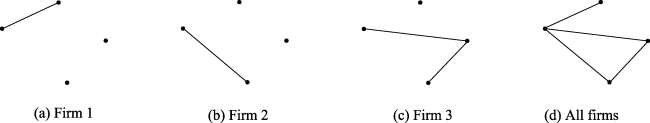
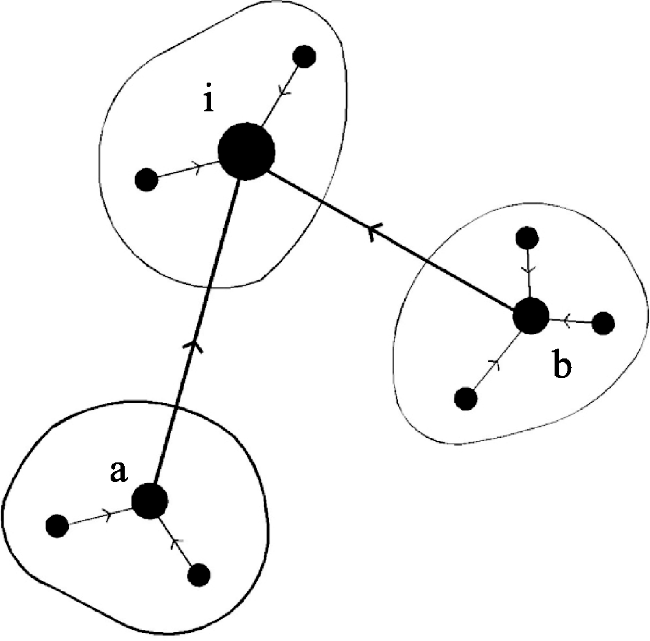
Figure 1 Overlaying process of firms’ networks in cities
In Figure 1, city b acts as the intermediate node of cities a and c as well as of cities a and d. While the network statistical indices (e.g., average path length, step length, and closeness, as proposed by Freeman (1979) are mathematically practical, this calculation confuses the linkages of firms 1, 2, and 3 in cities a, b, c, and d, which leads to the probability of false linkages. From the perspective of social networking, if there is no linkage between firms 1 and 2 or between firms 1 and 3, then city b cannot be regarded as an intermediate node between cities a and c or cities a and d (see the far right of the overlay graph). In fact, neither Neal (2012) nor Alderson et al. (2004) separates firm linkages from city linkages; therefore, the results of betweenness degree based on the merged firms are somewhat undermined by the same issue of false linkages.
To overcome the issue of false linkages, this study focuses on improving the calculation of betweenness. Following the linkage of each firm j, a calculation is separately conducted denoted by Gab,j(i), Gab,j, which means evaluating the betweenness of each firm in the city-firm two-mode networks and then averaging the betweenness of each firm in the whole network. Thus, the whole calculation process of single firm can effectively avoid the authenticity issue faced when calculating betweenness degree. The corresponding formula is as follows:
where Bi is the betweenness degree of city node i and Gab,j is the total number of possible shortest linkage paths between a and b in the network of firm j. Gab,j(i) represents the number of paths that pass through city i among all the shortest linkage paths between a and b in the network in which firm j is involved.
Similarly, we use the closeness degree that Freeman first proposed, which is defined as the inverse of the sum of all the shortest step lengths between node i and all other nodes. For a firm network, it can be denoted as
where Ci is the closeness degree of any city i and dai,j is the shortest step length between a and i within the network of firm j. The closeness formula reflects the influence of network nodes on information flows as well as the degree of convenience when one city linked to others in the city network. Additionally, the closeness of one node is defined as 0 when it has no link with other nodes in a firm network.

4 Empirical research

4.1 Data and research areas

The city network linkage is a crucial way to investigate the regional organization of cities. Given the feasibility of data processing, empirical cases refer to polycentric urban region network studies in Europe. Similarly, based on the producer services data on multinational corporations compiled by the GaWC, Hall and Pain (2006) adopted the interlocking model to measure spatial linkages and analyze the organizational process of APS networking in Europe’s megacity-regions.
Inspired by the past research of western scholars, two typical high-level development city-regions on the east coast of China, namely YRD and PRD, is selected as the study cases. In the YRD region, there are 16 prefecture-level cities: Shanghai, Nanjing, Zhenjiang, Suzhou, Nantong, Yangzhou, Changzhou, Wuxi, and Taizhou in Jiangsu Province and Hangzhou, Huzhou, Jiaxing, Ningbo, Shaoxing, Taizhou, and Zhoushan in Zhejiang Province. In the PRD region, there are nine cities, namely Guangzhou, Shenzhen, Foshan, Zhuhai, Dongguan, Jiangmen, Huizhou, Zhongshan, and Zhaoqing, all in Guangdong Province.
To collect data on producer services firms, we accessed the websites of APS firms that have branches in more than one city (data were collected in May, 2010 and checked in August, 2012) based on a related ranking of Chinese firms. In total, 290 firms were included in our sample (48 banks, 38 insurance companies, 30 law firms, 33 accounting firms, 31 consulting and architectural design firms, 25 advertising agencies, and 85 securities companies). All firms were assigned to one of the following six quantitative levels (from 0 to 5) based on the reference APS values provided by the GaWC. When a firm is assigned 0, it means no office or a branch in that city, 5 refers to a city in which the headquarters is located, and 2 refers to a standard office or branch. Moreover, 1 and 3 refer to an office that is one grade below and above the standard level, respectively, while 4 refers to a city in which the regional headquarters is located. Of the 290 producer services firms, 189 have branches in at least two cities. Hence, 25 cities and 189 producer services firms are available; eventually, we take 189×25 among the matrices as the database for the present research.

4.2 Analysis

4.2.1 The spatial distribution of intercity network connections
Given its authority in the analysis of producer services networks, we use the IWCNM algorithm to calculate the intercity network connectivities between these 25 cities (Figure 2). Further, we focus on the network characteristics of the top 10 cities ranked by node degree (Table 1). We find that the IWCNM algorithm provides a symmetrical matrix, with the linkages of Shanghai-Guangzhou and Shanghai-Shenzhen being more than 1,000, much higher than Shanghai-Hangzhou (677) and Shanghai-Nanjing (576), even though Hangzhou and Nanjing are the two other provincial capital cities in the YRD. Moreover, the results of the IWCNM algorithm show significant spatial connections between non-core cities in different regions, which ignores hierarchical features and thus could result in anomalies. For instance, Zhoushan in Zhejiang Province is the weakest city in the economy among all YRD and PRD cities. Yet, it has obvious intercity network linkages between Jiangsu and even some cities in Guangdong, which even exceed those cities in its own province.
Then, we use the RCCM algorithm to analyze the intercity connectivities in the YRD and PRD (Table 2) and derive an asymmetrical table, which is fundamentally different from that provided by the IWCNM. The linkage assumption of the RCCM algorithm states that a subordinate firm must report to a higher one. First, we see that the top five intercity linkages in order are Shanghai→Hangzhou (25), Shanghai→Guangzhou (23), Shanghai→Shenzhen (23), Shenzhen→Shanghai (22), and Shanghai→Nanjing (20), indicating that Shanghai, Shenzhen, Nanjing, Guangzhou, and Hangzhou dominate regional producer services networks in the YRD and PRD.
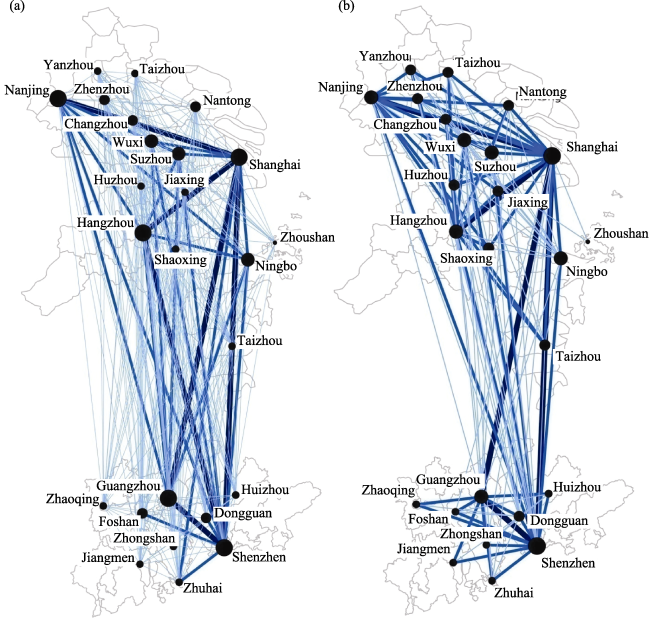
Figure 2 APS networks for the YRD and PRD based on the IWCNM (a) and RCCM (b)
Table 1 Network matrix based on the IWCNM
Shanghai Nanjing Suzhou Wuxi Hangzhou Ningbo Guangzhou Shenzhen Dongguan Foshan
Shanghai 576 374 222 677 336 1153 1046 161 165
Nanjing 576 264 180 416 225 387 505 125 138
Suzhou 374 264 123 243 163 266 305 94 77
Wuxi 222 180 123 163 132 177 207 97 90
Hangzhou 677 416 243 163 260 482 563 133 134
Ningbo 336 225 163 132 260 255 277 115 119
Guangzhou 1153 387 266 177 482 255 720 168 159
Shenzhen 1046 505 305 207 563 277 720 186 178
Dongguan 161 125 94 97 133 115 168 186 101
Foshan 165 138 77 90 134 119 159 178 101
Table 2 Network matrix based on the RCCM
Shanghai Nanjing Suzhou Wuxi Hangzhou Ningbo Guang-
zhou
Shen-
zhen
Dong-
guan
Foshan
Shanghai 4 1 3 2 1 6 22 1 0
Nanjing 20 1 2 1 0 2 14 1 0
Suzhou 19 8 2 3 3 0 7 0 0
Wuxi 16 10 5 9 6 3 11 1 0
Hangzhou 25 3 1 2 1 3 14 1 0
Ningbo 14 3 1 0 3 2 8 0 0
Guangzhou 23 3 0 2 1 0 17 0 0
Shenzhen 23 4 1 2 2 0 6 1 0
Dongguan 5 0 1 0 0 0 12 15 0
Foshan 5 0 0 0 0 0 13 17 2
Second, the asymmetry of the RCCM table reflects the disequilibrium distribution of producer services. By observing each row in the table, we can see that the number of headquarters or regional headquarters of producer services firms in Shanghai and Shenzhen is larger than 0, whereas the number of headquarters in Foshan is 0. This finding displays the characteristic of headquarters aggregation espoused in the world city hypothesis by Hall (1966) and Friedmann (1986) and confirms Sassen’s (2001) global city theory that the aggregation of management and control functions strengthens even though production activities dispersed regionally.
Third, the method of Taylor’s (2001) ignored the geographical restrictions branch business, while the RCCM emphasized the importance of the regional headquarters of producer services. The difference that confirmed in the last two rows, which indicates that cities such as Dongguan and Foshan, which rely on their manufacturing industries, have weaker control of their export-oriented producer services.
Figure 2 shows that the results of the RCCM algorithm somewhat “erased” the connections between some cities established by the IWCNM, clarifying the spatial pattern of intercity connections and mitigating the shortcoming that resulted from its calculation process (i.e., that it ignored geographical characteristics). In terms of the linking process within a firm’s internal network, a lower-level office will usually communicate with a local higher-level administrative office before contacting an office located outside the region. This process is dictated by the fact that the local higher-level office often has access to more company information and can guide the lower-level office towards which target local office(s) to contact, making it easier for the lower-level office to operate. In this way, the higher-level offices of a firm are more likely to act as network bridging nodes for the interregional connections between their lower-level offices.
Taylor et al. (2010) proposed two terms to explain the internal and external relationships of city connections: “town-ness” and “city-ness.” The former is characterized by connections to the hinterland and is closely related to traditional central place theory, whereas the latter focuses on intercity connections. Economic globalization is an example of such interregional and external connections. Taylor also quoted Jacobs’ (1969) viewpoint to illustrate the importance of the external connections of cities and regional hinterlands. A city cannot support the economic development of other regions if it relies solely on its connections within regional hinterlands. Since the RCCM begins by dividing regions, a city’s connectivities to other cities within and outside the region need to be investigated. The node sets within each region were therefore divided according to a geographical scale. The average linkage level ksi was then used to measure the links between node i and the other city nodes within the region, while kti was also used to express the average linkage level of node i in the whole network. Thus, the ratio of the regional connection of node i to the regional connections of all networks can be calculated as follows:
In equation (8), nsi and nti refer to the number of node i within the region and the whole network, respectively. If ri is larger than 1, the connections of node i are considered to be intra-regional. If ri is smaller than 1, this indicates that the external connections run outside the region.
By applying equation (8), we can thus calculate the intercity regional connectitives in the YRD and PRD for the two network model algorithms (Table 3). It can be seen that Shanghai, Nanjing, Hangzhou, and Ningbo have lower internal connection ratios based on the IWCNM in the YRD, which demonstrates the trend towards the delocalization of the functional connections between the four cities in these two city-regions. However, the internal connection ratios between all cities, based on the RCCM, are larger than 1. The internal connections of Nanjing are lower than Hangzhou, implying that the external connections of the former are more significant compared with the latter. In general, the contrasting results of these two algorithms are the natural outcomes of the RCCM emphasizing the regional headquarters of producer services firms.
Table 3 Ratios of intra-regional links based on the IWCNM and RCCM
YRD PRD
City IWCNM RCCM City IWCNM RCCM
Shanghai 0.812 1.214 Guangzhou 0.793 1.988
Nanjing 0.988 1.475 Shenzhen 0.797 1.559
Zhenjiang 1.086 1.562 Dongguan 1.004 2.311
Suzhou 1.032 1.559 Zhuhai 1.068 2.240
Nantong 1.086 1.562 Foshan 0.995 2.453
Yangzhou 1.066 1.562 Zhaoqing 1.006 2.667
Changzhou 1.092 1.563 Shan 0.964 2.533
Wuxi 1.038 1.502 Jiangmen 1.006 2.667
Taizhou (Jiangsu) 1.071 1.562 Huizhou 1.035 2.667
Hangzhou 0.956 1.485
Huzhou 1.031 1.560
Jiangxing 1.071 1.562
Ningbo 0.998 1.514
Shaoxing 1.071 1.561
Taizhou (Zhejiang) 1.055 1.562
Average 1.030 0.963 Average 1.520 2.343
Similarly, based on the IWCNM, Guangzhou, Shenzhen, Foshan, and Zhongshan of the PRD have internal connection ratios that are smaller than1. However, Shenzhen’s external connections are more apparent than Guangzhou when the RCCM is used. This finding demonstrates the regional focus of this algorithm: the function of Guangzhou is closer to that of a provincial capital city; hence, its internal connections ratio under the RCCM is larger than that of Shenzhen. This result also reflects Shenzhen’s stronger external linkages within the intercity producer service network.
Another noteworthy finding is that cities in the YRD have lower internal connection ratios, which is not as obvious under the IWCNM algorithm. We thus analyzed the t-test results of the independent samples (Table 4), with the significance level of the two-tailed test based on the Levene test value. The test showed that the significance level under the RCCM reaches p<0.01, whereas that under the IWCNM does not pass the t-test. This result means that intercity producer services connections have more prominent interregional link characteristics in the YRD under the RCCM algorithm. Hence, the level of external connections is higher in comparison with the cities in the PRD.
Table 4 Independent sample test of the ratio of the intra-regional links for the YRD and PRD
Calculation model Variance Levene test for equality t-test for equality
F Sig. t df Sig. (2-tailed)
IWCNM Homogeneity 13.856 0.001 -8.25 22 0.000
Heterogeneity -6.494 8.567 0.000
RCCM Homogeneity 1.251 0.275 1.914 22 0.069
Heterogeneity 1.765 13.111 0.101
4.2.2 Node degree
Although node degree is an important issue in network research, there is no consensus on its numerical processing. A standardized method was thus adopted in our study, in which the maximum value of each type was set as 1, followed by the ratio conversion of the array distribution from 0 to 1. Next, we compared the degree distribution under the two algorithms. For both algorithms, Shanghai’s degree was the leading one, which was set as 1.
Figure 3 shows that node degree under the IWCNM is decreasing gradually. Only Zhaoqing and Jiangmen in the PRD and Zhoushan in the YRD have a degree lower than 0.2. However, according to the RCCM’s calculation results, a node degree below 0.2 is found for Yangzhou, Taizhou (Jiangsu), Changzhou, Nantong, Huzhou, and Jiaxing in the YRD as well as for Zhongshan, Zhaoqing, Jiangmen, Zhuhai, Dongguan, Huizhou, and Foshan in the PRD.
We further adapt the degree in both algorithms to P in order to analyze the rank-size distribution. According to Newman (2003), Clauset et al. (2008), and Boccaletti et al. (2006), the degree distribution curve of the observable nodes in the geospatial network matches the scale-free characteristics, thereby presenting a power law distribution. The power law distribution of the nodes in the network can therefore be expressed as follows:
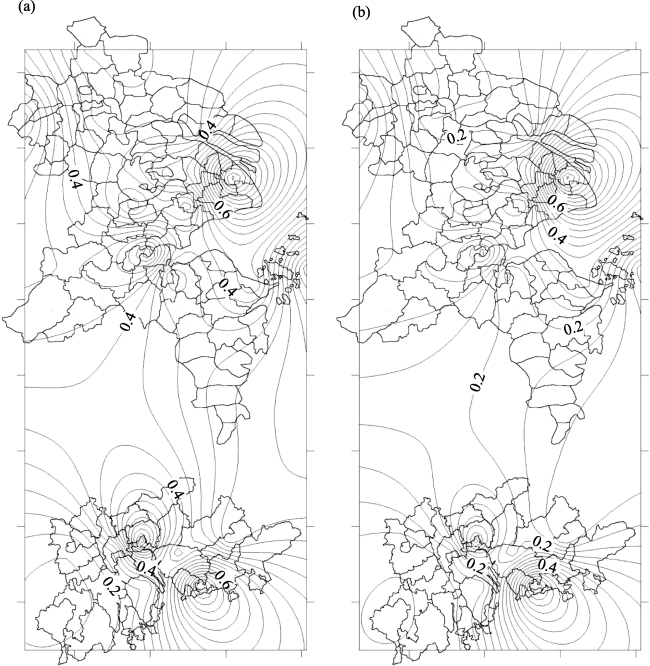
Figure 3 APS degree of the YRD and PRD based on the IWCNM (a) and RCCM (b)
The rank-size distribution curve of node degree is shown in Figure 4 (Zhoushan is excluded because of its low degree). For both the RCCM and the IWCNM, the distribution degree shows a clear power law distribution, with the coefficients of determination of the regression equations being greater than 0.9 (Table 5). The RCCM calculation displays a steeper slope for the distribution curve of the regression equation than the IWCNM (Figure 4). The α value in the rank-size regression equation is 0.859, which is higher than that under the IWCNM algorithm (0.609). The prominent hierarchical characteristic of the RCCM can also be observed in Figure 4. Hence, given the geospatial polarization of world cities, we can conclude that the RCCM shows the dominance and controlling position of several cities in the YRD and PRD.
Based on the polycentric measurement of megacity-regions proposed by Hall et al. (2006) and Meijers and Burger et al. (2010), we can adopt the degree rank-size equation in order to measure the spatial organization in the YRD and PRD. Both the degrees calculated by these two algorithms present a better fitting scale-free distribution and show clear differences in the spatial aggregation of producer services in the YRD and PRD. Specifically, the intercity network in the YRD shows a flatter organizational characteristic, while spatial polarization still exists in the PRD to some extent. This difference is confirmed by the fitting degree of the RCCM algorithm, where the corresponding coefficient reaches 1.176 and weakly conforms to the typical primate city distribution.
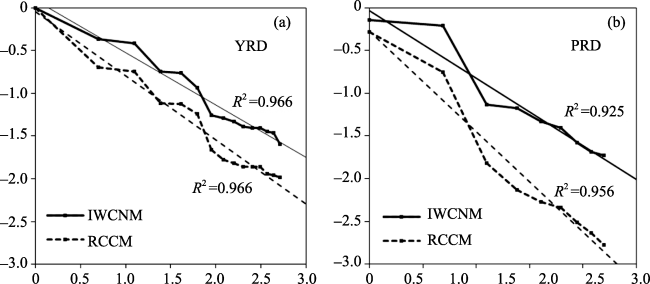
Figure 4 Distribution degree of the YRD (a) and PRD (b) based on the IWCNM and RCCM
Table 5 Regression equations of rank-size degree
Algorithm Regression equation Coefficient of determination ()
YRD IWCNM Ln(Pk) = -0.613ln(k)+0.088 0.966
RCCM Ln(Pk) = -0.751ln(k)+0.043 0.966
PRD IWCNM Ln(Pk) = -0.792ln(k)+0.026 0.925
RCCM Ln(Pk) = -1.176ln(k)+0.271 0.956
Further, we investigated the correlation of in-degree, out-degree, closeness, and betweenness in two algorithms respectively (Figure 5). We found the correlation coefficients between the node degree of IWCNM and out-degree/closeness/betweenness of RCCM are above 0.7, with a significant correlation of determination (R2) of 0.881, 0.870, and 0.752,respectively, while there is poorer correlation between node degree of IWCNM and in-degree of RCCM (R2=0.097). This result suggests that although the RCCM fits the IWCNM well, the out-degree of the RCCM better reflects the actual hierarchical characteristics (Table 4). Since the headquarters and other high-level offices of producer services firms are centralized in a few core cities (i.e., the out-degree of one city), an asymmetrical functional relation between cities is shown when using the RCCM. This relation is practically inevitable given the unequal regional distribution of headquarters and branches and it results in the spatial aggregation of the control functions of world and global cities, as proposed by Friedman (1986) and Sassen (2001). Similarly, after studying the inequality of the production networks of multinational corporations, Dicken (2006) also found a difference between the definition of control and being controlled among the various sections of different companies’ production systems. Moreover, Massey (1995) proposed that social relations are determined by ownership relations, namely the relation of spatial ownership portrayed as a geography of power relations—that of control versus being controlled and influence versus being influenced. Hence, the in-degree and out-degree of the RCCM show the asymmetry of the economic connections in the YRD and PRD and provide a geographical projection of the value chains in megacity-regions.
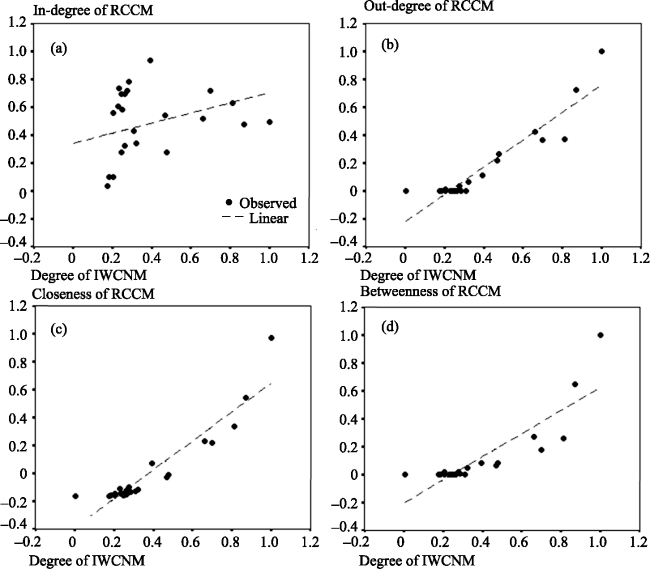
Figure 5 Comparison of APS city networks based on the IWCNM and RCCM
Table 6 shows the absolute dominance of Shanghai and Shenzhen in closeness and betweenness. However, Nanjing ranks third instead of Guangzhou for betweenness, which indicates the former plays the broker role more effectively, whereas the latter may better connect the closeness of the other cities. Lastly, 13 cities have a score of 0 for betweenness, reflecting the hierarchical phenomenon of the urban network linkages in the two metropolitan regions examined in this study.
We further classify the sampled cities into five types based on node degree, betweenness, and closeness and under the criterion of a standard deviation equal to 0.5. Type A cities are Shanghai, Shenzhen, Guangzhou, Nanjing, and Hangzhou, which have outstanding results for all three indices, that is good nodality, high connectivity, and key positions compared with the other nodes. Shanghai is the leading Type A city. Type B cities are Suzhou, Nantong, Wuxi, Changzhou, Ningbo, Shaoxing, and Dongguan, which have moderate nodality performance in producer services networks. Type C includes Zhuhai and Foshan, which have lower nodality degree and moderate values for the other indices. Zhenjiang, Yangzhou, Huzhou, Jiaxing, and Taizhou in Jiangsu and Taizhou in Zhejiang that have low closeness are classified in Type D. Lastly, Type E cities are Zhaoqing, Zhongshan, Jiangmen, Huizhou, and Zhoushan, which have lower-than-average nodality and closeness (Table 7).
Table 6 Comparison of the central degree nodality of the IWCNM and RCCM
City Nodality In-degree Out-degree Closeness Betweenness
IWCNM RCCM
Shanghai 1.000 1.000 0.672 1.000 1.000 1.000
Nanjing 0.659 0.500 0.689 0.423 0.349 0.270
Zhenjiang 0.265 0.156 0.820 0.000 0.017 0.000
Suzhou 0.467 0.325 0.705 0.219 0.122 0.068
Nantong 0.284 0.169 0.885 0.000 0.032 0.005
Yangzhou 0.236 0.163 0.852 0.000 0.023 0.000
Changzhou 0.276 0.191 0.836 0.036 0.061 0.016
Wuxi 0.392 0.291 1.000 0.115 0.213 0.080
Taizhou (Jiangsu) 0.246 0.156 0.820 0.000 0.012 0.000
Hangzhou 0.697 0.475 0.836 0.362 0.340 0.176
Huzhou 0.203 0.138 0.721 0.000 0.012 0.000
Jiangxing 0.246 0.156 0.820 0.000 0.019 0.000
Ningbo 0.476 0.328 0.508 0.265 0.140 0.080
Shaoxing 0.231 0.144 0.754 0.000 0.051 0.000
Taizhou (Zhejiang) 0.250 0.141 0.738 0.000 0.011 0.000
Zhoushan 0.005 0.006 0.033 0.000 0.005 0.000
Guangzhou 0.813 0.472 0.770 0.373 0.443 0.257
Shenzhen 0.868 0.756 0.656 0.724 0.624 0.644
Dongguan 0.323 0.163 0.557 0.065 0.047 0.048
Zhuhai 0.264 0.103 0.541 0.000 0.042 0.000
Foshan 0.309 0.119 0.623 0.000 0.036 0.000
Zhaoqing 0.178 0.063 0.328 0.000 0.004 0.000
Zhongshan 0.245 0.097 0.508 0.000 0.021 0.000
Jiangmen 0.185 0.072 0.377 0.000 0.010 0.000
Huizhou 0.207 0.081 0.377 0.011 0.020 0.019
Table 7 Classification of the cities based on the RCCM
Characteristics City
A Significantly high nodality, closeness, and betweenness Shanghai, Shenzhen, Guangzhou, Nanjing, and Hangzhou
B Significantly high nodality and closeness Suzhou, Nantong, Changzhou, Wuxi, Ningbo, Shaoxing, and Dongguan
C Significantly low nodality Zhuhai and Foshan
D Significantly low closeness Zhenjiang, Yangzhou, Huzhou, Jiangxing, Taizhou (Jiangsu), and Taizhou (Zhejiang)
E Significantly low nodality and closeness Zhaoqing, Zhongshan, Jiangmen, Huizhou, and Zhoushan
In general, we conclude that the RCCM algorithm effectively improved the social network analysis results, showing that it more comprehensively characterizes the intercity APS networks than the IWCNM. Moreover, since the IWCNM algorithm assumes that all non-local branches are connected (i.e., an orthogonal network without the weights), it is inadequate for social network analysis, explaining why western researchers of world city networks rarely perform this analysis based on such an algorithm.

5 Discussion and conclusion

Understanding intercity network connectivity based on producer services firms is an important way to investigate the spatial organization of city-regions. However, although it is an important methodology for measuring city linkages or connectivities, this study propose a new method for approximating urban networks by using the locational strategies of producer services firms. Specifically, we perform the traverse computation of individual firms throughout the entire process and apply a combination of geographical space and the firms’ hierarchy. Only in this way can we avoid the information loss associated with the projection from a two-mode firm-city database to a one-mode city-city one and thereby understand the actual social network linkage process.
In the presented empirical interpretation of two large metropolitan areas in China (i.e., YRD and PRD), the improved RCCM algorithm shows clear hierarchical and geographical characteristics and better describes the spatial structure of intercity producer servicing networks. More importantly, we are able to use the network analysis indicators (node degree, closeness, betweenness, in-degree, and out-degree) to broaden the research perspective of intercity APS networks.
While the empirical analysis in this paper only based on two city-regions, theoretically a minimum of three city-regions are needed to ensure that the algorithm can calculate intercity APS networks adequately. Further, because we assume that the only interregional linkage in a city network is through the primate city of each region to all the core cities, which have the highest service values in the network, the shortest path between any two cities can occur in at most three regions. To illustrate this point, for any network of firm j, if no linkages between core cities a and b in these two regions exist, and they therefore have to be linked through a third-party city i with the highest service value, the maximum number of path steps is four, which includes the five cities as nodes (Figure 6).
Figure 6 Model map based on the RCCM for three regions
For example, let us take the three large city-regions of YRD, PRD, and Beijing-Tianjin-Hebei. When calculated using the RCCM, Shanghai has a higher total node degree (615) than Beijing (480). However, Beijing has a higher out-degree (486) than Shanghai (480), which reflects the power of control by APS headquarters. During the actual calculations, the practical use of the betweenness measure is limited by the amount of big data, while advanced calculation tools and software systems are also necessary. Therefore, given the limitation imposed by the length of this paper, we only focus on the factors that need consideration, without going into the detailed computations.
Moreover, the RCCM algorithm is not perfect owing to the limitations of its assumptions, such as the issue of spatial scaling and firms’ hierarchy. Further, the algorithm takes account of the “region” in the model, which means that the choice of geographical units greatly influences the model results. Additionally, although some general network indices such as closeness and betweenness can be calculated through the RCCM in the paths length analysis, the algorithm cannot calculate clustering coefficients, indicating that although it better reflects regional spaces and hierarchy, its specific method of analysis still requires improvements.
Undoubtedly, deductive analyses carried out by using any theoretical model rest on the assumption(s) of the models’ respective hypotheses. Therefore, the structure of city networks is also constrained by the calibration model of the basic data. In this regard, our study has revealed only the tip of the iceberg. The empirical studies of the Randstad region carried out by Burger et al. (2010, 2013) showed that the functional connections of megacity- regions have diversified patterns. Indeed, the external spatial characteristics of a city network depend on the actual sample type, which is indicative of a complicated macro-level system. Therefore, the internal and external spatial relations of urban regions cannot simply be determined by using one or two theoretical models.
Finally, although the algorithm of intercity APS networks continues to be debated among urban scholars, it is crucial that academic research continues to find deficiencies and make improvements to existing theories. Innovations of the continuing research into producer services networks might include field investigations into producer services firms, while future studies should aim to clarify the mechanics of city connections as well as make conclusive improvements to the various algorithms based on those findings.

The authors have declared that no competing interests exist.

1
Alderson S, Beckfield J, 2004. Power and position in the world city system.American Journal of Sociology, 109(4): 811-851.

2
Boccaletti S, Latora V, Moreno Yet al., 2006. Complex networks: Structure and dynamics.Physics reports, 424: 175-308.

3
Burger M J, van der Knaap B, Wall R S, 2013. Polycentricity and the multiplexity of urban networks.European Planning Studies, doi: 10.1080/09654313.2013.771619.

4
Camagni R, Capello R, 2004. The City Network Paradigm: Theory and Empirical Evidence. Netherlands: Elsevier BV.

5
Castells M, 1996. The Rise of Network Society. Oxford: Blackwell.

6
Choi J H, Barnett G A, Chon B-S, 2006. Comparing world city networks: A network analysis of Internet backbone and air transport intercity linkage.Global Networks, 6(1): 81-89.

7
Clauset A, Moore C, Newman M, 2008. Hierarchical structure and the prediction of missing links in networks.Nature, 2008, 453: 98-101.

8
Derudder B, Taylor P, Hoyler Met al., 2013. Measurement and interpretation of the connectivity of Chinese cities in the world city network, 2010.Chinese Geographical Science, 23(3): 261-273.

9
Derudder B, Witlox F, 2005. An appraisal of the use of airline data in assessing the world city network: A research note on data.Urban Studies, 42(13): 2371-2388.

10
Dicken P, 2006. Global Shift: Mapping the Changing Contours of the World Economy. New York: Sage Publications.

11
Dicken P, Kelly P, Olds K, Yeung H, 2001.Chains and networks, territories and scales: Towards a relational framework for analyzing the global economy.Global Networks, 1(2): 89-112.

12
Florida R, 2005. Cities and the Creative Class. New York: Routledge.

13
Freeman L, 1979. Centrality in social networks: Conceptual clarification.Social Networks, 1(1): 215-239.

14
Friedmann J, 1986. The world city hypothesis.Development and Change, 171: 69-83.

15
Gregory Det al., 2009. The Dictionary of Human Geography. 5th ed. Oxford: Wiley-Blackwell.

16
Hall P G, Pain K, 2006. The Polycentric Metropolis: Learning from Mega-City Regions in Europe. London: Earthscan.

17
Hall P, 1966. The World Cities. London: Heinemann.

18
Henderson J, Dicken P, Martin Het al., 2002.Global production networks and the analysis of economic development.Review of International Political Economy, 9(3): 436-464.

19
Hennemann S, 2013. Information-rich visualization of dense geographical networks.Journal of Maps, 9(1): 68-75.

20
Hennemann S, Derudder B, 2014. An alternative approach to the calculation and analysis of connectivity in the world city network. Environment and Planning B, forthcoming.

21
Jacobs J, 1969. The Economy of Cities. New York: Vintage.

22
Liu X J, Derudder B, 2012. Two-mode networks and the interlocking world city network model: A reply to Neal.Geographical Analysis, 44(2): 171-173.

23
Liu X J, Derudder B, 2013. Analyzing urban networks through the lens of corporate networks: A critical review.Cities, 31: 430-437.

24
Lu X, Ma X, Li G, 2012. Spatial pattern of regional city network based on international advanced producer services’ layout in Pearl River Delta.Economic Geography, 32(4): 50-54. (in Chinese)

25
Massey D B, 1995. Spatial Divisions of Labor: Social Structures and the Geography of Production. New York: Routledge.

26
Meijers E, Burger M, 2010. Spatial structure and productivity in U.S. metropolitan areas.Environment and Planning A, 42(6): 1383-1402.

27
Neal Z, 2012. Structural determinism in the interlocking world city network.Geographical Analysis, 44(2): 162-170.

28
Newman M, 2003. The structure and function of complex networks.SIAM Rev., 45: 167-256.

29
Rozenblat C, 2010. Opening the black box of agglomeration economies for measuring cities’ competitiveness through international firms networks.Urban Studies, 47(13): 2841-2865.

30
Sassen S, 2001. Global City: New York, London, Tokyo. New Jersey: Princeton University Press.

31
Sheppard E, 2002. The spaces and times of globalization: Place, scale, networks, and positionality.Economic Geography, 78(3): 307-330.

32
Tan Y, Yang Y, Leng Bet al., 2011. Urban network system in the Chengdu-Chongqing region in the perspective of advanced producer services.Progress in Geography, 30(6): 724-732. (in Chinese)

33
Tang Z, Zhao M, 2010. Economic globalization and transformation of urban system in the Yangtze River Delta Region: Interlocking network and value-added hierarchy.Urban Planning Forum, 187(1): 29-34. (in Chinese)

34
Taylor P, 2001. Specification of the world city network.Geographical Analysis, 33: 181-194.

35
Taylor P, 2007. Cities within spaces of flows: Theses for a materialist understanding of the external relations of cities. In: Taylor P, Derudder B, Saey P et al. Cities in Globalization: Practices, Policies and Theories. London: Routledge, 287-297.

36
Taylor P, Derudder B, Hoyler Met al., 2013. City-dyad analyses of China’s integration into the world city network.Urban Studies, 50(7): 1-15.

37
Taylor P, Hoyler M, Verbruggen R, 2010. External urban relational process: Introducing central flow theory to complement central place theory.Urban Studies, 47(13): 2803-2818.

38
Taylor P J, 2002. Measurement of the world city network.Urban Studies, 39(13): 2367-2376.

39
Taylor P J, 2004. World City Network: A Global Urban Analysis. London and New York: Routledge.

40
Taylor P J, 2005. New political geographies: Global civil society and global governance through world city networks.Political Geography, 24(6): 703-730.

41
Taylor P J, Evans D M, Pain K, 2009. The UK space economy as practiced by advanced producer service firms: Identifying two distinctive polycentric city-regional processes in contemporary Britain.International Journal of Urban and Regional Research, 33(3): 700-718.

42
Wall R S, Knaap G A, 2011. Sectoral differentiation and network structure within contemporary worldwide corporate networks.Economic Geography, 87(3): 267-308.

43
Wu K, Fang C, Zhao Met al., 2013. The intercity space of flow influenced by high-speed rail: A case study for the rail transit passenger behavior between Beijing and Tianjin.Acta Geographica Sinica, 68(2): 159-174. (in Chinese)

44
Zhao M, Liu Z, 2012. Research on China’s city network based on production service industry. City Planning Review,(9): 23-28, 38. (in Chinese)

Outlines

/