Orginal Article

A preliminary quantitative reconstruction of precipitation in southern Mu Us sandy land at margin of Asian monsoon-dominated region during late Quaternary

  • CHEN Yingyong , 1 ,
  • LU Huayu , 1, * ,
  • YI Shuangwen 1 ,
  • ZHANG Enlou 2 ,
  • XU Zhiwei 1 ,
  • YU Kaifeng 1 ,
  • Joseph A. MASON 3
Expand
  • 1. School of Geographic and Oceanographic Sciences, Nanjing University; Jiangsu Collaborative Innovation Center for Climate Change, Nanjing 210023, China
  • 2. State Key Laboratory of Lake Science and Environment, Nanjing Institute of Geography and Limnology, CAS, Nanjing 210008, China
  • 3. Department of Geography, University of Wisconsin Madison, WI 53706, USA

*Corresponding author: Lu Huayu, Professor, E-mail:

Author: Chen Yingyong, PhD, specialized in land surface process and environment change. E-mail:

Received date: 2013-12-12

  Accepted date: 2014-06-17

  Online published: 2015-03-15

Supported by

National Natural Science Foundation of China, No.41321062;No.41371203

The Global Changes Program of China, 2010CB950203

The Priority Academic Program Development of Jiangsu Higher Education Institutions, The Fundamental Research Funds for the Central Universities, No.1082020904

Copyright

Journal of Geographical Sciences, All Rights Reserved

Abstract

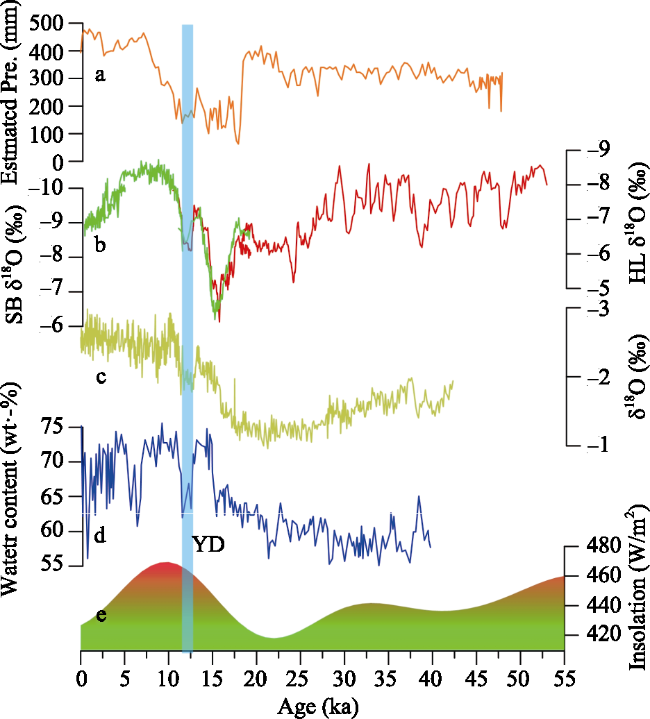
We present the first quantitative estimation of monsoon precipitation during the late glacial-Holocene in the sandy land of northern China, based on organic carbon isotopic composition data from a loess-sand sequence at margin of the Mu Us sandy land. We use the relationship between monsoon precipitation and the carbon isotopic composition of modern soils as an analogue, with a minor modification, to reconstruct precipitation back to c. 47 ka ago. The preliminary results indicate that annual monsoon precipitation was high after 8 ka, with an average of 435 mm; and it decreased during 18 and 8 ka with a mean value of 194 mm. The precipitation value of 47-18 ka varied between the two. We compare the reconstructed precipitation with other records and paleoclimatic modeling results, showing that our record agrees with reconstructions of the monsoon precipitation from other sources, even capturing short climatic events such as the Younger Dryas. We suggest that solar irradiance, high-latitude temperature/ice volume and local evaporation have together modified moistures in the sandy land.

Cite this article

CHEN Yingyong , LU Huayu , YI Shuangwen , ZHANG Enlou , XU Zhiwei , YU Kaifeng , Joseph A. MASON . A preliminary quantitative reconstruction of precipitation in southern Mu Us sandy land at margin of Asian monsoon-dominated region during late Quaternary[J]. Journal of Geographical Sciences, 2015 , 25(3) : 301 -310 . DOI: 10.1007/s11442-015-1169-8

1 Introduction

To obtain quantitative estimates of past climatic change is an important goal of the paleoclimatic research, essential for testing paleoclimatic modeling output, understanding forcing mechanisms of climate change, and predicting future climates. Various quantitative methods have been developed for depositional records, the most widely used approach being transfer functions based on data collected from terrestrial deposits (pollen, diatoms, insects, mollusks, etc.) or marine sediments (foraminifera, diatoms, dinoflagelates, etc.) (Guiot et al., 2000). In a sense, it is much more difficult to obtain quantitative paleoclimate reconstructions from terrestrial sediments because the relationship between proxy indicators and climate parameters varies from region to region (Mosbrugger and Utescher, 1997).
In recent years, several methods have been applied toward the quantitative reconstruction of paleoprecipitation in Chinese Loess Plateau, including magnetic susceptibility (Heller et al., 1993; Maher et al., 1994; Liu et al., 1995; Xia et al., 2012), geochemical transfer function (Sun et al., 1999), organic carbon isotopes (Ning et al., 2008), and opal phytoliths (Wu et al., 1994; Lu et al., 1996). However, the results have not been consistent between methods (Bloemendal and Liu, 2005). It is widely accepted that plant assemblages provide one of the best paleoclimate proxies in the terrestrial environment. Soil organic matter is derived from plants, and the plant δ13C is clearly linked to precipitation (Stewart et al., 1995; Schulze et al., 1996; Wang et al., 2003; Liu et al., 2005a), therefore, the δ13C of organic matter may be among the most powerful proxies for reconstructing past vegetation and climate (Cerling et al., 1989; Quade et al., 1989). There is a long history of applying organic carbon isotopic composition of the loess to reconstruct the past environment changes (Lin et al., 1991; Hatté et al., 1998; Gu et al., 2003; Liu et al., 2005c; Rao et al., 2006). Recently, the organic carbon isotopic composition was also studied in dune fields of northern China (Lu et al., 2012), however, a quantitative estimation of monsoon precipitation based on organic carbon isotopic composition in these sandy land areas has not been undertaken.
A relationship between δ13C of organic carbon in loess and precipitation was developed to quantitatively reconstruct paleoprecipitation of the last glaciation at the Nussloch region in Europe (Hatté et al., 1998, 2001). The relationship between the organic carbon isotopes (δ13CTOC) in soil and mean annual precipitation (MAP) in the East Asian monsoon area has also been investigated, and a preliminary transfer function has been developed (Ning et al., 2008). This research provides a basic tool for using the organic carbon isotopic composition to reconstruct the past climate changes.
The Mu Us sandy land is located to the north of the Chinese Loess Plateau, where the climate is controlled essentially by the Asian monsoon circulation, but with large wet and dry variations, which resulted in past changes in dune activity and vegetation type. A quantitative estimation of late Quaternary precipitation in this region has not been reported. In this study, we aim to quantitatively reconstruct the paleoprecipitation in this region, based on the analysis of organic carbon isotopic composition. This is the first test of the use of carbon isotopes to quantitatively reconstruct the monsoon precipitation during the late Quaternary in drylands at the monsoon region margin.

2 Sampling and methods

2.1 Sampling and analysis

A loess-sand section at Zhenbeitai (ZBT) (38°20′22″N, 109°44′12″E) in the transitional zone between the Chinese Loess Plateau and the Mu Us dune field was sampled (Figure 1). Mean annual precipitation (MAP) at the study site is 401 mm, most of which (c. 87%) falls during the growing season (April-September), the annual precipitation variability and monthly precipitation variability of the past 60 years is about 20.63% and 80.12%, respectively. The mean annual temperature (MAT) is 8.4°C.
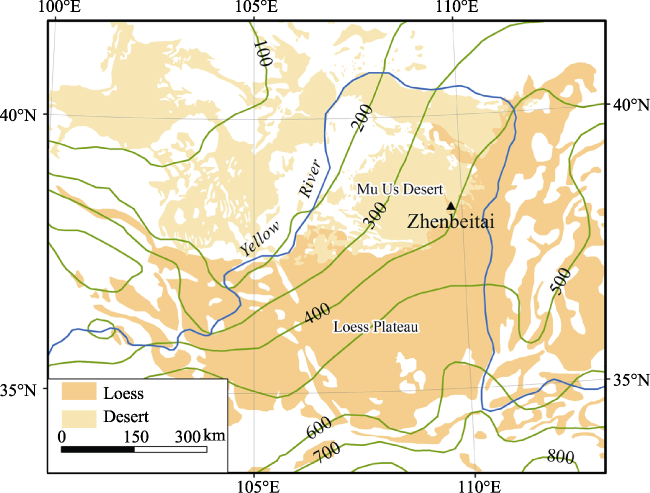
Figure 1 Location of the study site at Zhenbeitai. The yellow shaded area indicates loess cover, while deserts are indicated by light yellow shade. Present mean annual precipitation is shown in green
The ZBT section is composed of distinct alternations of sandy loam soils and eolian sandy loess or sand units (Figure 2). More detailed lithosphere is shown in Table 1. After excavating a 30-40 cm trough to avoid surface contamination, vertical sections were sampled based on stratigraphic observations in the field. In order to minimize the influence of modern vegetation, we begin to sample at a depth of 20 cm. Six OSL samples were collected by hammering stainless steel tubes into cleaned vertical sections and sealing with black plastic bags to avoid light exposure and moisture loss. Samples for organic carbon isotope analysis and magnetic susceptibility analysis were taken at each 10 cm interval from the top to a depth of 17.3 m, for a total of 174 bulk sediment samples.
In the laboratory, each OSL sample was pretreated with H2O2 (30%) and HCl (10%) to remove organics and carbonates, respectively, then rinsed and wet-sieved to select the 90-125 μm grain size. Etching using HF (40%) for 40 min to remove feldspars was followed by re-sieving. All OSL paleodose measurements were undertaken at Nanjing University using a Riso TL/OSL-DA-20C/D reader under the Single Aliquot Regenerative protocol (Murray and Wintle, 2000). The environmental dose rate was calculated from the U, Th and K concentrations, measured by neutron activation analysis (NAA) and inductively coupled plasma mass spectrometry (ICP-MS) inductively coupled plasma atomic emission spectrometry (ICP-AES).
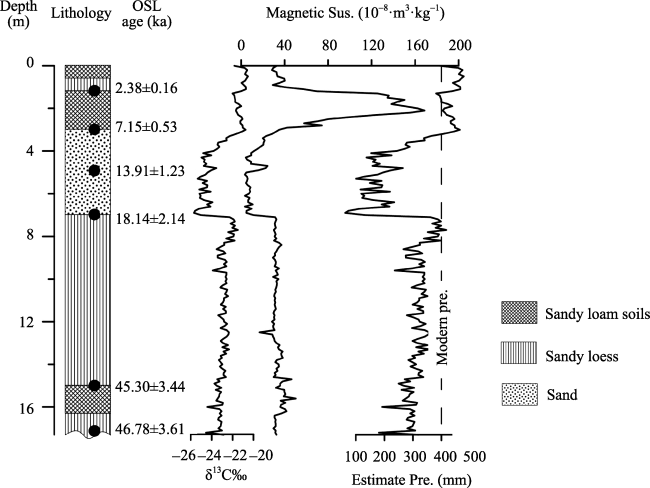
Figure 2 Lithology, OSL dating ages, δ13Corg, magnetic susceptibility (MS) and estimated precipitation of the ZBT loess-sand section. Data of upper part (younger than ~20 ka) of this section has been reported in Lu et al. (2013)
Table 1 The detailed lithology of the ZBT section
Depth (m) Lithosphere description
0-0.6 Loosely yellowish brown sandy loam soil, some grass roots can be observed
0.6-1.2 Compactly light-yellow sandy loess
1.2-3.0 Compactly grayish-black sandy loam soil, worm and insect burrows are frequent
3.0-3.8 Compactly reddish-black fine sand
3.8-5.0 Loosely light yellowish-brown coarse silt
5.0-7.0 Loosely yellowish-brown sand, a sedimentary hiatus seems to occur below this layer
7.0-8.6 Compactly light-yellow sandy loess
8.6-12.8 Loosely grey-yellow sandy loess
12.8-15.0 Loosely grey-brown sandy loess
15.0-16.3 Compactly dark red sandy loam soil
16.3-17.3 Loosely grey-brown sandy loess
17.3- The base is not found
For organic carbon isotope analysis, all samples were sieved to <250 μm after being dried for 48 h at 40℃, in order to remove coarse grains and small plant fragments. Each sieved fine portion was ground to 200-mesh with an agate mortar. Carbonate was removed by adding 10% HCl and repeatedly rinsing with distilled water (till pH≈7). The soil samples were finally dried at 50℃ for isotopic analyses. The carbon isotope composition was determined with an isotope ratio mass spectrometer (Delta Plus; Finnigan MAT) in State Key Laboratory of Lake Science and Environment, Chinese Academy of Sciences. Carbon isotopic data is expressed as δ13C, with δ13C=(Rsample/Rstandard)-1, where R is the 13C/12C ratio and standard is the Vienna Pee Dee Belemnite standard. Magnetic susceptibility (MS) was measured by Bartington MS2 magnetic meter.

2.2 Method of precipitation reconstruction

Soil organic matter is derived from plants, with little isotopic discrimination (Cerling et al., 1997; Huang et al., 2001). Since the plant composition is mainly controlled by precipitation in this region (Liu et al., 2005a, 2005b; Chen et al., 2006; Yao et al., 2011), precipitation and δ13C of soil organic matter should be related. Although a relationship between δ13C and rainfall was quantitatively reconstructed for Nussloch (Hatté et al., 1998, 2001), only C3 plants grew in the cool high latitude setting of that study, and the same relationship cannot be applied to warmer and drier middle latitude regions where C4 plants are common. Ning et al. (2008) had developed an empirical relationship between δ13Corg and precipitation based on the plant and surface soil of the Chinese Loess Plateau, where the mean annual precipitation of the study area has varied between 240 mm and 700 mm during the past ten years. The model was applied to Lantian and Weinan sections in the southern Chinese Loess Plateau, and yielded precipitation of 360-792 mm and 348-845 mm during the last glacial-interglacial cycle, respectively. Our study section is close to the surface soil sampling sites that Ning et al. (2008) studied, and all the sites are dominated by the Asian monsoon circulation, therefore, we initially estimated the precipitation by using this model (Ning et al., 2008):
R = [SQRT(7.17×10²+25.7× δ13CTOC)-6.60]/1.29×10-2) (1)
where R represents the annual precipitation. The function was originally expressed as follows:
δ13CTOC=Fδ13C4+(1-F)δ13C3 (2)
where δ13CTOC is the δ13C value of the soil organic matter (‰); δ13C4 and δ13C3 are the δ13C values of C4 plants and C3 plant, respectively (‰), and F is the proportion of C4 plants in a given ecosystem. For δ13C4 and δ13C3, the δ13C values of both vary negatively with the mean annual precipitation. The functions can be express as:
δ13C3 = -0.00916x - 22.902 (3)
δ13C4 = -0.0044x - 10.307 (4)
where x is the mean annual precipitation. As for F, it has been demonstrated that there was a linear relation between the C4/C3 ratios of soils and annual precipitation (An et al., 2005).
F = 0.00135R - 0.261 (5)
So, equation (1) was got by combining equations (2)-(5). However, when initially applying this function to our isotopic sequence, necessary correction was needed, because our study site is at edge of the region where the above surface sample was taken, the precipitation may be different from that in central and southern Chinese Loess Plateau, thus, we added a constant 0.86 (modern precipitation of ZBT divided by average precipitation of surface sample sites) to modify this function, and obtained a transfer function as following:
R= [SQRT( 7.17×10²+25.7× δ13CTOC)-6.60]/1.29×10-2 × 0.86 (6)
It should be said that considerable uncertainty remains in this transfer function. It should be kept in mind that the transfer function itself is based on several assumptions, each of which can result in uncertainty (Guiot et al., 2000).

3 Results

Dose rates and OSL data are shown in Table 2 and Figure 2. The age at the base of the sampled section is 46.78±3.61 ka, the youngest age is 2.38±0.16 ka at depth of 1.2 m. We constructed the time scale of this aeolian sediment sequence by linearly interpolating the age of each sampling level between the OSL ages and assuming the age of the surface of this section is 0 ka. Thus, we obtained a time scale for the δ13C variation (Figure 2).
Table 2 Dose rate and OSL ages for samples from the ZBT section
Lab.N Sample No. Depth
(cm)
Water (%) K (%) U/ppm Th/ppm De(Gy) Dose rate Aliqouts
Num.
Age (ka)
NJU221 zbt1.2 m 120 2.25 2.13±0.04 2.09±0.09 10.6±0.32 7.92±0.28 3.34±0.18 20 2.38±0.16
NJU222 zbt3 m 300 1.29 2.26±0.04 1.00±0.06 4.67±0.18 20.18±1.16 2.82±0.13 16 7.15±0.53
NJU223 zbt5 m 500 0.28 2.33±0.04 0.39±0.04 2.11±0.12 35.89±2.82 2.58±0.11 16 13.91±1.23
NJU224 zbt7 m 700 0.36 2.28±0.04 0.83±0.05 3.10±0.14 48.50±5.30 2.67±0.12 16 18.14±2.14
NJU225 zbt15 m 1500 3.57 1.89±0.04 2.16±0.09 10.5±0.30 133.00±6.32 2.94±0.17 16 45.30±3.44
NJU226 zbt16.3 m 1630 4.56 1.79±0.03 2.10±0.08 8.60±0.26 125.12±6.43 2.68±0.15 14 46.78±3.61
The stable carbon isotopic composition (δ13C) in organic matter and magnetic susceptibility from the ZBT section are shown in Figure 2. The δ13C signal shows three different phases. In the oldest part, from 46.78 to 18.14 ka, the δ13C values progressively increase from -23.5‰ to -23‰. Between 18.14 and 7.15 ka, the δ13C value is low, at around -25‰, and during the last 7.15 ka, the δ13C signal shows the mean values around -22‰. Magnetic susceptibility shows the same trend as the δ13C, except a large fluctuation around 2.38 ka to 7.15 ka, with a maximum value of 168×10-8 m3 kg-1. Values before 18.14 ka are almost constant with a mean around 32.9×10⁻⁸ m3 kg-1. Data of upper part (younger than ~20 ka) of this loess-sand section has been reported (Lu et al., 2013); in that paper the relationship between the monsoon intensity and atmospheric CO2 was discussed, the topic differed from this study.

4 Discussions

4.1 Reconstruct precipitation from soil organic carbon isotopic composition

The estimated precipitation is shown in Figure 2. It ranges from 63 to 479 mm from 47 ka to the present, with an average of 312 mm, the maximum value was observed in the last 2.3 ka and a minimum in the deglacial period. Variation of the estimated precipitation shows the same trend as the δ13C sequence. Precipitation between 47-26 ka was relatively high and ranged from 181 to 358 mm, with an average of 309 mm. The precipitation between 26 ka and 18 ka ranged from 131 to 418 mm, averaged 338 mm. The lowest precipitation, ranging from 63 to 363 mm, with an average of 194 mm was found between 18 ka to 8 ka. Since ~8 ka, the precipitation is high, with a mean value of 435 mm. Compared with the modern precipitation (401 mm), the average since 8 ka is higher by ~34 mm, the period of 8-18 ka is lower by ~207 mm, the period of 18-26 ka is lower by ~63 mm, and the period between 47-26 ka is lower than the modern by ~92 mm.
There have been several studies that presented quantitative estimates of the past precipitation in the Chinese Loess Plateau, finding that precipitation in the early Holocene was up to 25% higher than at present, and during the last glaciation was lower than the present by ~25% (Maher et al., 1994; Heller et al., 1993). Based on opal phytolith analysis, the precipitation in the Holocene was higher than the modern by ~200 mm, and lower than the modern by ~240 mm during the last glacial maximum (LGM, 26-16 ka) at the Weinan site (Wu et al., 1994). A geochemical transfer function indicates that Holocene precipitation in Weinan was above 700 mm, while it was less than 200 mm in the LGM (Sun et al., 1999). Recently, our research (Yu et al., 2013) found that the precipitation in the LGM decreased by 180-350 mm to the modern, and increased by 100-200 mm to the modern in the Holocene Optimum (HO, 9-5 ka) around our study area, using the sediment analysis and pollen assemblage. All of these results are very close to our results, taking into account the regional precipitation gradient. However, it is difficult to assess which method is the best, because each transfer function has its own drawbacks (Guiot et al., 2000). For instance, the boundary conditions are not always the same between modern conditions and the past, proxies used in the transfer function are not necessarily in equilibrium with the present climate, and the underlying physical processes involved in the proxy data are not direct. Compared with other quantitative methods, the major advantage of the method we used is that the mechanisms linking precipitation and isotopic composition of soil organic matter are relatively clear (Ning et al., 2008). As for all quantitative reconstructions of past climate, further investigation will require comparison of results from a wide variety of methods.

4.2 Data-data and data-model comparison and the possible forcing mechanism of the monsoon precipitation variations

In Figure 3 the record of the ZBT section is compared with other high resolution records in the region influenced by the Asian monsoon circulation, and with Northern Hemisphere (65°N) summer isolation (Berger and Loutre, 1991). This comparison shows that our reconstruction of monsoon precipitation is broadly similar with the δ18O records of stalagmites and Northern Hemisphere (65°N) summer isolation, although the correlation is not significant, suggesting that the δ13C reconstruction is capable of capturing past climatic fluctuations at both the orbital and millennial time scales. However, our record shows some inconsistent with other two records from low latitude, especially before 18 ka, when our record is high and the other two records are low.
Figure 3 Comparison of estimated precipitation from the ZBT section with other proxy records. (a) precipitation of the ZBT site; (b) δ18O records of Stalagmites from Hulu and Sanbao caves (Wang et al., 2008; Wang et al., 2001); (c) δ18O of core 17940 from South China Sea (Wang et al., 1999); (d) water content of core from Huguang Maar Lake in southern China (Mingram et al., 2004); (e) summer isolation, 65°N (Berger et al., 1992); the blue-shaded bar shows the YD cold period.
The generally good correspondence of precipitation changes with Northern Hemisphere 65°N summer isolation suggests that the precipitation was mainly forced by changes in orbital parameters. Summer insolation variation changed the continent-ocean thermodynamic contrast, and thus enhanced or reduced the summer monsoon intensity. In detail, the humid conditions inferred from the ZBT record in the HO agree with other records in East Asia (Figure 3). For the deglacial period, all records exhibit increased summer monsoon intensity and reduced winter monsoon strength, suggesting a progressive warming. Moreover, some dramatic fluctuations especially the Younger Dryas (YD) cold event can be identified in the ZBT precipitation reconstruction. This clearly supports the conclusion of Liu et al. (2013) that high-latitude temperature changes have forced the wed/dry changes in the monsoon marginal region, and provide more evidences between the high- and low-latitude linkage in Northern Hemisphere.
However, the discrepancies between our result and others should also be noted. At around 18-21 ka, our reconstruction shows that precipitation was relatively high and varied from 131 to 418 mm, with average of 355 mm, while strong winter monsoon activity recorded by other records indicates a dry phase. Inconsistencies can also be observed in the period 10-7 ka, when other records reveal a wet climate but it was dry in our research area. This conflict has been interpreted as the result of enhanced subsidence in drylands north of the monsoon core, together with greater than modern evapotranspiration (Lu et al., 2005; Mason et al., 2009).
In addition, climate simulations also provide some results that help interpret climate changes in East Asia from the LGM and the HO. In LGM, the simulations based on Paleoclimate Modeling Intercomparison Project (PMIP) indicate that the monsoon was strengthened north of 30°N but weakened to the south of that latitude in East Asia, and 14 models chosen in the study consistently simulated a weaker than present East Asian summer monsoon during the LGM, with an average weakening of 25% (Jiang and Lang, 2010). Annual precipitation and evaporation during the LGM were about 25% less than the present in this area (Jiang et al., 2011). Given that the present precipitation of 401 mm, the simulated 25% less yields a value of about 301 mm, which is about 37 mm less than our reconstruction of 338 mm. In the HO, based on the PMIP, the mid-Holocene East Asian monsoon intensity increased by 32% relative to the present level (Jiang et al., 2013). Converted to precipitation, this yields a value of about 529 mm, about 94 mm more than our result of 435 mm during 0-8 ka. These differences reflect the need for additional improvement of the accuracy of both of the data reconstruction and the numerical modeling.
However, the differences between our reconstruction and simulation results are relatively small given the uncertainties of both models and our preliminary results, and quantitatively they are the same in terms of the direction of change at various times, suggesting that our δ13CTOC reconstruction is helpful in understanding the monsoon precipitation behavior in the snady land region.

5 Conclusions

The East Asian monsoon precipitation over the past 47 ka was reconstructed using organic carbon isotopic composition of aeolian depsoit. Our results suggest that the precipitation was relatively higher from 47 to ~26 ka, ranging from 181 to 358 mm with an average of 309 mm. For 26-18 ka, the reconstructed precipitation has an average of 338 mm. It has an average of 194 mm in the deglacial period; the precipitation is relatively higher and has a mean value of 435 mm since ~8 ka. This is the first to use the carbon isotopic composition of the aeolian sediments to reconstruct the past precipitation changes in the snady land in northern China; uncertainty existed and a further research needs to improve the precision.

The authors have declared that no competing interests exist.

1
An Z S, Huang Y S, Liu W Get al., 2005. Multiple expansions of C4 plant biomass in East Asia since 7 Ma coupled with strengthened monsoon circulation.Geology, 33: 705-708.

2
Berger A, Loutre M F, 1991. Insolation values for the climate of the last 10 million years.Quaternary Science Reviews, 10: 297-317.

3
Bloemendal J, Liu X M, 2005. Rock magnetism and geochemistry of two plio-pleistocene Chinese loess-palaeosol sequences: Implications for quantitative palaeoprecipitation reconstruction.Palaeogeography, Palaeoclimatology, Palaeoecology, 226: 149-166.

4
Cerling T E, Harris J M, MacFadden B Jet al., 1997. Global vegetation change through the Miocene/Pliocene boundary.Nature, 389: 153-158.

5
Cerling T E, Quade J, Wang Yet al., 1989. Carbon isotopes in soil and paleosols as ecologic and paleoecologic indicators.Nature, 341: 138-139.

6
Chen F H, Rao Z G, Zhang J Wet al., 2006. Variations of organic carbon isotopic composition and its environmental significance during the last glacial on western Chinese Loess Plateau.Chinese Science Bulletin, 51: 1593-1602.

7
Gu Z Y, Liu Q, Xu Bet al., 2003. Climate as the dominant control on C3 and C4 plant abundance in the Loess Plateau: Organic carbon isotope evidence from the last glacial-interglacial loess-soil sequences.Chinese Science Bulletin, 48: 1271-1276.

8
Guiot J, Torre F, Jolly Det al., 2000. Inverse vegetation modeling by Monte Carlo sampling to reconstruct palaeoclimates under changed precipitation seasonality and CO2 conditions: Application to glacial climate in Mediterranean region.Ecological Modelling, 127: 119-140.

9
Hatté C, Antoine P, Fontugne Met al., 2001. δ13C of loess organic matter as a potential proxy for paleoprecipitation.Quaternary Research, 55: 33-38.

10
Hatté C, Fontugne M, Rousseau D Det al., 1998. δ13C variations of loess organic matter as a record of the vegetation response to climatic changes during the Weichselian.Geology, 26: 583-586.

11
Heller F, Shen C D, Beer Jet al., 1993. Quantitative estimates of pedogenic ferromagnetic mineral formation in Chinese loess and palaeoclimatic implications.Earth and Planetary Science Letters, 114: 385-390.

12
Huang Y, Street-Perrott F A, Metcalfe S Eet al., 2001. Climate change as the dominant control on glacial-interglacial variations in C3 and C4 plant abundance.Science, 293: 1647-1651.

13
Jiang D B, Lang X M, 2010. Last Glacial Maximum East Asian monsoon: Results of PMIP simulations.Journal of Climate, 23: 5030-5038.

14
Jiang D B, Lang X M, Tian Z Pet al., 2011. Last glacial maximum climate over China from PMIP simulations.Palaeogeography, Palaeoclimatology, Palaeoecology, 309: 347-357.

15
Jiang D, Lang X M, Tian Z Pet al., 2013. Mid-Holocene East Asian summer monsoon strengthening: Insights from Paleoclimate Modeling Intercomparison Project (PMIP) simulations. Palaeogeography, Palaeoclimatology, Palaeoecology, 369: 422-429.

16
Lin B H, Liu R M, An Z S, 1991. Preliminary research on stable isotopic compositions of Chinese loess. In: Liu T S (eds). Loess, Environment and Global Change. Beijing: Science Press, 124-131. (in Chinese)

17
Liu W G, Feng X H, Ning Y Fet al., 2005. δ13C variation of C3 and C4 plants across an Asian monsoon rainfall gradient in arid northwestern China.Global Change Biology, 11: 1094-1100.

18
Liu W G, Huang Y S, An Z Set al., 2005. Summer monsoon intensity controls C4/C3 plant abundance during the last 35 ka in the Chinese Loess Plateau: Carbon isotope evidence from bulk organic matter and individual leaf waxes.Palaeogeography, Palaeoclimatology, Palaeoecology, 220: 243-254.

19
Liu W G, Ning Y F, An Z Set al., 2005. Carbon isotopic composition of modern soil and paleosol as a response to vegetation change on the Chinese Loess Plateau. Science in China Series D: Earth Sciences 48: 93-99.

20
Liu X M, Rolph T, Bloemendal Jet al., 1995. Quantitative estimates of palaeoprecipitation at Xifeng, in the Loess Plateau of China. Palaeogeography, Palaeoclimatology,Palaeoecology, 113: 243-248.

21
Lu H Y, Miao X D, Zhou Y Let al., 2005. Late Quaternary aeolian activity in the Mu Us and Otindag dune fields (North China) and lagged response to insolation forcing.Geophysical Research Letters, 32(21), L21716, doi: 10.1029/2005GL024560.

22
Lu H Y, Wu N Q, Liu T Set al., 1996. Seasonal climatic variation recorded by phytolith assemblages from the Baoji loess sequence in central China over the last 150 000 a.Science in China Series D, Earth Science, 39: 629-639. (in Chinese)

23
Lu H Y, Yi S W, Liu Z Yet al., 2013. Variation of East Asian monsoon precipitation during the past 21 k.y. and potential CO2 forcing.Geology, 41(9): 1023-1026.

24
Lu H Y, Zhou Y L, Liu W Get al., 2012. Organic stable carbon isotopic composition reveals late Quaternary vegetation changes in the dune fields of northern China.Quaternary Research, 77: 433-444.

25
Maher B A, Thompson R, Zhou L P, 1994. Spatial and temporal reconstructions of changes in the Asian palaeomonsoon: A new mineral magnetic approach.Earth and Planetary Science Letters, 125: 461-471.

26
Mason J A, Lu H Y, Zhou Y Let al., 2009. Dune mobility and aridity at the desert margin of northern China at a time of peak monsoon strength.Geology, 37: 947-950.

27
Mingram J, Schettler G, Nowaczyk Net al., 2004. The Huguang Maar Lake: A high-resolution record of palaeoenvironmental and palaeoclimatic changes over the last 78,000 years from South China.Quaternary International, 122: 85-107.

28
Mosbrugger V, Utescher T, 1997. The coexistence approach: A method for quantitative reconstructions of Tertiary terrestrial palaeoclimate data using plant fossils. Palaeogeography, Palaeoclimatology, Palaeoecology, 134: 61-86.

29
Murray A S, Wintle A G, 2000. Luminescence dating of quartz using an improved single-aliquot regenerative-dose protocol.Radiation Measurements, 32: 57-73.

30
Ning Y F, Liu W G, An Z S, 2008. A 130-ka reconstruction of precipitation on the Chinese Loess Plateau from organic carbon isotopes.Palaeogeography, Palaeoclimatology, Palaeoecology, 270: 59-63.

31
Quade J, Cerling T E, Bowman J R, 1989. Development of Asian monsoon revealed by marked ecological shift during the latest Miocene in northern Pakistan.Nature, 342: 163-165.

32
Rao Z G, Chen F H, Cheng Het al., 2013. High-resolution summer precipitation variations in the western Chinese Loess Plateau during the last glacial. Scientific Reports, 3: 2785, doi: 10.1038/srep02785.

33
Rao Z G, Zhu Z Y, Chen F Het al., 2006. Does δ13Ccarb of the Chinese loess indicate past C3/C4 abundance? A review of research on stable carbon isotopes of the Chinese loess.Quaternary Science Reviews, 25: 2251-2257.

34
Schulze E D, Ellis R, Schulze Wet al., 1996. Diversity, metabolic types and δ13C carbon isotope ratios in the grass flora of Namibia in relation to growth form, precipitation and habitat conditions.Oecologia, 106: 352-369.

35
Stewart G, Turnbull M, Schmidt Set al., 1995. 13C natural abundance in plant communities along a rainfall gradient: A biological integrator of water availability.Australian Journal of Plant Physiology, 22: 51-55.

36
Sun J M, Diao G Y, Wen Q Zet al., 1999. A preliminary study on quantitative estimate of palaeoclimate by using geochemical transfer function in the Loess Plateau.Geochimica, 28: 265-272. (in Chinese)

37
Wang G A, Han J M, Liu T S, 2003. The carbon isotope composition of C3 herbaceous plants in loess area of northern China.Science in China Series D: Earth Sciences, 46: 1069-1076.

38
Wang L J, Sarnthein M, Erlenkeuser Het al., 1999. East Asian monsoon climate during the Late Pleistocene: High-resolution sediment records from the South China Sea.Marine Geology, 156: 245-284.

39
Wang Y J, Cheng H, Edwards R Let al., 2001. A high-resolution absolute-dated late Pleistocene monsoon record from Hulu Cave, China.Science, 294: 2345-2348.

40
Wang Y J, Cheng H, Edwards R Let al., 2008. Millennial- and orbital-scale changes in the East Asian monsoon over the past 224,000 years.Nature, 451: 1090-1093.

41
Wu N Q, Lu H Y, Sun X Jet al., 1994. Climate transfer function from opal phytolith and its application in paleoclimate reconstrution of China loess-paleosol sequence.Quaternary Sciences, 270-279. (in Chinese)

42
Xia D S, Jia J, Wei H Tet al., 2012. Magnetic properties of surface soils in the Chinese Loess Plateau and the adjacent Gobi areas, and their implication for climatic studies.Journal of Arid Environments, 78: 73-79.

43
Yao Z, Wu H, Liang Met al., 2011. Spatial and temporal variations in C3 and C4 plant abundance over the Chinese Loess Plateau since the last glacial maximum.Journal of Arid Environments, 75: 881-889.

44
Yu K F, Lu H Y, Frank Let al., 2013. A preliminary quantitative paleoclimate reconstruction of the dune fields of northern China during the last glacial maximum and Holocene optimum.Quaternary Sciences, 33: 293-302. (in Chinese)

Outlines

/