Orginal Article

Aridity trend and response to vegetation restoration in the loess hilly region of northern Shaanxi Province

  • LI Wangjun , 1, 2 ,
  • LU Changhe , 1, *
Expand
  • 1. Key Laboratory of Land Surface Pattern and Simulation, Institute of Geographic Sciences and Natural Resources Research, CAS, Beijing 100101, China
  • 2. University of Chinese Academy of Sciences, Beijing 100049, China

*Corresponding author: Lu Changhe (C.H.Lu), Professor, E-mail:

Author: Li Wangjun, PhD Candidate, E-mail:

Received date: 2014-01-07

  Accepted date: 2014-03-22

  Online published: 2015-03-15

Supported by

National Basic Research Program of China, No.2012CB955304

Copyright

Journal of Geographical Sciences, All Rights Reserved

Abstract

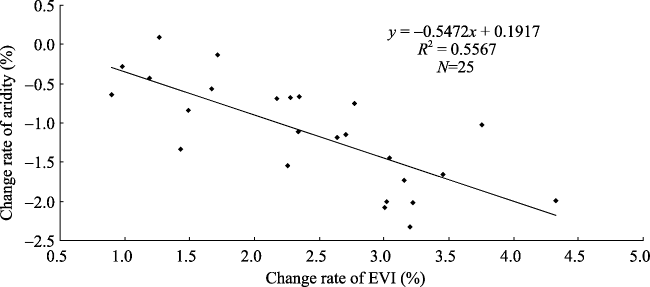
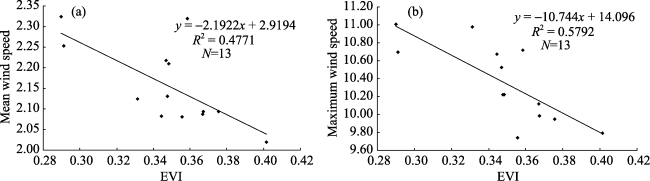
Detecting variation trend in dry-wet conditions can provide information for developing strategic measures to mitigate the impacts of global warming, particularly in dry regions. Taking the hilly region of northern Shaanxi on the Loess Plateau as a case area, this study analyzed the trend of aridity variation during 1981-2012, and explored the effect of vegetation restoration promoted by the Grain-for-Green (GFG) program implemented in 1999. The results indicated that the aridity in the region was non-significantly increased by 0.88% per year during 1981-2012, showing a drying trend. This drying trend and amplitude were changed by the influence of vegetation restoration promoted by the GFG program, based on two findings. The first one was that the aridity variation tended to increase during 1981-1999 while it turned to decrease during 2000-2012, with the regional mean relative change rate changed from 2.45% to -1.06%. This distinction was more remarkable in the loess gully region, where the vegetation was improved more obviously. The second one was that the mean vegetation coverage as indicated by EVI increased by 0.90% to 4.32% per year at county level, while the aridity decreased by 0.14% to 2.32% per year during 2000-2012. The regression analysis using the mean county data indicated that the change rate of aridity was negatively related to that of EVI with the coefficient of determination (R2) of 0.56, illustrating that around half of the aridity decline was explained by the EVI change. The mechanism of this effect was complicated, but it was found that the wind speed decline induced by the vegetation improvement could be an important contributor. It is concluded that the region became drier during 1981-2012, but the eco-restoration reduced the drying speed. However, this conclusion is involved in uncertainties, and further study based on experiments is needed to confirm the effect of the GFG-promoted vegetation restoration.

Cite this article

LI Wangjun , LU Changhe . Aridity trend and response to vegetation restoration in the loess hilly region of northern Shaanxi Province[J]. Journal of Geographical Sciences, 2015 , 25(3) : 289 -300 . DOI: 10.1007/s11442-015-1168-9

1 Introduction

Understanding variation trend of dry-wet conditions is important for developing strategic measures to mitigate the impacts of global warming, particularly in dry regions that are short of available water and sensitive to moisture changes. Observations and numerous studies have indicated the wide existence of temperature rising from local to global levels (IPCC, 2013; Huang et al., 2012), however many studies have showed that changing trend in dry-wet condition varied among different regions. For instance, during the past 30-50 years, climate was becoming wetter in Xinjiang (Pu et al., 2011) and the Tibet Plateau (Wu et al., 2005), while it was becoming drier in Northeast China (Wang et al., 2008) and in Hebei (Yang et al., 2009). These reflect that although temperature rising accelerates rate of evaporation (ACIA, 2004; USGCRP, 2009), the climate is not accordingly becoming drier, as variation of dry-wet condition is also affected by changes of other climatic factors such as precipitation, solar radiation and wind speeds. In addition, human induced changes of land cover disturb the land surface energy budget (Pielke et al., 2002), and thus affect the climate (Marlanda et al., 2003; Dirmeyer et al., 2010; Mahmood et al., 2010; Yao et al., 2013; Xie et al., 2014). Recent studies in China indicated that vegetation variations had an important influence on the temperature and precipitation with the effect varying among different climate conditions (Ma et al., 2013; Ge et al., 2014).
Northern Shaanxi is located in the center of the Loess Plateau, with a semi-arid to sub-humid climate and a vulnerable ecosystem. It is a region sensitive to global changes and heavily affected by human activities during the past decades. Due to over-cultivation of sloping land, the region is suffering from serious soil erosion. To promote the ecological restoration, the Chinese government implemented the Grain-for-Green program (GFG) by converting sloping farmland to forestland or grassland in 1999. Up to 2012, this program has been implemented for 13 years, which has resulted in a great change in the land use and land cover (Zhou et al., 2006), promoted the restoration of vegetation (Xin et al., 2009; Zhou et al., 2009; Li et al., 2013; Liu et al., 2013), and alleviated the soil degradation (Wang et al., 2005; Xu et al., 2011). These variations influenced significantly the relative humidity, wind speed, and evapotranspiration (Shi et al., 2007; Han et al., 2009) as a result of changes in the land surface roughness/albedo, soil moisture regime, and thus the land surface energy balance (Zheng et al., 2002).
This study has two aims: the first is to detect variation trend of aridity during the past three decades in the region, and the second is to explore the effect of vegetation restoration by comparing the variation trend of annual aridity before and after the GFG, and by analyzing the relationship between changes of aridity and vegetation cover during 2000-2012. The vegetation cover was indicated by EVI (enhanced vegetation index), one of the widely used vegetation indices (Du Plessis, 1999; Piao et al., 2006; Zhou et al., 2009; De Jong et al., 2011). EVI is better than NDVI to reflect the vegetation cover and its variation (Rocha et al., 2009; Potithep et al., 2010).

2 Data and methods

2.1 Study area

The study area (Figure 1, 36°09′N-39°35′N, 107°14′E-111°16′E) is a typical hilly region on the Loess Plateau, next to Shanxi in the east, to Gansu and Ningxia in the west, and to the Ordos Plateau in the north. It has an altitude between 385 m and 1911 m, with highly dissected loess terrain. It includes three prefectural cities of Yulin, Yan’an and Tongchuan, consisting of 25 counties and 3 districts, with an area of about 8.4×10⁴ km2. The mean annual temperature is 8.24-13.06℃, decreasing from south to north. Annual precipitation is above 600 mm in the south, gradually decreasing to below 400 mm in the northwest. The precipitation varies seasonally and annually, with more than 60% of the annual total falling in rainy season of July-September and relative variation (CV) of 20%-30%.
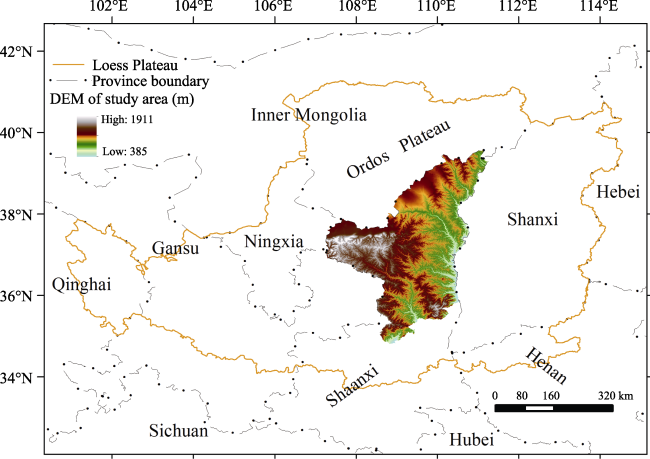
Figure 1 Location of the study area

2.2 Data sources and processing

Weather observation and MODIS data were collected. Daily meteorological data for 11 meteorological stations in the study area were obtained from the China Meteorological Data Sharing Service System (http://cdc.cma.gov.cn), including precipitation, temperature, sunshine duration, wind speed, relative humidity, etc. The data had a time span of 33 years (1981- 2012) for 8 stations, and 13-24 years for Dingbian (1989-2012), Tongchuan (1981- 1999), and Yaoxian (2000-2012). The data records are generally good and completed, but have some missing values and anomalies in few years, which were replaced by the mean value of the same day. MODIS data (MOD09A1) for the period of 2000-2012 were downloaded from the website of NASA LAADS (http://ladsweb.nascom.nasa.gov/data/search.html). The data have a spatial resolution of 500×500 m and a time resolution of 8 days, which were corrected for atmospheric, aerosol scattering, molecular and cloudiness. The EVI was calculated based on three bands of red (ρred), blue (ρblue), and near infrared (ρnir) for each of the total 46 phase images per year, of which the maximum EVI in the growing season from April to October was considered as the annual EVI for individual pixel, with the following equation (Huete et al., 2002):

2.3 Calculation of aridity

Aridity (K) is defined as a ratio of annual potential evapotranspiration (ET0) to annual precipitation (P): K = ET0/P. In which, ET0 was calculated using Penman-Monteith equation (Allen et al., 1998), a widely used method (Gong et al., 2006; Yin et al., 2008; Yin et al., 2010; Liu et al., 2012). Solar radiation is not available and thus was calculated using Angstrom equation (Angstrom, 1924): Ra= Rs×(a+ b×n/N), where Ra and Rs are terrestrial surface and extraterrestrial radiation, and n and N are observed and maximum possible daily sunshine duration, respectively. The coefficients a and b were valued as 0.18 and 0.55, based on Li et al. (2004) of the Loess Plateau.

2.4 Trend detection and change amplitude estimation

Mann-Kendall (MK) is used to detect the trend of annual aridity for 1981-2012, 1981-1999, and 2000-2012. The MK is a non-parametric statistical test, to detect the presence of a changing trend within a time series in the absence of any seasonal variation or other cycles (Partal et al., 2006; Deano et al., 2008), and widely used in detecting variation trend of hydrologic and climatic factors (Hamed and Rao, 1998; Yue and Wang, 2002; Fan et al., 2012; Ahani et al., 2013). This method treats the values of time data series, x1, x2..., xn as a random sample of n independent and identically distributed variables. The trend was determined according to the test statistic Z or S, as calculated with the following equations:
where xj and xk are observations in the year j and k (j>k), respectively, and t is the extent of any given tier and q is the number of tier.
When time series are less than 10 values, the S test is used (Gilbert, 1987), otherwise the Z test. A positive value of Z or S indicates an increasing trend and a negative value a decreasing trend. If the absolute value, |Z| < Zα/2 at the α significance level, a null hypothesis H0 is accepted, i.e., the observations xi are randomly ordered without significant trend, otherwise, the alternative hypothesis H1 is accepted, i.e., the observations xi are monotonically and significantly increasing or decreasing (Gilbert, 1987; Sicard et al., 2010).
Sen’s estimator, a consistent non-parametric estimator for the coefficient of a linear regression (Sen, 1968) is used to estimate the slope (amplitude) of data series:
where xj and xk are the observed data at j and k (j>k), respectively; N=n(n+1)/2, and Qmed is the median of Qi, i.e., the amplitude of annual changes, which can be transformed to relative change rate (%) by dividing the mean value of the time series (Xmean), Qmed/ Xmean·100.
A program was developed using the matlab software, to calculate the test statistic Z and the Sen’s slope Qmed of annual aridity for each of the 11 meteorological stations and the annual EVI for each grid. The spatial distribution of Z and Qmed values for the aridity were mapped using the inverse distance weighting method (IDW) with a spatial resolution of 500×500 m based on the point data at the 11 stations. A regression method was applied to identify the relevance of EVI change to aridity change during 2000-2012, with the county data obtained using ArcGIS statistical tools based on the Qmed maps of aridity and EVI by overlaying the county map.

3 Results analysis

3.1 Spatial variation of annual aridity

The long-term mean aridity during 1981-2012 was 1.08-2.85 for different stations (Table 1), showing an increasing trend from south to northwest due to a decrease in precipitation (Figure 2). In the northwestern part, a transitional zone between the Loess Plateau and the Ordos Plateau, aridity was above 2.0 and annual precipitation was mostly below 400 mm. In the loess gully region covering Hequ, Yulin, Suide, Wuqi and Yan’an, aridity ranged from 1.2 to 2.0 and annual precipitation was 400-600 mm. In the southern part, climate was relative humid, with the aridity decreased to around 1.2 and the precipitation increased to 600-650 mm. Taking 2.0 of aridity index as the criterion for semi-arid and sub-humid climate (Yang et al., 2002), northern Shaanxi mostly falls into the category of sub-humid climate except the northwestern part that has a semi-arid climate.
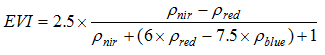
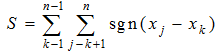
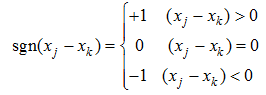
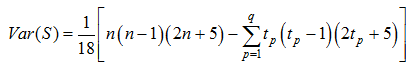
Table 1 Mean and coefficient of variation (CV) of aridity during 1981-2012
Hequ Yulin Yanchi Dingbian Wuqi Hengshan Suide Yan’an Luochuan Tongchuan Yaoxian
Aridity 1.66 1.89 2.85 2.56 1.28 2.25 1.95 1.23 1.08 1.07 1.38
CV 0.27 0.24 0.25 0.26 0.24 0.25 0.24 0.23 0.23 0.38 0.22

Note: Dingbian, 1989-2012; Tongchuan, 1981-1999; Yaoxian, 2000-2012

3.2 Trend of annual aridity

During 1981-2012, aridity varied markedly from year to year, with the coefficient of variation (CV) ranging from 0.22 to 0.38 in the region (Table 1), and showed a non-significant and slight increase trend at most stations except Yanchi, as indicated by the test statistic Z and the slope Q values (Table 2). This increasing trend was more obvious during 1981-1999, as the Z and Q values were much higher at most stations. At three stations of Hengshan, Suide, and Yan’an in the gully region, the increasing trend was significant at the 0.1 and 0.05 significance levels (Table 2 and Figure 3). During 2000-2012 when the GFG has been implemented, aridity showed an opposite trend, tending to non-significantly decline at more than half of the stations, including Hequ, Hengshan, Suide, and Yan’an in the gully region.
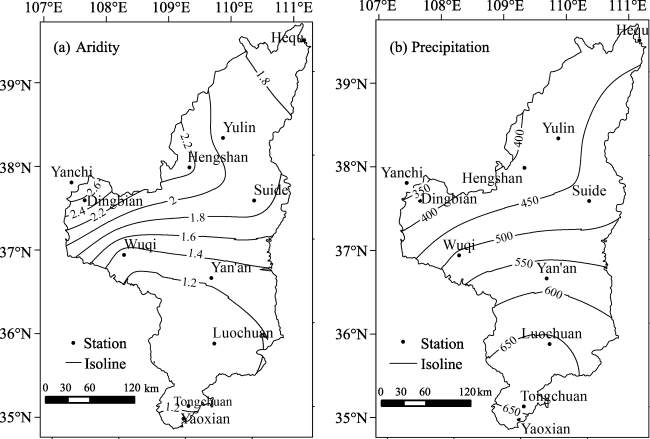
Figure 2 Spatial distribution of mean aridity (a) and precipitation (mm) (b) during 1981-2012
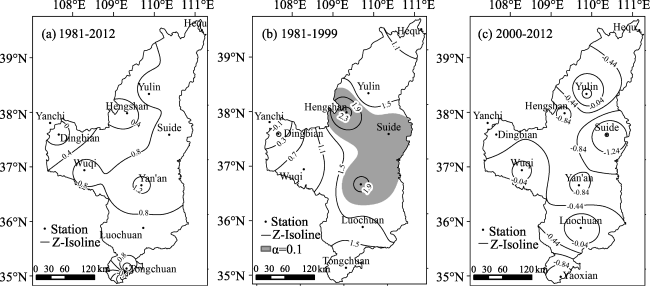
Table 2 Test statistic Z and slope Q values at different stations during 1981-2012, 1981-1999 and 2000-2012, respectively
Station 1981-2012 1981-1999 2000-2012
Z Q Z Q Z Q
Hequ 1.09 0.011 0.84 0.023 -0.79 -0.010
Yulin 0.96 0.007 1.26 0.023 0.43 0.010
Yanchi -0.02 -0.001 -0.49 -0.011 -0.31 -0.049
Dingbian na na na na -0.67 -0.050
Wuqi 0.92 0.006 0.84 0.014 0.06 0.005
Henshan 0.18 0.003 2.38* 0.052 -0.92 -0.067
Suide 0.96 0.009 1.82+ 0.040 -1.65+ -0.051
Yan’an 1.28 0.007 1.96+ 0.030 -0.92 -0.015
Luochuan 0.76 0.003 1.47 0.020 0.31 0.004
Tongchuan na na 1.61 0.021 na na
Yaoxian na na na na -1.40 -0.031

Note: + and *: significant at the 0.1 and 0.05 significance level, respectively. na: not available

Figure 3 Spatial distribution of Z values during periods of 1981-2012 (a), 1981-1999 (b) and 2000-2012 (c)
At Yulin, Wuqi and Luochuan stations, the variation tendency was not changed, but the Z and Q values were markedly decreased compared to those during 1981-1999, showing a less significance and a lower speed in the drying trend (Table 2).

3.3 Change rate in aridity

Figure 4 presents the spatial distribution of annual relative change rate in aridity for the three periods. It can be seen that the change rate varied spatially and differed obviously among the three periods. During 1981-2012 and 1981-1999, the annual change rate ranged from 0.0% to 3.5% in the most part (above 94%), with the regional average of 0.88% and 2.45%, respectively, indicating that the increasing rate was much higher during the first 19 years than the whole period from 1981 to 2012. However, it turned to be negative, mostly between -3.08% and 0.0%, with the regional average of -1.06% during 2000-2012. This aridity decline was more apparent at Hengshan, Suide and Yan’an stations in the gully region, the key area of the GFG program. At these three stations, the variation rate was between -3.08% and -1.22%, while it was 3.06% to 3.54% during 1981-1999, showing a distinct change tendency between the two periods before and after the GFG.

3.4 Vegetation restoration and its effects on the aridity

During 2000-2012, 96.8% of the study area showed an increasing trend in the EVI (Figure 5), and the mean increase rate for the whole region was 1.72% per year. In 64.2% of the study area, mainly distributed in the gully region, the EVI was significantly increased at the 0.05 significance level (Z≥1.96). This implied that the vegetation was markedly improved in the most part since the implementation of the GFG. This improvement was mainly attributed to the GFG program, which was also recognized by several studies (Ma et al., 2009; Xin et al., 2009; Zhou et al., 2009; Li et al., 2013; Liu et al., 2013).
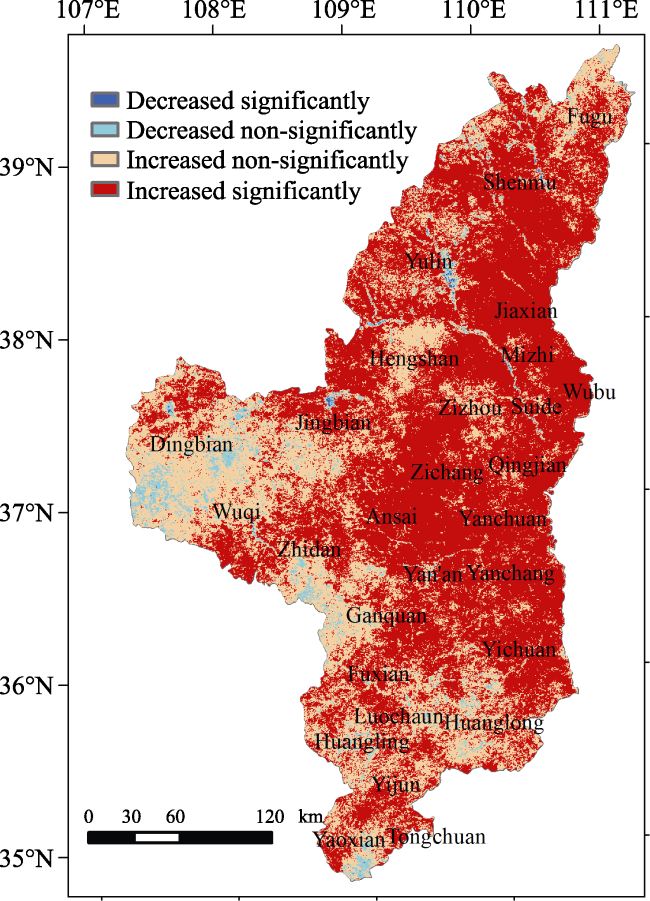
Figure 5 Spatial distribution of the trend of EVI variation during 2000-2012

(Decreased significantly, Z≤-1.96; decreased non-significantly, -1.96<Z<0; increased significantly, Z≥1.96; increased non-significantly, 0<Z< 1.96)

The trend of EVI variation was opposite to that of aridity in most parts of the region. At county level, the variation rate was 0.90% to 4.32% per year for EVI, while it was -0.14% to -2.32% per year for aridity (excluding Luochuan with a value of 0.09%). The regression analysis based on these county level data indicated that the change amplitude of aridity was significantly and negatively related to that of EVI during 2000-2012 (Figure 6), with the coefficient of determination (R2) of 0.56 (N=25, P<0.01). This illustrated that around half of the arid ity decline could be attributed to the effect of vegetation restoration, implying that the GFG program indirectly reduced the dry ness and stimulated the improvement of moisture condition in this hilly region.
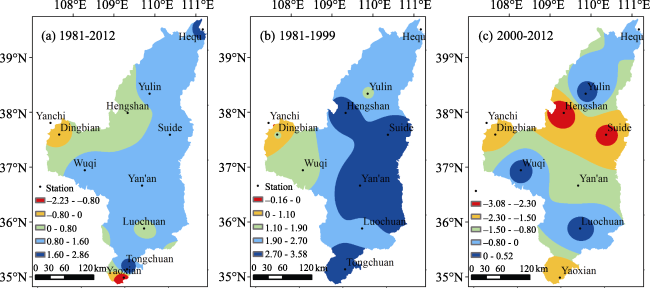
Figure 4 Spatial distribution of the relative change rate (%) during 1981-2012 (a), 1981-1999 (b) and 2000-2012 (c)
analysis based on these county level data indicated that the change amplitude of aridity was significantly and negatively related to that of EVI during 2000-2012 (Figure 6), with the coefficient of determination (R2) of 0.56 (N=25, P<0.01). This illustrated that around half of the arid ity decline could be attributed to the effect of vegetation restoration, implying that the GFG program indirectly reduced the dry ness and stimulated the improvement of moisture condition in this hilly region.
The mechanism for this effect is complicated and difficult to have a clear explanation due to limited data available. Previous studies show that climatic effects of vegetation variation exist (Dirmeyer et al., 2010; Mahmood et al., 2010), as it disturbs the land surface energy budget (Pielke et al., 2002), and thus affects the local climate (Marlanda et al., 2003). Some research in China found that forest expansion caused changes in local temperature and precipitation (Ma et al., 2013; Ge et al., 2014), and significantly affected wind speed (Shi et al., 2007; Zhou et al., 2011). In this study, we analyzed correlations of annual precipitation, temperature and wind speed with annual EVI, respectively, using the regional mean yearly data from 2000 to 2012, and found that the first two had no relationship with EVI, but the mean and maximum wind speed had a negative relationship (Figure 7). This implied that the improvement of vegetation reduced the wind speed. During the 13 years, the annual mean wind speed showed a significant decreasing trend at the ≤0.05 significance level, with a change rate of -0.014 m/s (-0.65% of the annual mean) per year. This decrease could be partly contributed by the improvement of vegetation. As an important factor affecting evapotranspiration (Gong et al., 2006; Yin et al., 2010), wind speed decline could certainly cause a reduction in the evapotranspiration, and thus resulted in a decrease of aridity.
Figure 6 Regression relationship between relative change rates of aridity and EVI at county level
Figure 7 Regression relationship of mean (a) and maximum (b) wind speed (m/s) with EVI during 2000-2012

4 Conclusions

This study analyzed the aridity trend of northern Shaanxi on the Loess Plateau during 1981-2012 and the effect of vegetation restoration promoted by the Grain-for-Green (GFG) program implemented in 1999. It is found that: (1) the hilly region of northern Shaanxi on the Loess Plateau tended to be drier during 1981-2012, with the regional mean aridity increased by 0.88% per year. This finding is in accordance with a previous study result that climate tended to be drier in the semi-arid regions of northern China including the Loess Plateau during 1961-2006, although China as a whole tended to be wetter (Yin et al., 2009). (2) The drying trend and amplitude in the region seem to be changed by the influence of vegetation restoration promoted by the GFG program. This conclusion was based on the two findings: the first one was that the aridity variation tended to increase during 1981-1999 while it turned to decrease during 2000-2012, with the regional average relative change rate of 2.45% turned to -1.06%. This distinction was more remarkable in the loess gully region, where the vegetation was improved more obviously because it, as the key region for GFG program, had much higher investment than other areas; the second one was that the change rate of aridity during 2000-2012 was markedly related to that of EVI (R2=0.56), illustrating that the vegetation restoration had a positive effect on the regional moisture condition by reducing the dryness.
To detect the influence of vegetation restoration on the aridity needs long-term data, the GFG program has been implemented for only 13 years, so, the time span and data may not be long enough for revealing the effect. For this reason, we used a comparison method by comparing the difference in the aridity trend before and after the GFG and a regression approach by analyzing the relationship between change rates of aridity and EVI, to explore the effect of vegetation restoration. The study results indicated that this comparison approach was efficient in revealing the effect of vegetation restoration. A further study based on field observations and experiments is needed to confirm this effect.

The authors have declared that no competing interests exist.

1
ACIA, 2004. Impacts of a Warming Arctic: Arctic Climate Impact Assessment. Arctic Climate Impact Assessment. Cambridge, United Kingdom: Cambridge University Press.

2
Ahani H, Kherad M, Kousari M Ret al., 2013. Non-parametric trend analysis of the aridity index for three large arid and semi-arid basins in Iran.Theoretical and Applied Climatology, 112(3/4): 1-12.

3
Allen Richard G, Pereira Luis S, Raes Dirket al., 1998. FAO Irrigation and Drainage Paper No.56: Crop evapotranspiration: Guidelines for computing crop water requirements. Food and Agriculture Organization of the United Nations. Rome.

4
Angstrom A, 1924. Solar and terrestrial radiation. Report to the international commission for solar research on actinometric investigations of solar and atmospheric radiation.Quarterly Journal of the Royal Meteorological Society, 50(210): 121-126.

5
De Jong Rogier, De Bruin Sytze, De Wit Allardet al., 2011. Analysis of monotonic greening and browning trends from global NDVI time-series.Remote Sensing of Environment, 115(2): 692-702.

6
Deaño R Bouza, Rodríguez M Ternero, Espinosa A J Fernández, 2008. Trend study and assessment of surface water quality in the Ebro River (Spain).Journal of Hydrology, 361(3/4): 227-239.

7
Dirmeyer Paul A, Niyogi Dev, De Noblet-Ducoudréet al., 2010. Impacts of land use change on climate.International Journal of Climatology, 30(13): 1905-1907.

8
Du Plessis W P, 1999. Linear regression relationships between NDVI, vegetation and rainfall in Etosha National Park, Namibia.Journal of Arid Environments, 42(4): 235-260.

9
Fan Lan, Lu Changhe, Yang Biaoet al., 2012. Long-term trends of precipitation in the North China Plain.Journal of Geographical Sciences, 22(6): 989-1001

10
Ge Quansheng, Zhang Xuezhen, Zheng Jingyun, 2014. Simulated effects of vegetation increase/decrease on temperature changes from 1982 to 2000 across the eastern China.International Journal of Climatology, 34(1): 187-196.

11
Gilbert Richard O, 1987. Statistical methods for environmental pollution monitoring. New York: Van Nostrand Reinhold Company Inc., 204-240.

12
Gong Lebing, Xu Chongyu, Chen Delianget al., 2006. Sensitivity of the Penman-Monteith reference evapotranspiration to key climatic variables in the Changjiang (Yangtze River) basin.Journal of Hydrology, 329(3): 620-629.

13
Hamed K H, Rao A R, 1998. A modified Mann-Kendall trend test for autocorrelated data.Journal of Hydrology, 204(1-4): 182-196.

14
Han Xinhui, Yang Gaihe, Liu Zhichao, 2009. Vegetation changes of Loess Plateau and Ansai county and the responding characteristics of climate.Acta Botanica Boreali-Occidentalia Sinica, 29(3): 593-600. (in Chinese)

15
Huang J, Guan X, Ji F, 2012. Enhanced cold-season warming in semi-arid region.Atmospheric Chemistry and Physics, 12: 5391-5398.

16
Huete A, Didan K, Miura Tet al., 2002. Overview of the radiometric and biophysical performance of the MODIS vegetation indices.Remote Sensing of Environment, 83(1/2): 195-213.

17
IPCC, 2013. Working Group I Contribution to the IPCC Fifth Assessment Report Climate Change 2013: The Physical Science Basis. Stockholm, Sweden.

18
Li Jun, Shao Ming'an, Zhang Xingchang, 2004. Data base construction for the EPIC model on the Loess Plateau region. Journal of Northwest A&F University (Natural Science Edition), 32(8): 21-26. (in Chinese)

19
Li Shuangshuang, Yan Junping, Liu Xinyanet al., 2013. Response of vegetation restoration to climate change and human activities in Shaanxi-Gansu-Ningxia Region.Journal of Geographical Sciences, 23(1): 98-112.

20
Liu Changming, Zhang Dan, Liu Xiaomanget al., 2012. Spatial and temporal change in the potential evapotranspiration sensitivity to meteorological factors in China (1960-2007).Journal of Geographical Sciences, 22(1): 3-14.

21
Liu Jianxiang, Li Zhiguang, Zhang Xiaopinget al., 2013. Responses of vegetation cover to the Grain for Green Program and their driving forces in the Helong region of the middle reaches of the Yellow River.Journal of Arid Land, 5(4): 511-520.

22
Ma Enjun, Liu Anping, Li Xing, et al., 2013. Impacts of vegetation change on the regional surface climate: A scenario-based analysis of afforestation in Jiangxi province, China. Advances in Meteorology, Article ID 796163, 8 pages, 2013. doi: 10.1155/2013/796163.

23
Ma Junfei, Lu Changhe, Yu Bohua, 2009. Impacts of sloping land conversion program on the vegetation in loess hilly and gully area of Northern Shaanxi.Ecological Economy, 5(2): 160-167.

24
Mahmood R, Pielke R A, Hubbard K Get al., 2010. Impacts of land use/land cover change on climate and future research priorities.Bulletin of the American Meteorological Society, 91(1): 37-46.

25
Marlanda G, Pielke R A, Appsc Met al., 2003. The climatic impacts of land surface change and carbon management, and the implications for climate-change mitigation policy.Climate Policy, 3(2): 149-157.

26
Parta Turgay, Kahya Ercan, 2006. Trend analysis in Turkish precipitation data.Hydrological Processes, 20(9): 2011-2026.

27
Piao Shilong, Mohammat Anwar, Fang Jingyunet al., 2006. NDVI based increase in growth of temperate grasslands and its responses to climate changes in China.Global Environmental Change, 16(4): 340-348.

28
Pielke R A, Marland G, Betts Ret al., 2002. The influence of land-use change and landscape dynamics on the climate system: Relevance to climate-change policy beyond the radiative effect of greenhouse gases.Philosophical Transactions of the Royal Society, 360(1797): 1705-1719.

29
Potithep S, Nasahara N K, Muraoka Het al., 2010. What is the actual relationship between LAI and VI in a deciduous broadleaf forest. International Archives of the Photogrammetry, Remote Sensing and Spatial Information Science, Kyoto International Conference Center (ICC Kyoto), August 9-12, 2010, XXXVIII(8): 609-614.

30
Pu Zongchao, Zhang Qingshan, Wang Sehnglanet al., 2011. The spatial-temporal variation characteristic of dry-wet climate in recent 48 years in Xinjiang Province, China.Journal of Desert Research, 31(6): 1563-1572. (in Chinese)

31
Rocha Adrian V, Shaver Gaius R, 2009. Advantages of a two band EVI calculated from solar and photosynthetically active radiation fluxes. Agricultural and Forest Meteorology, 149(9): 1560-1563.

32
Sen Pranab Kumar, 1968. Estimates of the regression coefficient based on Kendall's Tau.Journal of American Statistical Association, 63(324): 1379-1389.

33
Shi Xuefeng, Xia Jiangxin, Ji Zuweng, 2007. The effect of vegetation condition on wind velocity perpendicular line distribution in the near ground. Journal of the CUN (Natural Sciences Edition), 16(1): 9-15. (in Chinese)

34
Sicard Pierre, Mangin Antoine, Hebel Pierreet al., 2010. Detection and estimation trends linked to air quality and mortality on French Riviera over the 1990-2005 period.Science of the Total Environment, 408(8): 1943-1950.

35
Wang Fei, Li Rui, Jiao Fenget al., 2005. The impact of cropland conversion on environmental effect in the Loess Plateau: A pilot study based on the national experimental bases.Journal of Geographical Sciences, 15(4): 484-490.

36
Wang Yaping, Huang Yao, Zhang Wen, 2008. Variation and tendency of surface aridity index from 1960 to 2005 in three provinces of Northeast China.Advances in Earth Science, 23(6): 619-627. (in Chinese)

37
Wu Shaohong, Yin Yunhe, Zheng Duet al., 2005. Climate changes in the Tibetan Plateau during the last three decades.Acta Geographica Sinica, 60(1): 3-11. (in Chinese)

38
Xie L N, Ma C C, Guo H Yet al., 2014. Distribution pattern of Caragana species under the influence of climate gradient in the Inner Mongolia region, China.Journal of Arid Land, 6(3): 311-323.

39
Xin Zhongbao, Yu Xinxiao, 2009. Impact of vegetation restoration on hydrological processes in the middle reaches of the Yellow River, China.Forestry Studies in China, 11(4): 209-218.

40
Xu Yong, Yang Bo, Tang Qinget al., 2011. Analysis of comprehensive benefits of transforming slope farmland to terraces on the Loess Plateau: A case study of the Yangou watershed in Northern Shaanxi Province, China.Journal of Mountain Science, 8(3): 448-475.

41
Yang Jianping, Ding Yongjian, Chen Renshenget al., 2002. The interdecadal fluctuation of dry and wet climate bourdaries in China in the recent 50 years.Acta Geographica Sinica, 57(6): 655-661. (in Chinese)

42
Yang Shanyun, Wu Rongjun, Yang Baodonget al., 2009. The spatial distribution and temporal trend of surface aridity index in recent 40 years in Hebei Province.Journal of Applied Meteorological Science, 20(6): 745-752. (in Chinese)

43
Yao Y B, Wang R Y, Yang J Het al., 2013. Changes in terrestrial surface dry and wet conditions on the Loess Plateau (China) during the last half century.Journal of Arid Land, 5(1): 15-24.

44
Yin Yunhe, Wu Shaohong, Cheng Gang, 2009. Regional difference of climate trend and abrupt climate change in China during 1961-2006.Journal of Natural Resources, 24(12): 2147-2157. (in Chinese)

45
Yin Yunhe, Wu Shaohong, Dai Erfu, 2010. Determining factors in potential evapotranspiration changes over China in the period 1971-2008.Chinese Science Bulletin, 55(29): 3329-3337.

46
Yin Yunhe, Wu Shaohong, Zheng Duet al., 2008. Radiation calibration of FAO56 Penman-Monteith model to estimate reference crop evapotranspiration in China.Agricultural Water Management, 95(1): 77-84.

47
Yue Sheng, Wang Chunyuan, 2002. Applicability of prewhitening to eliminate the influence of serial correlation on the Mann-Kendall test.Water Resources Research, 38(6): 1-4.

48
Zheng Yiqun, Qian Yongfu, Miao Manqian, 2002. The effects of the vegetation change on regional climate I: simulation results.Acta Meteorologica Sinica, 60(1): 1-16. (in Chinese)

49
Zhou Hongjian, Huang Shuling, Wang Yuanyuanet al., 2006. Multi-scales analysis of driving forces on land use/cover change in China: Taking farmland returning to forest or grassland as a case.Chinese Journal of Population, Resources and Environment, 4(3): 21-27.

50
Zhou Hongjian, Van Rompaey Anton, Wang Jing'ai, 2009. Detecting the impact of the “Grain for Green” program on the mean annual vegetation cover in the Shaanxi Province, China using SPOT-VGT NDVI data.Land Use Policy, 26(4): 954-960.

51
Zhou Zhiqiang, Li Ming, Hou Jianguoet al., 2011. Effect of different vegetation restoration modes on wind at the edge of desert.Journal of Northeast Forestry University, 39(3): 56-60. (in Chinese)

Outlines

/