
Journal of Geographical Sciences >
Spatiotemporal changes of cold surges in Inner Mongolia between 1960 and 2012
*Corresponding author: Zhu Xiufang (1982-), PhD and Associate Professor, specialized in agricultural and disaster monitoring, and interaction between land use/cover and climate change. E-mail:zhuxiufang@bnu.edu.cn
Author: Liu Xianfeng (1986-), PhD Candidate, specialized in resource and environmental remote sensing and disaster remote sensing. E-mail:liuxianfeng7987@163.com
Received date: 2014-09-25
Accepted date: 2014-10-31
Online published: 2015-03-15
Supported by
Major Project of High-resolution Earth Observation System
Copyright
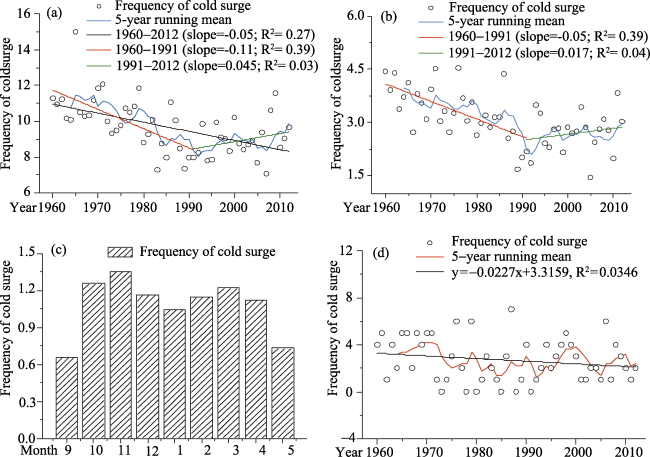
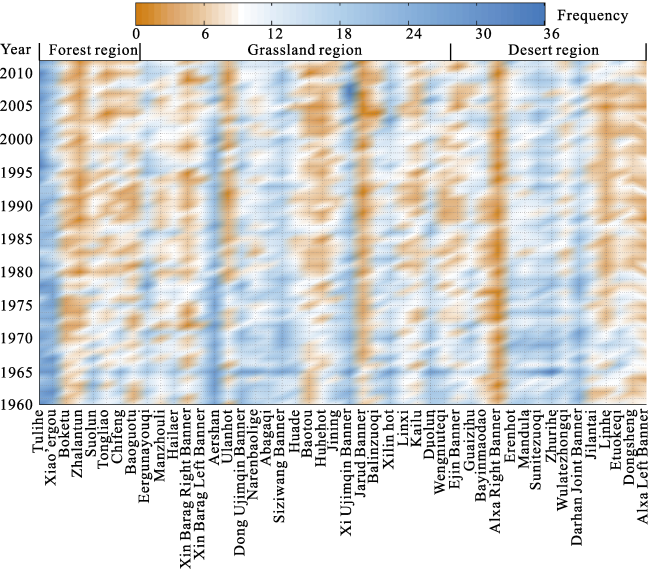
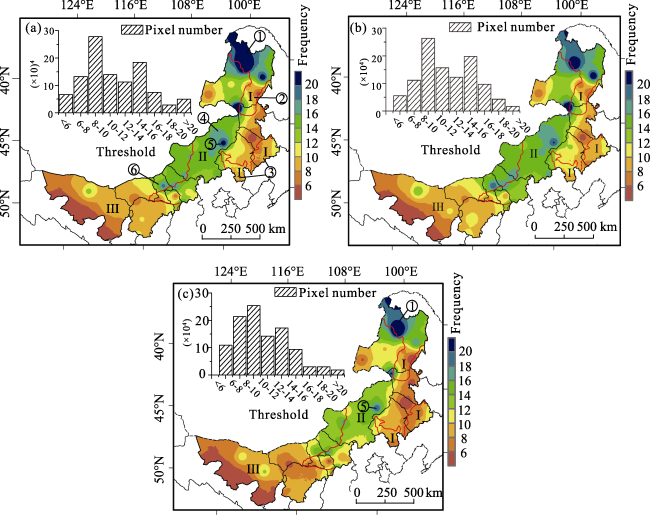
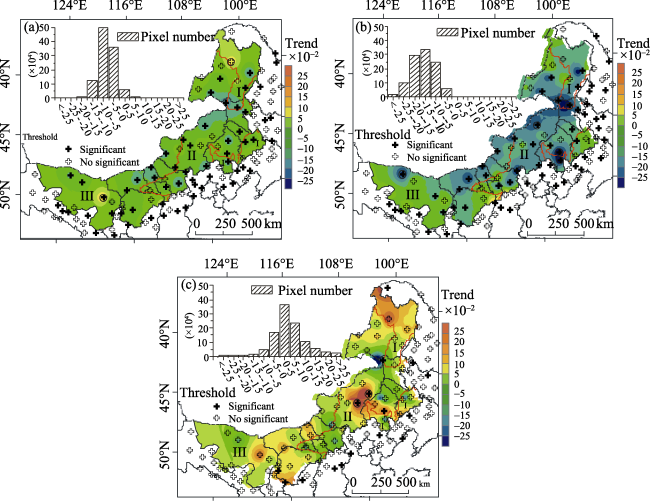
In this study, we analyzed the spatiotemporal variation of cold surges in Inner Mongolia between 1960 and 2012 and their possible driving factors using daily minimum temperature data from 121 meteorological stations in Inner Mongolia and the surrounding areas. These data were analyzed utilizing a piecewise regression model, a Sen+Mann- Kendall model, and a correlation analysis. Results demonstrated that (1) the frequency of single-station cold surges decreased in Inner Mongolia during the study period, with a linear tendency of -0.5 times/10a (-2.4 to 1.2 times/10a). Prior to 1991, a significant decreasing trend of -1.1 times/10a (-3.3 to 2.5 times/10a) was detected, while an increasing trend of 0.45 times/10a (-4.4 to 4.2 times/10a) was found after 1991. On a seasonal scale, the trend in spring cold surges was consistent with annual values, and the most obvious change in cold surges occurred during spring. Monthly cold surge frequency displayed a bimodal structure, and November witnessed the highest incidence of cold surge. (2) Spatially, the high incidence of cold surge is mainly observed in the northern and central parts of Inner Mongolia, with a higher occurrence observed in the northern than in the central part. Inter-decadal characteristic also revealed that high frequency and low frequency regions presented decreasing and increasing trends, respectively, between 1960 and 1990. High frequency regions expanded after the 1990s, and regions exhibiting high cold surge frequency were mainly distributed in Tulihe, Xiao’ergou, and Xi Ujimqin Banner. (3) On an annual scale, the cold surge was dominated by AO, NAO, CA, APVII, and CQ. However, seasonal differences in the driving forces of cold surges were detected. Winter cold surges were significantly correlated with AO, NAO, SHI, CA, TPI, APVII, CW, and IZ, indicating they were caused by multiple factors. Autumn cold surges were mainly affected by CA and IM, while spring cold surges were significantly correlated with CA and APVII.
LIU Xianfeng , ZHU Xiufang , PAN Yaozhong , ZHAO Anzhou , LI Yizhan . Spatiotemporal changes of cold surges in Inner Mongolia between 1960 and 2012[J]. Journal of Geographical Sciences, 2015 , 25(3) : 259 -273 . DOI: 10.1007/s11442-015-1166-y
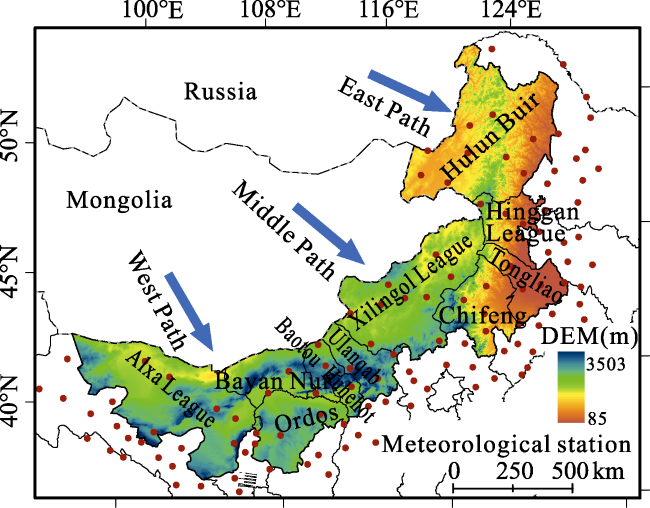
Figure 1 Study area and distribution of meteorological stations |
Figure 2 Temporal variation of cold surge frequency in Inner Mongolia from 1960 to 2012: a) The annual variation of cold surges at a single station; b) The variation of spring cold surges at a single station; c) Monthly variation of cold surges at a single station; d) Regional variation of cold surges |
Figure 3 Annual variations of cold surges at each station in Inner Mongolia from 1960 to 2012 |
Figure 4 Spatial distribution of cold surge frequency at each station in Inner Mongolia |
Figure 5 Spatial distribution of cold surge trends in Inner Mongolia from 1960 to 2012 |
Table 1 Correlation coefficients between cold surge frequency and its influencing factors |
| Factors | AO | NAO | SHI | CA | TPI | APVII | CQ | CW | IZ | IM |
|---|---|---|---|---|---|---|---|---|---|---|
| Annual | -0.41** | -0.31* | 0.13 | 0.50** | 0.11 | 0.47** | -0.34* | -0.08 | 0.22 | 0.21 |
| Autumn | -0.13 | 0.05 | 0.15 | 0.33* | -0.01 | 0.23 | -0.13 | -0.17 | 0.18 | 0.35* |
| Winter | -0.36** | -0.40** | 0.32* | 0.45** | 0.37** | 0.48** | -0.10 | -0.32* | 0.29* | 0.06 |
| Spring | -0.14 | -0.13 | 0.08 | 0.38** | 0.08 | 0.39** | -0.00 | -0.12 | 0.25 | 0.13 |
Note: * and ** indicate significance at the p < 0.05 and p < 0.01 levels, respectively. |
The authors have declared that no competing interests exist.
| 1 |
|
| 2 |
|
| 3 |
|
| 4 |
|
| 5 |
|
| 6 |
|
| 7 |
|
| 8 |
|
| 9 |
|
| 10 |
|
| 11 |
|
| 12 |
|
| 13 |
|
| 14 |
|
| 15 |
|
| 16 |
|
| 17 |
|
| 18 |
|
| 19 |
|
| 20 |
|
| 21 |
|
| 22 |
|
| 23 |
|
| 24 |
|
| 25 |
|
| 26 |
|
| 27 |
|
| 28 |
|
| 29 |
|
| 30 |
|
| 31 |
|
/
| 〈 |
|
〉 |