
Journal of Geographical Sciences >
Spatial patterns, driving forces, and urbanization effects of China’s internal migration: County-level analysis based on the 2000 and 2010 censuses
*Corresponding author: Liu Hui (1987-), PhD Candidate, specialized in environmental science, urbanization, and water management. E-mail:pkuliuh@gmail.com
Author: Liu Tao (1987-), PhD Candidate, specialized in urbanization, population migration, and urban land use in China. E-mail:liutaopku@gmail.com
Received date: 2014-06-05
Accepted date: 2014-07-10
Online published: 2015-02-15
Supported by
The New Teachers’ Scientific Research Program funded by Beijing Forestry University, No,BLX2013028
National Natural Science Foundation of China, No.41371166
Copyright
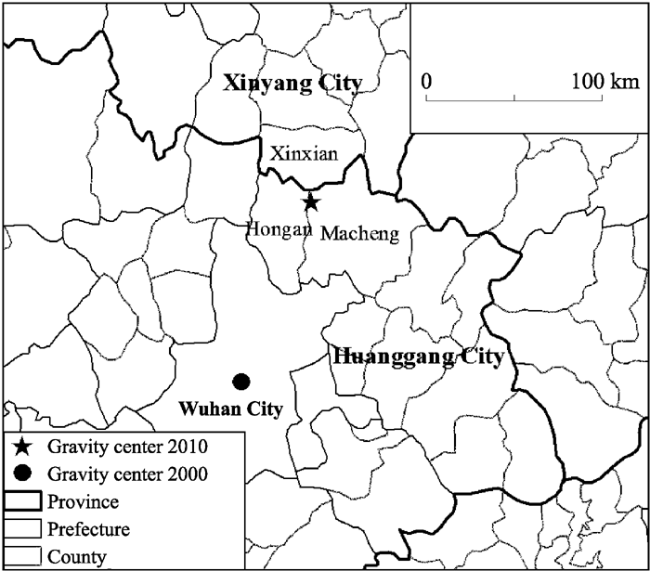
China has witnessed unprecedented urbanization over the past decades. The rapid expansion of urban population has been dominantly contributed by the floating population from rural areas, of which the spatiotemporal patterns, driving forces, and multidimensional effects are scrutinized and evaluated in this study by using the latest national censuses conducted in 2000 and 2010. Analysis based on the county-level data comes to conclusions as follows. The spatial pattern of floating population has remained stable over the first decade of the new century. The top 1% cities with the largest floating population received 45.5% of all migrants in China. As the rapid development of mega-city regions, the coastal concentration areas of floating population tended to geographically united as a whole, whereas the spatial distribution of migrants within each region varied significantly. The migrant concentration area in the Yangtze River Delta was the largest and its expansion was also the most salient. However, the floating population has growingly moved into provincial capitals and other big cities in the inland regions and its gravity center has moved northward for around 110 km during the study period. The spatial pattern of floating population has been formed jointly by the state and market forces in transitional China and the impacts of state forces have been surpassed by those of market forces in the country as a whole. The attractiveness of coastal cities and counties to the floating population comes mainly from the nonagricultural employment opportunities and public services, reflecting that long-distance and long-term migrants have moved coastward not only to gain employment but also to enjoy city life. By contrast, in the central and western regions, places with a higher economic development level and at a higher administrative level are more attractive to floating populations, demonstrating that the state remains to play an important role in allocating economic resources and promoting regional development in inland China. As the main body of new urban residents, the floating population has contributed substantially to the elevation of the urbanization levels of migrant-sending and -receiving places, by 20.0% and 49.5% respectively. Compared with extensively investigated interprovincial migrants, intra-provincial migrants have higher intention and ability to permanently live in cities and thus might become the main force of China’s urbanization in the coming decades. The internal migration has also reshaped China’s urban system in terms of its hierarchical organization and spatial structure.
Key words: floating population; migration; urbanization; urban system; megacity region; census; China
LIU Tao , QI Yuanjing , CAO Guangzhong , LIU Hui . Spatial patterns, driving forces, and urbanization effects of China’s internal migration: County-level analysis based on the 2000 and 2010 censuses[J]. Journal of Geographical Sciences, 2015 , 25(2) : 236 -256 . DOI: 10.1007/s11442-015-1165-z
 .
.
Table 1 Concentration of China’s floating population (million person, %) |
| Floating population | % | Hukou population | Floating/hukou ratio | ||
|---|---|---|---|---|---|
| 2000 | Top 10 | 27.0 | 34.1 | 50.1 | 53.8 |
| Top 23 (1%) | 35.9 | 45.5 | 93.9 | 38.3 | |
| Top 100 | 53.5 | 67.7 | 204.5 | 26.1 | |
| Nation | 79.0 | 100.0 | 1234.3 | 6.4 | |
| 2010 | Top 10 | 54.9 | 32.2 | 77.4 | 70.9 |
| Top 23 (1%) | 77.9 | 45.6 | 118.4 | 65.7 | |
| Top 100 | 120.3 | 70.6 | 235.6 | 51.1 | |
| Nation | 170.6 | 100.0 | 1345.5 | 12.7 |
Sources: National Census 2000 and 2010 |
Figure 1 The stock and increment of floating population in China’s counties |
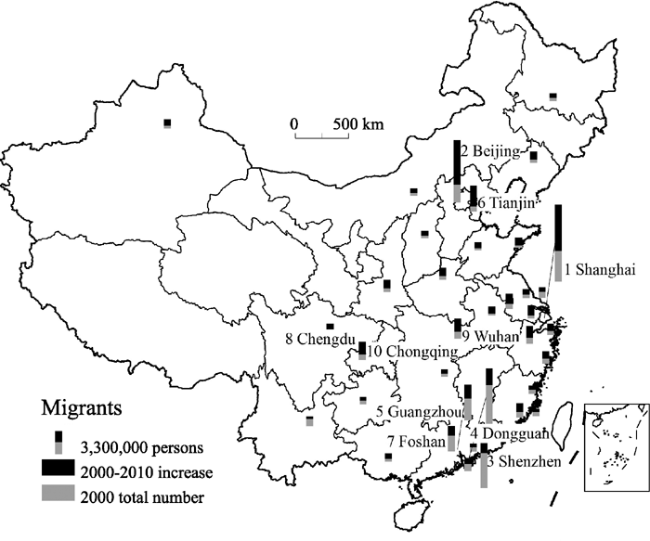
Figure 2 Cities with more than 1 million floating population in ChinaSources: National Census 2000 and 2010 (Note: The number before a city is the rank of the city in floating population) |
Table 2 Floating population by region in China |
| Eastern | Central | Western | Nation | ||
|---|---|---|---|---|---|
| Floating population (million) | 2000 | 51.10 | 12.38 | 15.53 | 79.01 |
| 2010 | 109.87 | 26.62 | 34.07 | 170.56 | |
| Growth rate (%) | 115.0 | 115.1 | 119.4 | 115.9 | |
| Share in the national total (%) | 2000 | 64.7 | 15.7 | 19.7 | 100.0 |
| 2010 | 64.4 | 15.6 | 20.0 | 100.0 | |
| Change (%) | -0.3 | -0.1 | 0.3 | 0.0 | |
| Floating/hukou ratio (%) | 2000 | 11.1 | 3.0 | 4.4 | 6.4 |
| 2010 | 22.1 | 5.8 | 8.8 | 12.7 | |
| Change (%) | 11.0 | 2.8 | 4.4 | 6.3 |
Sources: National Census 2000 and 2010 |
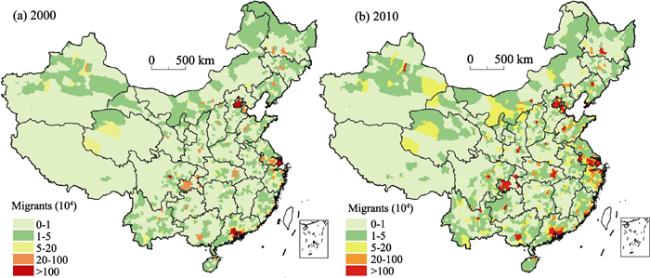
Figure 3 Spatial distribution of floating population in ChinaSources: National Census 2000 and 2010 |
Figure 4 Spatial gravity of floating population, 2000-2010 |
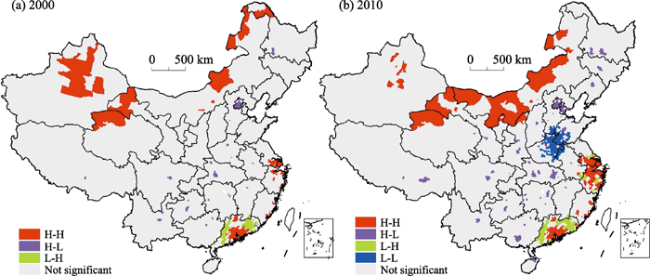
Figure 5 Spatial autocorrelation of floating population in ChinaSources: National Census 2000 and 2010 |
Table 3 Evolving spatial model of China’s floating population, 2000-2010 (million persons, %) |
| Intra-county | Inter-county/ Intra-provincial | Interprovincial | Total | ||
|---|---|---|---|---|---|
| 2000 | Floating population | 65.6 | 36.4 | 42.6 | 144.6 |
| % | 45.4 | 25.2 | 29.5 | 100.0 | |
| 2010 | Floating population | 90.9 | 84.7 | 85.8 | 261.5 |
| % | 34.8 | 32.4 | 32.8 | 100.0 | |
| 2000-2010 | Growth | 25.3 | 48.3 | 43.2 | 116.9 |
| Growth rate | 38.6 | 132.8 | 101.4 | 80.8 | |
| % change | -10.6 | 7.2 | 3.4 | 0.0 |
Table 4 Settlement intention of floating population |
| Intra-provincial | Interprovincial | Chi-square (p value) | |
|---|---|---|---|
| Intend to settle in cities (%) | 61.65 | 48.83 | 26.58(0.000) |
| Plan to buy houses in cities (%) | 29.23 | 21.54 | 13.21(0.000) |
| Plan to construct houses in villages (%) | 23.50 | 27.78 | 3.95(0.047) |
Sources: Questionnaire survey on floating population in 12 cities |
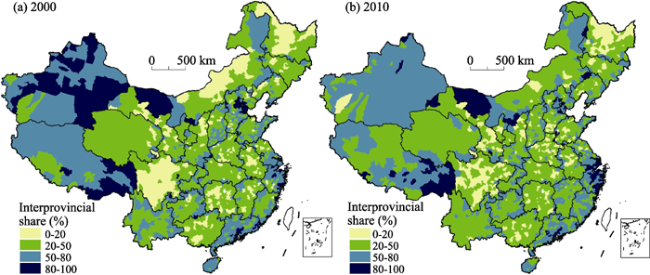
Figure 6 Proportion of interprovincial floating population in ChinaSources: National Census 2000 and 2010 |

Table 5 Definitions and key information of variables |
| Variable | Definition | No. | Mean | Std. Dev. | Min | Max |
|---|---|---|---|---|---|---|
| lnfltpop | Floating population (logarithm) | 2211 | 9.46 | 1.47 | 5.14 | 16.20 |
| lnwage | Urban average wage (logarithm) | 2211 | 10.23 | 0.24 | 8.98 | 11.18 |
| lnempna | Nonagricultural employment (logarithm) | 2211 | 11.21 | 1.14 | 7.50 | 16.29 |
| FAI | Fixed assets investment (per capita) | 2211 | 1.83 | 1.66 | 0.04 | 21.20 |
| lnpcfinex | Per capita fiscal expenditure (logarithm) | 2211 | 8.23 | 0.53 | 5.35 | 10.56 |
| capital | Province-level city or provincial capital (dummy) | 2211 | 0.01 | 0.12 | 0 | 1 |
| prefecture | Prefecture-level cities (dummy) | 2211 | 0.12 | 0.32 | 0 | 1 |
| city | County-level cities (dummy) | 2211 | 0.16 | 0.37 | 0 | 1 |
Table 6 Regression results of econometric models |
| Full sample | By region | By level | ||||||||
|---|---|---|---|---|---|---|---|---|---|---|
| Market | State | Full | Eastern | Central | Western | Prefecture^ | County∆ | |||
| lnwage | 1.784*** | 1.152*** | 0.564*** | 1.179*** | 0.492*** | 0.687*** | 1.152*** | |||
| (20.14) | (13.25) | (3.27) | (8.77) | (3.38) | (5.10) | (12.03) | ||||
| lnempna | 0.884*** | 0.766*** | 0.970*** | 0.570*** | 0.710*** | 1.031*** | 0.769*** | |||
| (53.15) | (32.48) | (22.91) | (8.43) | (18.50) | (26.96) | (28.07) | ||||
| FAI | 0.133*** | 0.038*** | -0.038 | 0.064** | 0.095*** | 0.041** | 0.036*** | |||
| (9.65) | (3.36) | (-1.54) | (2.15) | (5.63) | (2.18) | (2.86) | ||||
| lnpcfinex | 0.146*** | 0.491*** | 0.890*** | 0.516*** | 0.131** | 0.111 | 0.553*** | |||
| (3.19) | (9.94) | (10.34) | (3.73) | (2.02) | (1.31) | (10.10) | ||||
| capital | 5.280*** | 1.768*** | 0.932*** | 2.421*** | 2.171*** | 0.440*** | ||||
| (38.61) | (15.35) | (4.33) | (7.91) | (13.08) | (4.81) | |||||
| prefecture | 2.717*** | 1.042*** | 0.617*** | 1.365*** | 1.023*** | |||||
| (38.08) | (16.60) | (5.53) | (8.64) | (11.62) | ||||||
| city | 1.249*** | 0.421*** | 0.391*** | 0.312*** | 0.739*** | 0.421*** | ||||
| (19.37) | (8.41) | (4.99) | (4.03) | (7.54) | (8.20) | |||||
| _cons | -18.952*** | 7.667*** | -15.237*** | -14.567*** | -13.762*** | -4.815*** | -9.490*** | -15.779*** | ||
| (-20.79) | (20.55) | (-17.93) | (-10.81) | (-7.26) | (-2.86) | (-7.59) | (-16.08) | |||
| N | 2211 | 2211 | 2211 | 628 | 703 | 880 | 286 | 1925 | ||
| adj. R2 | 0.688 | 0.539 | 0.760 | 0.842 | 0.729 | 0.715 | 0.865 | 0.550 | ||
| F | 1514.00 | 769.66 | 1729.06 | 700.72 | 430.93 | 946.36 | 592.47 | 414.67 | ||
Note: ^ Districts of cities at the prefectural level or above; ∆county and county-level cities; t statistics in parentheses; *p< 0.1, **p< 0.05, ***p< 0.01. |
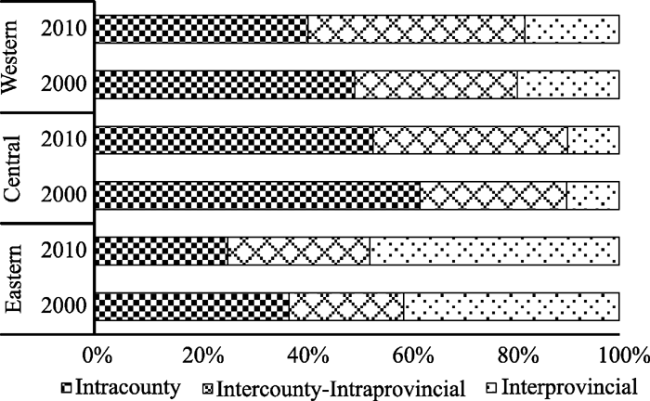
Figure 7 Structure of floating population by region in ChinaSources: National Census 2000 and 2010 |
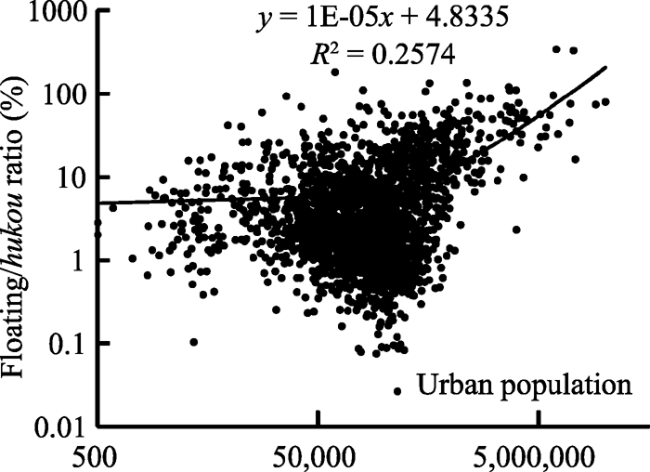
Figure 8 City size and ratio of floating population to hukou populationSources: National Census 2000 and 2010 |
The authors have declared that no competing interests exist.
| 1 |
|
| 2 |
|
| 3 |
|
| 4 |
|
| 5 |
|
| 6 |
|
| 7 |
|
| 8 |
|
| 9 |
|
| 10 |
|
| 11 |
|
| 12 |
|
| 13 |
|
| 14 |
|
| 15 |
|
| 16 |
|
| 17 |
|
| 18 |
|
| 19 |
|
| 20 |
|
| 21 |
|
| 22 |
|
| 23 |
|
| 24 |
|
| 25 |
|
| 26 |
|
| 27 |
|
| 28 |
|
| 29 |
|
| 30 |
|
| 31 |
|
| 32 |
|
| 33 |
|
| 34 |
|
| 35 |
|
| 36 |
|
| 37 |
|
| 38 |
|
| 39 |
|
| 40 |
|
/
| 〈 |
|
〉 |