
Journal of Geographical Sciences >
Application of GIS for the identification and demarcation of selective heavy metal concentrations in the urban groundwater
Received date: 2014-01-27
Accepted date: 2014-05-15
Online published: 2015-02-15
Copyright
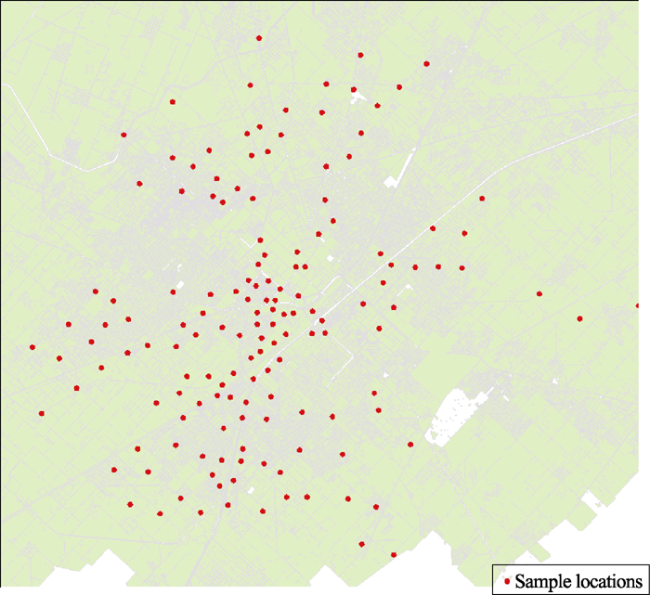
Groundwater is the most appropriate and widely used source of drinking water, which is increasingly threatened by pollution from industrial and agricultural activities. To check the severity of the problem, 156 groundwater samples were collected from various depths (60-110 ft) of 52 different localities in Faisalabad city, the third largest metropolis in Pakistan, and analyzed for the metals (Zn, Cu, Cd, Ni, Pb, Mn and Fe) concentration in 2009. Quantification was done by using Flame Atomic Absorption Spectrophotometer technique and the results were compared with WHO standards for drinking water quality. Results showed that the levels of Cu, Mn and Fe were below the WHO standards while the concentrations of Zn, Cd, Ni and Pb were above the recommended levels of safe drinking water. Correlation analysis among the occurrence of these heavy metals revealed a highly significant and positive correlation of Mn with Zn and Fe. A significant and positive correlation of Cd was also found with Cu and groundwater depth showing that there is strong association between Cu-Cd pair and that the Cd concentration varies with depth of groundwater in the study area. Regional patterns of heavy metals occurrence were mapped using Geographical Information System (GIS) for the identification and demarcation of risk areas. The concentration maps may be used by policymakers of the city to mitigate groundwater pollution.
Key words: heavy metals; groundwater contamination; Faisalabad; pollution mitigation
Sobia ASHRAF , Farhat ABBAS , Muhammad IBRAHIM , Umer RASHID , Shoaib KHALID , Hammad Raza AHMAD , Khalid Rehman HAKEEM , Tahir MAJEED . Application of GIS for the identification and demarcation of selective heavy metal concentrations in the urban groundwater[J]. Journal of Geographical Sciences, 2015 , 25(2) : 225 -235 . DOI: 10.1007/s11442-015-1164-0
Figure 1 Groundwater sampling locations shown on the street map of Faisalabad city |
Table 1 Comparison of means ± SD (standard deviation) of concentrations (ppm) for studied heavy metals at all sampling sites |
| Sr. No. | Sampling locations | Zn ± SD | Cu ± SD | Cd ± SD | Ni ± SD | Pb ± SD | Mn ± SD | Fe ± SD |
|---|---|---|---|---|---|---|---|---|
| 1 | Pathanwala | 0.239±0.32 | 0.033±0.01 | 0.017±0.01 | 0.041±0.02 | 0.03±0.02 | 0.011±0.01 | 0.016±0.01 |
| 2 | Rashid Abad | 0.322±0.36 | 0.03±0.01 | 0.011±0.01 | 0.051±0.02 | 0.029±0.02 | 0.017±0.02 | 0.031±0.02 |
| 3 | Saif Abad | 0.271±0.22 | 0.028±0.01 | 0.021±0.01 | 0.039±0.02 | 0.029±0.02 | 0.011±0.01 | 0.019±0.01 |
| 4 | Shadab Colony | 0.454±0.52 | 0.048±0.01 | 0.028±0.01 | 0.045±0.02 | 0.009±0.01 | 0.009±0.01 | 0.012±0.01 |
| 5 | Ali Housing Colony | 0.099±0.06 | 0.028±0.01 | 0.013±0.02 | 0.047±0.02 | 0.012±0.01 | 0.02±0.01 | 0.012±0.01 |
| 6 | Gulfishan Colony | 0.401±0.42 | 0.032±0.01 | 0.01±0.01 | 0.054±0.01 | 0.021±0.01 | 0.011±0.01 | 0.011±0.01 |
| 7 | Sheikh Colony | 0.078±0.05 | 0.025±0.01 | 0.017±0.02 | 0.057±0.01 | 0.036±0.01 | 0.018±0.01 | 0.019±0.01 |
| 8 | Liaquat Abad | 0.546±0.49 | 0.026±0.01 | 0.007±0.01 | 0.05±0.02 | 0.026±0.01 | 0.005±0.01 | 0.007±0.01 |
| 9 | Liaquat Town | 0.422±0.69 | 0.034±0.02 | 0.005±0.01 | 0.033±0.03 | 0.017±0.01 | 0.012±0.01 | 0.015±0.01 |
| 10 | Afghan Abad | 0.436±0.30 | 0.032±0.01 | 0.021±0.01 | 0.051±0.01 | 0.01±0.01 | 0.016±0.01 | 0.024±0.01 |
| 11 | Guru Nanak Pura | 0.139±0.15 | 0.035±0.01 | 0.016±0.02 | 0.057±0.01 | 0.024±0.01 | 0.006±0.01 | 0.019±0.01 |
| 12 | Gulberg | 0.136±0.16 | 0.024±0.01 | 0.003±0.01 | 0.038±0.01 | 0.007±0.01 | 0.006±0.01 | 0.014±0.01 |
| 13 | Jinnah Colony | 0.438±0.65 | 0.048±0.02 | 0.038±0.01 | 0.030±0.02 | 0.013±0.01 | 0.014±0.01 | 0.031±0.01 |
| 14 | GC University | 0.19±0.08 | 0.022±0.01 | 0.019±0.01 | 0.036±0.01 | 0.021±0.01 | 0.015±0.01 | 0.026±0.01 |
| 15 | UAF | 0.326±0.39 | 0.034±0.01 | 0.019±0.01 | 0.036±0.02 | 0.025±0.01 | 0.011±0.01 | 0.019±0.01 |
| 16 | Raza Abad | 0.333±0.46 | 0.052±0.01 | 0.018±0.02 | 0.053±0.01 | 0.016±0.01 | 0.008±0.01 | 0.018±0.01 |
| 17 | G.M. Abad | 0.265±0.16 | 0.035±0.02 | 0.017±0.01 | 0.061±0.01 | 0.021±0.01 | 0.014±0.01 | 0.019±0.01 |
| 18 | MarziPura | 0.098±0.11 | 0.05±0.02 | 0.019±0.01 | 0.04±0.02 | 0.022±0.01 | 0.014±0.01 | 0.016±0.01 |
| 19 | NIBGE | 0.215±0.29 | 0.033±0.01 | 0.015±0.01 | 0.05±0.01 | 0.008±0.01 | 0.016±0.01 | 0.045±0.01 |
| 20 | NIAB | 0.089±0.01 | 0.043±0.01 | 0.021±0.01 | 0.049±0.01 | 0.006±0.01 | 0.015±0.01 | 0.022±0.01 |
| 21 | AARI | 0.078±0.01 | 0.04±0.02 | 0.021±0.02 | 0.045±0.02 | 0.02±0.01 | 0.008±0.01 | 0.016±0.01 |
| 22 | Ayub Colony | 0.041±0.01 | 0.039±0.02 | 0.022±0.02 | 0.03±0.01 | 0.033±0.02 | 0.014±0.01 | 0.022±0.01 |
| 23 | Pertap Nagar | 0.02±0.01 | 0.057±0.02 | 0.032±0.01 | 0.056±0.01 | 0.022±0.01 | 0.011±0.01 | 0.019±0.01 |
| 24 | Nazim Abad | 0.125±0.15 | 0.031±0.01 | 0.025±0.02 | 0.04±0.01 | 0.013±0.01 | 0.007±0.01 | 0.028±0.01 |
| 25 | Khalid Abad | 0.172±0.02 | 0.04±0.03 | 0.028±0.02 | 0.072±0.01 | 0.03±0.02 | 0.008±0.01 | 0.018±0.01 |
| 26 | HerchernPura | 0.321±0.49 | 0.054±0.03 | 0.023±0.01 | 0.037±0.02 | 0.012±0.01 | 0.002±0.01 | 0.02±0.01 |
| 27 | SanatPura | 0.219±0.27 | 0.028±0.01 | 0.018±0.02 | 0.044±0.01 | 0.03±0.01 | 0.016±0.01 | 0.03±0.01 |
| 28 | DiglosPura | 0.092±0.02 | 0.034±0.02 | 0.02±0.01 | 0.056±0.01 | 0.036±0.02 | 0.009±0.01 | 0.024±0.02 |
| 29 | Clock Tower | 0.066±0.01 | 0.029±0.01 | 0.024±0.01 | 0.051±0.01 | 0.026±0.01 | 0.023±0.01 | 0.026±0.02 |
| 30 | Jhang Road | 0.045±0.02 | 0.023±0.02 | 0.034±0.01 | 0.049±0.01 | 0.02±0.02 | 0.005±0.01 | 0.019±0.01 |
| 31 | Jinnah Garden | 0.12±0.08 | 0.069±0.02 | 0.035±0.02 | 0.034±0.01 | 0.021±0.01 | 0.022±0.01 | 0.017±0.01 |
| 32 | DHQ | 0.494±0.63 | 0.068±0.02 | 0.017±0.01 | 0.043±0.01 | 0.025±0.02 | 0.009±0.01 | 0.022±0.01 |
| 33 | Allied Hospi- tal/PINUM | 0.673±0.48 | 0.036±0.01 | 0.012±0.01 | 0.062±0.01 | 0.032±0.02 | 0.022±0.01 | 0.033±0.01 |
| 34 | Sargodha Road | 0.252±0.21 | 0.037±0.01 | 0.021±0.01 | 0.045±0.01 | 0.038±0.02 | 0.008±0.01 | 0.034±0.01 |
| 35 | Gulistan Colony | 0.124±0.14 | 0.054±0.01 | 0.032±0.01 | 0.063±0.01 | 0.049±0.01 | 0.009±0.01 | 0.025±0.02 |
| 36 | Abdullah Pur | 0.066±0.02 | 0.03±0.01 | 0.023±0.01 | 0.047±0.01 | 0.025±0.01 | 0.007±0.01 | 0.025±0.01 |
| 37 | Canal Road | 0.054±0.01 | 0.049±0.01 | 0.016±0.01 | 0.029±0.02 | 0.013±0.01 | 0.007±0.01 | 0.034±0.02 |
| 38 | Madina Town | 0.511±0.30 | 0.038±0.02 | 0.017±0.01 | 0.035±0.01 | 0.022±0.01 | 0.007±0.01 | 0.034±0.02 |
| 39 | Officers Colony | 0.117±0.06 | 0.058±0.01 | 0.028±0.01 | 0.065±0.01 | 0.023±0.01 | 0.003±0.01 | 0.032±0.01 |
| 40 | Satiana Road | 0.196±0.17 | 0.039±0.01 | 0.026±0.01 | 0.037±0.02 | 0.047±0.02 | 0.015±0.01 | 0.043±0.03 |
| 41 | Batala Colony | 0.05±0.03 | 0.041±0.02 | 0.013±0.01 | 0.038±0.02 | 0.026±0.01 | 0.019±0.01 | 0.02±0.01 |
| 42 | Peoples Colony | 0.206±0.14 | 0.032±0.02 | 0.021±0.02 | 0.046±0.02 | 0.016±0.02 | 0.015±0.01 | 0.034±0.01 |
| 43 | D Ground | 0.054±0.02 | 0.055±0.01 | 0.03±0.01 | 0.042±0.02 | 0.009±0.01 | 0.017±0.01 | 0.033±0.01 |
| 44 | WarisPura | 0.103±0.06 | 0.02±0.01 | 0.032±0.01 | 0.056±0.02 | 0.033±0.02 | 0.01±0.01 | 0.033±0.01 |
| 45 | Jaranwala Road | 1.14±1.84 | 0.03±0.01 | 0.033±0.01 | 0.055±0.02 | 0.032±0.02 | 0.013±0.01 | 0.017±0.01 |
| 46 | Dhuddiwala | 0.328±0.22 | 0.031±0.01 | 0.009±0.01 | 0.043±0.02 | 0.056±0.01 | 0.023±0.01 | 0.032±0.01 |
| 47 | Samundari Road | 0.083±0.01 | 0.048±0.02 | 0.024±0.01 | 0.041±0.02 | 0.007±0.01 | 0.008±0.01 | 0.015±0.01 |
| 48 | Amin Abad | 0.027±0.01 | 0.036±0.01 | 0.014±0.01 | 0.054±0.01 | 0.015±0.01 | 0.009±0.01 | 0.018±0.01 |
| 49 | Mehmood Abad | 0.034±0.02 | 0.029±0.01 | 0.029±0.01 | 0.048±0.02 | 0.016±0.01 | 0.006±0.01 | 0.03±0.02 |
| 50 | Nisar Colony | 0.054±0.03 | 0.039±0.01 | 0.016±0.01 | 0.033±0.02 | 0.055±0.01 | 0.005±0.01 | 0.037±0.01 |
| 51 | Jawala Nagar | 0.042±0.02 | 0.039±0.01 | 0.017±0.01 | 0.039±0.02 | 0.027±0.03 | 0.007±0.01 | 0.025±0.01 |
| 52 | Nawabanwala | 0.248±0.30 | 0.038±0.02 | 0.019±0.01 | 0.04±0.02 | 0.032±0.02 | 0.01±0.01 | 0.031±0.01 |
| Grand total | 0.224±0.37 | 0.038±0.02 | 0.02±0.01 | 0.046±0.02 | 0.024±0.01 | 0.012±0.01 | 0.024±0.01 |
Table 2 Relationship among different heavy metals for all sampling sites (Pearson Correlation among different heavy metals) |
| Zn | Cu | Cd | Ni | Pb | Mn | Fe | |
|---|---|---|---|---|---|---|---|
| Cu | 0.038 NS P=0.634 | 1.00 | |||||
| Cd | -0.066 NS P=0.414 | 0.160* P=0.045 | 1.00 | ||||
| Ni | 0.025 NS P=0.757 | -0.014 NS P=0.865 | -0.024 NS P=0.770 | 1.00 | |||
| Pb | 0.056 NS P=0.487 | -0.091 NS P=0.257 | -0.031 NS P=0.702 | 0.044 NS P=0.582 | 1.00 | ||
| Mn | 0.207** P=0.010 | -0.110 NS P=0.173 | 0.010 NS P=0.903 | -0.071 NS P=0.382 | 0.072 NS P=0.373 | 1.00 | |
| Fe | -0.033 NS P=0.678 | -0.052 NS P=0.516 | 0.112 NS P=0.162 | -0.088 NS P=0.272 | 0.139 NS P=0.083 | 0.208** P=0.009 | |
| Depth (ft) | -0.072 NS p=0.371 | 0.084 NS p=0.297 | 0.163* p=0.043 | 0.038 NS p=0.641 | -0.010 NS p=0.906 | -0.037 NS p=0.643 | 0.093 NS p=0.251 |
*=Significant (P<0.05); **=Highly significant (P<0.01); NS=Non-significant (P>0.05) |
Table 3 Distribution of heavy metals in groundwater of Faisalabad |
| Heavy metals | Concentrations of heavy metals (ppm) | ||||
|---|---|---|---|---|---|
| Min | Max | Mean | SD | WHO Value | |
| Zn | 0.008 | 3.265 | 0.224 | ±0.374 | 3.000 |
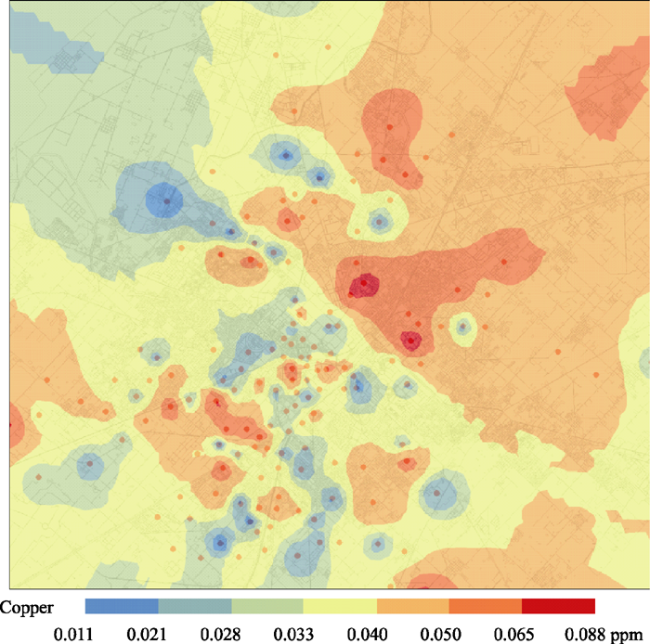
| Cu | 0.011 | 0.088 | 0.038 | ±0.015 | 2.000 |
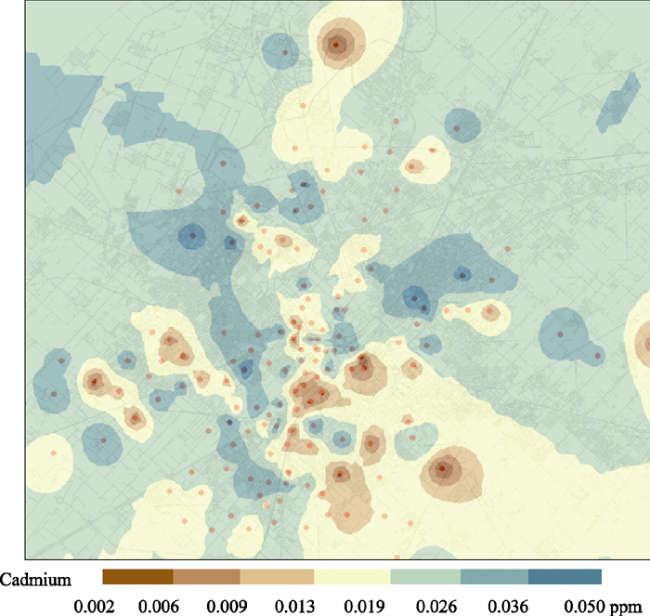
| Cd | 0.002 | 0.050 | 0.020 | ±0.012 | 0.003 |
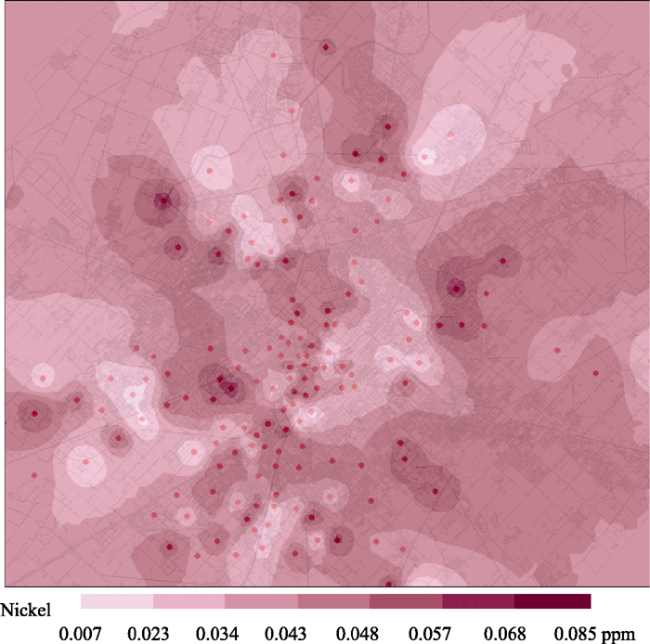
| Ni | 0.007 | 0.085 | 0.046 | ±0.017 | 0.020 |
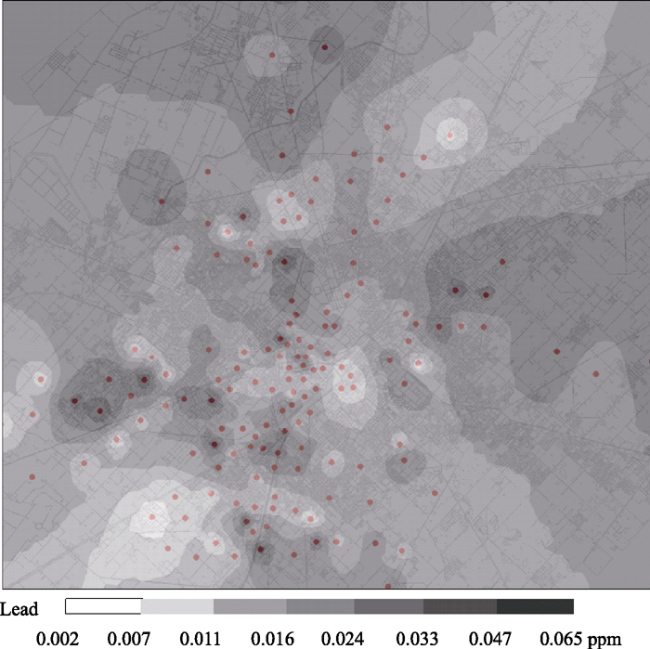
| Pb | 0.002 | 0.065 | 0.024 | ±0.014 | 0.010 |
| Mn | 0.001 | 0.033 | 0.012 | ±0.007 | 0.500 |
| Fe | 0.004 | 0.061 | 0.024 | ±0.010 | 0.300 |
SD = standard deviation |
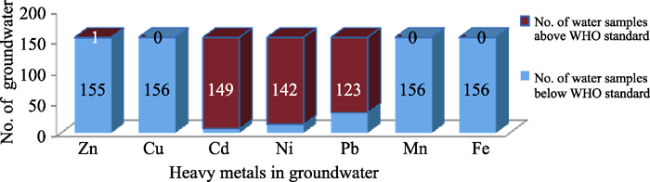
Figure 2 Number of groundwater samples above/below WHO standard |
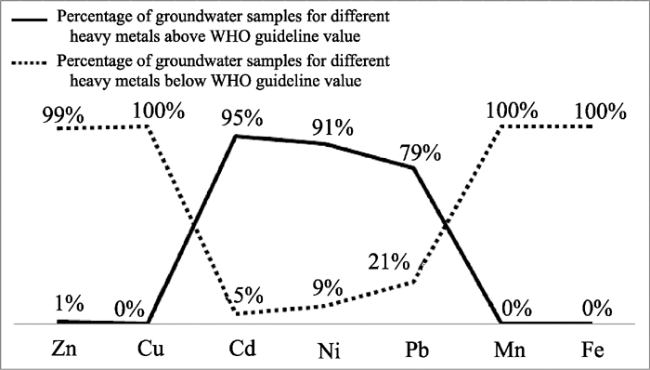
Figure 3 Percentage of groundwater samples above/below WHO guideline value |
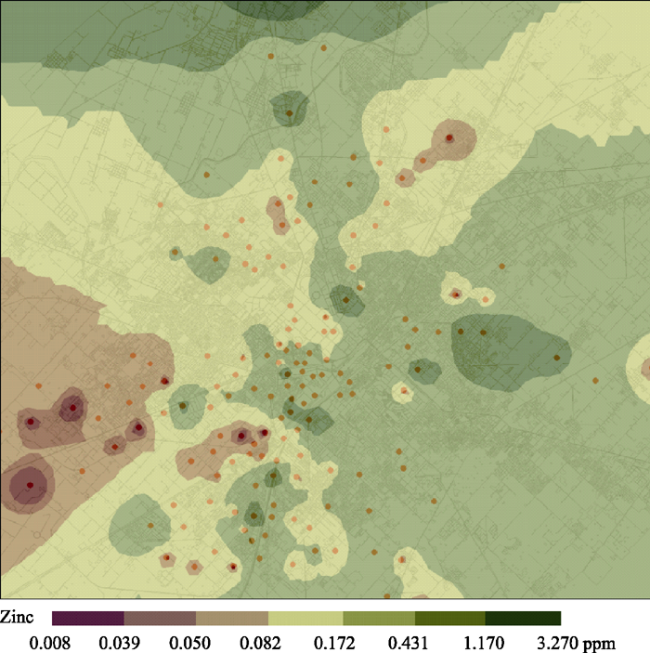
Figure 4 Zn level in groundwater of Faisalabad city in 2009 |
Figure 5 Cu level in groundwater of Faisalabad city in 2009 |
Figure 6 Cd level in groundwater of Faisalabad city in 2009 |
Figure 7 Ni level in groundwater of Faisalabad city in 2009 |
Figure 8 Pb level in groundwater of Faisalabad city in 2009 |
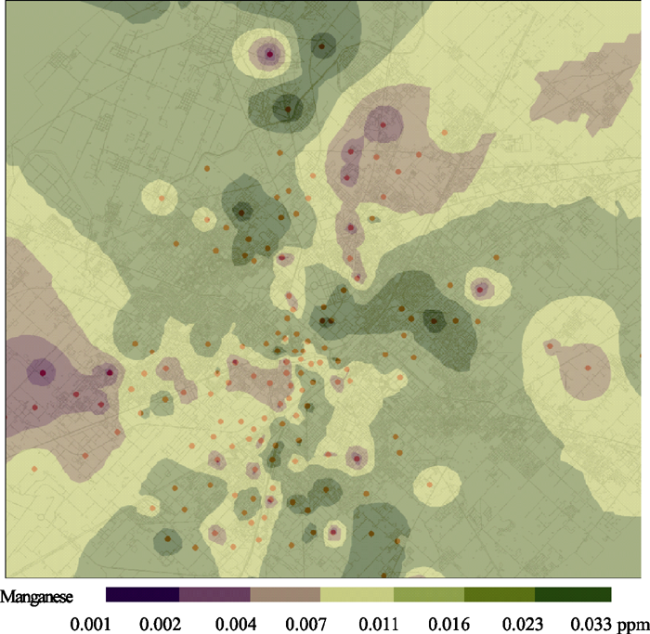
Figure 9 Mn level in groundwater of Faisalabad city in 2009 |
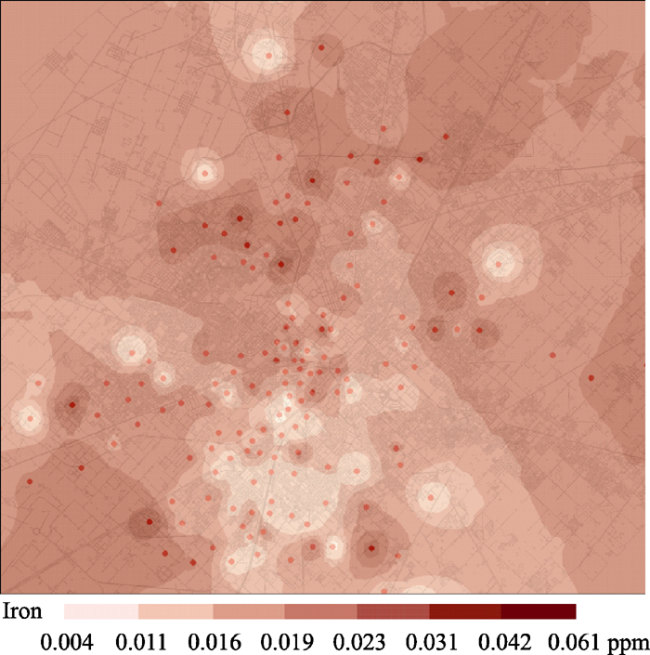
Figure 10 Fe level in groundwater of Faisalabad city in 2009 |
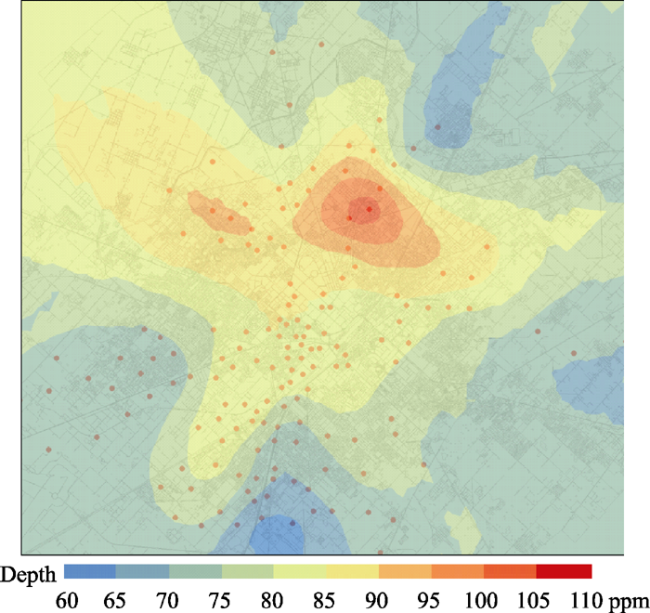
Figure 11 Depth of samples at different locations of Faisalabad city |
The authors have declared that no competing interests exist.
| 1 |
|
| 2 |
|
| 3 |
|
| 4 |
|
| 5 |
|
| 6 |
|
| 7 |
|
| 8 |
|
| 9 |
|
| 10 |
|
| 11 |
|
| 12 |
|
| 13 |
|
| 14 |
|
| 15 |
|
| 16 |
|
| 17 |
|
| 18 |
|
| 19 |
|
| 20 |
|
| 21 |
|
| 22 |
|
| 23 |
|
| 24 |
|
/
| 〈 |
|
〉 |