Orginal Article

Construction of an ecological resistance surface model and its application in urban expansion simulations

  • YE Yuyao , 1 ,
  • SU Yongxian 1 ,
  • ZHANG Hong-ou , 1, * ,
  • LIU Kai 2 ,
  • WU Qitao 1
Expand
  • 1. Guangzhou Institute of Geography, Guangzhou 510070, China
  • 2. School of Geography and Planning, Sun Yat-sen University, Guangzhou 510275, China

*Corresponding author: Zhang Hong-ou (1962-), Professor, specialized in sustainable regional development and urban planning. E-mail:

Author: Ye Yuyao (1980-), PhD and Associate Professor, specialized in sustainable regional development and urban planning. E-mail:

Received date: 2014-06-09

  Accepted date: 2014-07-02

  Online published: 2015-02-15

Supported by

National Natural Science Foundation of China, No.41001385

12th Five-year National Science Supported Planning Project, No.2012BAJ15B02

Copyright

Journal of Geographical Sciences, All Rights Reserved

Abstract

Urban expansion models are useful tools to understand urbanization process and have been given much attention. However, urban expansion is a complicated socio-economic phenomenon that is affected by complex and volatile factors involving in great uncertainties. Therefore, the accurate simulation of the urban expansion process remains challenging. In this paper, we make an attempt to solve such uncertainty through a reversal process and view urban expansion as a process wherein the urban landscape overcomes resistance from other landscapes. We developed an innovative approach derived from the minimum cumulative resistance (MCR) model that involved the introduction of a relative resistance factor for different source levels and the consideration of rigid constraints on urban expansion caused by ecological barriers. Using this approach, the urban expansion ecological resistance (UEER) model was created to describe ecological resistance surfaces suitable for simulating urban expansion and used to simulate urban expansion in Guangzhou. The study results demonstrate that the ecological resistance surface generated by the UEER model comprehensively reflects ecological resistance to urban expansion and indicates the spatial trends in urban expansion. The simulation results from the UEER-based model were more realistic and more accurately reflected ecological protection requirements than the conventional MCR-based model. These findings can enhance urban expansion simulation methods.

Cite this article

YE Yuyao , SU Yongxian , ZHANG Hong-ou , LIU Kai , WU Qitao . Construction of an ecological resistance surface model and its application in urban expansion simulations[J]. Journal of Geographical Sciences, 2015 , 25(2) : 211 -224 . DOI: 10.1007/s11442-015-1163-1

1 Introduction

Intense urbanization processes are ongoing worldwide, especially in developing countries. According to the United Nations predicts, the population of urban areas is expected to exceed 60% by 2030, with 90% of the increase occurring in low income countries, which have urban population growth rate 5 times that of developed countries (Haregeweyn et al., 2012; He et al., 2008). Although urban areas account for only a small part of the land surface of the earth, their rapid expansion has greatly changed the natural surface, which cause tremendous environmental, ecological and social influences (Berling-Wolff and Wu, 2004; Grimm et al., 2000; Haregeweyn et al., 2012; He, 2008; Lambin and Geist, 2001; Mundia and Murayama, 2010; Nagendra et al., 2004; Pickett et al., 2001; Weber and Puissant, 2003). In China, the impact of urbanization on the ecological environment is concerning. The human-land conflict is particularly prominent in China’s eastern coastal regions where intense urbanization and urban sprawl have dramatically reduced the quality and size of surrounding agricultural and ecological lands. Such expansion can interfere with or disrupt the natural ecosystem, thus posing a grave threat to ecological security in the region. The coordinated control of urban sprawl and the resolution of the conflict between urbanization and ecological conservation are urgently needed.
Urban expansion models have become a popular but complex tool used by geographers. (Costanza and Ruth, 1998; He et al., 2008; Li and Yeh, 2000; Verburg et al., 1999.). Early urban expansion models, such as Von Thünen’s theory of concentric rings of agricultural land use for a central market, Weber’s classical triangular model of industrial location, Christaller’s model of central places and Zipf’s rank-size rule, were idealized models used for purposes of spatial organization and location decision-making in economic development. However, these models were derived using the “homogeneous regions” assumption; thus, such models have limited practical applications. Since the 1970s, scholars have constructed many spatial and mathematical models, such as Markov chains (López et al., 2001), Spatial Logistic Regression (Cheng and Masser, 2003), Cellular Automata (Al-Ahmadi et al., 2009; Barredo et al., 2003; Batty and Xie, 1994; He et al., 2008; He et al., 2006; Li and Yeh, 2002; Li and Yeh, 2000; Liu et al., 2008; Stevens et al., 2007; White and Engelen, 1993; Wu, 1998), to simulate urban expansion from different perspectives. A common feature of these models is that they are dynamic models that attempted to simulate the temporal and spatial processes underlying urban expansion by establishing how such expansion interacts with various influential factors, including societal, economic, natural and policy-related factors. However, urban expansion is a complicated socio-economic phenomenon affected by complex and volatile factors involving great uncertainties; this volatility is particularly evident for human factors such as societal, economic and policy-related factors. Therefore, although the aforementioned models have continuously evolved and now have greater nuance and precision, the accurate simulation of the urban expansion process remains challenging (Li et al., 2003).
In contrast to dynamic factors that exhibit large uncertainties, environmental and ecological factors provide relatively constant constraints on urban expansion. This observation motivated us to establish an urban expansion resistance model from an ecological constraint perspective. In 1992, the minimum cumulative resistance (MCR) model was developed by the Dutch ecologist Knaapen (1992). This model was first used to study species diffusion processes; it was then widely utilized to study the conservation of species and landscape patterns and for other ecological applications (Adriaensen et al., 2003; Chardon et al., 2003; Foltête et al., 2008; Pain et al., 2000; Ray and Burgman, 2006; Ray et al., 2002; Yu, 1996). The MCR model depicts the cost or work required to pass from a “source” through landscapes with different resistances (Yu, 1996). Three factors are considered in this model: the source, distance and resistance. The basic equation for the MCR model is as follows.
where MCR is the minimum cumulative resistance, f is some unknown but monotonically decreasing function that represents the negative correlation between MCR and ecological resistance, Dij and Ri represent respectively the distances and resistance when a species travels from source j through landscape type i to a point.
Now, if urban expansion is viewed as a process wherein the urban landscape overcomes resistance from other landscapes, it can be modeled as a process resembling a species diffusion from a source to a sink. This study sought to use innovative approaches based on the MCR model to construct an ecological resistance surface model suitable for simulating urban expansion and to use the model to simulate urban expansion in Guangzhou. This paper is organized into four sections. In the first section, the introduction presents international developments in the modeling of urban expansion and outlines the basic principles underlying the MCR model. The second section proposes methodological innovations that build on the MCR model to develop an innovative ecological resistance surface model suitable for simulating urban expansion. First, an ecological resistance surface was generated to characterize resistance during urban land expansion and future spatial movement trends. Second, using the ecological resistance surface, the dynamic urban expansion process was simulated, thus facilitating spatial distribution predictions for urban land at different urban expansion scales. Finally, the simulation results generated by the conventional MCR-based model and by the proposed urban expansion ecological resistance (UEER)-based model were compared. The fourth section of the paper includes the discussion and conclusions.

2 Construction of the UEER model

Urban expansion exhibits various characteristics that differentiate this process from species diffusion. First, urban lands in different locations and at different development levels differ greatly in expansion capacity. For instance, urban land expansion is typically more rapid in city centers than in the suburbs. Therefore, different urban lands should not be regarded as the same type of source; instead, urban lands should be classified according to their expansion capacity. Second, for resistance, various protected areas such as nature reserves, forest parks, water sources and basic farmlands are rigid barriers to urban expansion and cannot be occupied but must be bypassed during urban expansion, which is a distance-independent phenomenon. Given the aforementioned considerations, we define the urban expansion ecological resistance model as follows.

2.1 Sources

The “source” is the starting point from which an object or event diffuses outward and can expand into or attract its surroundings. The ability of a source to expand or attract its surroundings is related to the “source” and surrounding media properties. In the UEER model that we constructed, the source is represented by current urban lands that can be divided into different levels based on differing expansion capacities. In general, urban lands located closer to the city center with greater population densities and development levels will exhibit a greater expansion capacity. Furthermore, regulatory policies clearly have a tremendous effect on urban land expansion; in particular, focusing on development in a new region will enhance urban land expansion capacity.

2.2 Resistance and coefficient

Because of different base surface characteristics, urban land expansion will encounter varying resistances. The resistance coefficient reflects how difficult it is for urban landscapes to control and cover other landscapes. We divide resistance into two categories: ecological barriers and ecological resistance. Ecological barriers include zones prohibited for development, such as nature reserves, forest parks, scenic locations and basic farmland. Such barriers represent rigid constraints on urban expansion with infinite resistance coefficients. We can set these coefficients sufficiently high during the assignment processes. Ecological resistance should be evaluated with considering the following six aspects of a region: its topographic gradient, vegetation cover, land cover, ecological sensitivity, ecological importance and relationship with roads. Generally, lands with steeper slopes, greater vegetation coverage, stronger ecological sensitivity, greater ecological importance and greater distances from roads are less conducive to urban expansion and therefore have greater resistance coefficients. In addition, different land cover types exhibit distinct ecological resistances.

2.3 The UEER model

We constructed a UEER model by introducing the relative resistance factor K into the MCR model to account for different levels of sources. Then, four types of factors are considered in this model: the source, source level, distance and resistance. The basic equation for this model is as follows:
where UEER represents the minimum cumulative value for ecological resistance in an urban expansion, f is an unknown but decreasing function that represents the negative correlation between UEER and ecological resistance, min indicates the minimum cumulative resistance, Dij and Ri represent respectively the distances and resistance when urban expands from source j through landscape type i to a point, and Kj indicates the relative resistance coefficient for source level j; higher-level urban lands exhibit a stronger expansion capacity and a smaller relative resistance factor. The model can be established using the cost-distance module and layer overlay function of the ArcGIS system. In particular, the following specific approach was employed. First, the urban expansion source was divided into n levels, and the cost-distance module was utilized to generate the ecological resistance surfaces associated with urban lands at various source levels. Subsequently, an overlay analysis was performed for these n ecological surfaces to calculate minimum values for each grid cell and thereby generate the resulting UEER surface.

3 Model application and results

3.1 Study area and data sources

Guangzhou, which is China’s “Southern Gateway,” is located in southern China (112°57'- 114°3' E, 22°33'-23°57' N), in the region downstream of the Pearl River Basin near the South China Sea. The topography is higher in the north and lower in the south with medium and low mountains to the northeast and central hilly basins and the Pearl River Delta alluvial plain to the south (see Figure 1). Guangzhou is in the subtropical monsoon climate zone with abundant ecological elements. It has direct jurisdiction over an administrative area that totals 7434.4 km2 and includes ten districts of Yuexiu, Haizhu, Liwan, Tianhe, Baiyun, Huangpu, Huadu, Panyu, Nansha and Luogang and two county-level cities of Conghua and Zengcheng. Since China’s reform and opening up, industrialization and urbanization has rapidly progressed in Guangzhou. In particular, the rapid expansion of urban land into numerous surrounding agricultural lands and ecological sites poses a threat to urban ecological security. Herein, Guangzhou is used as a case study, and ecological resistance surface models are utilized to study urban expansion therein. The land use and land cover information utilized in this study were primarily from data collected in the second land use survey for Guangzhou (1:10,000 scale). Additional data sources include remote sensing data for the studied area (with a 30 m resolution), digital elevation model (DEM) data, soil type vector data (1:250,000 scale), precipitation distribution vector maps (1:250,000 scale) and vector data that indicate the spatial distribution of nature reserves, forest parks, scenic locations, basic farmland and water source protection zones.
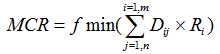
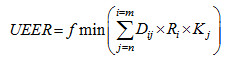
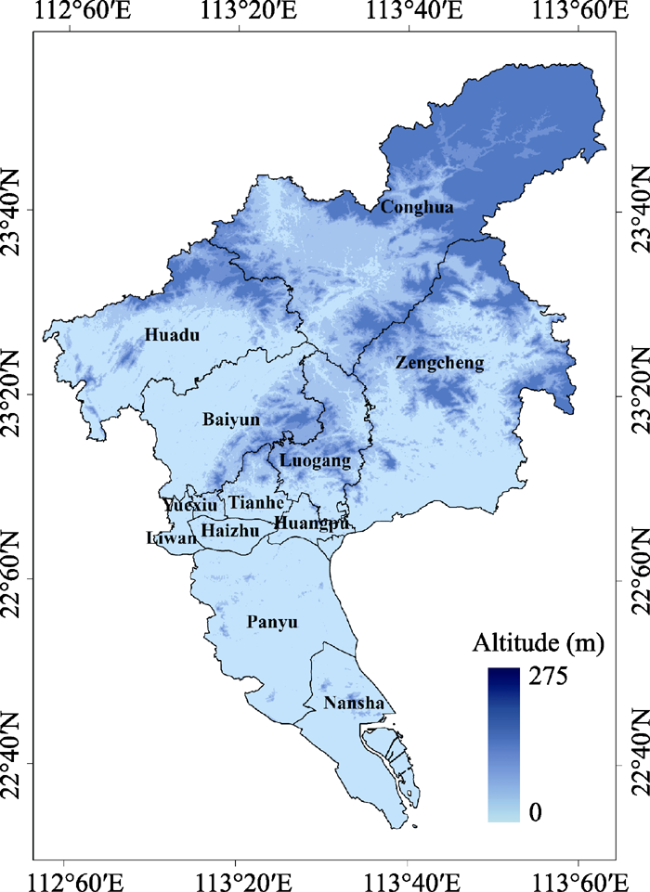
Figure 1 The study area: Guangzhou, China (2009)

3.2 The research process and results

3.2.1 Source classification
First, sources were classified by expansion capacity. Urban land expansion capacity relates to many factors, including geographical location, population density, development level and regulatory policies; therefore, it is difficult to objectively divide sources into levels. We discuss this issue further in a separate publication. This paper is more focused on constructing ecological resistance surfaces after dividing sources into levels and studying the impact from such division on the generated results. Therefore, we qualitatively divided Guangzhou's urban land into four levels based on a comprehensive consideration of various factors, including location, development intensity, population distribution, economic distribution and regulatory policies for each source area (see Table 1). The results are shown in Figure 2. In particular, the Yuexiu, Liwan, Tianhe, Haizhu, Huangpu and Panyu districts were classified as level 1 urban lands. These areas are located in central city regions and exhibit significantly greater regional development intensities, population densities and economic outputs than the other regions examined. Therefore, these areas have the greatest expansion capacity of the regions examined. Urban lands in Luogang and Nansha districts were classified as level 2 sources. These districts are important for supporting Guangzhou’s “advance east and expand south” strategy, which involves plans to develop a new scenic city in the east and a coastal city in the south; these districts have the second greatest expansion capacity of the regions examined. Urban lands in the Huadu District in the northern subcenter of Guangzhou were classified as level 3 sources. These lands have relatively low population densities and economic output levels; therefore exhibit lower expansion capacities than the urban lands in the Nansha and Luogang districts. Urban lands in the suburban counties Conghua and Zengcheng were classified as level 4 sources. These lands have low population densities and economic output levels, therefore, have the lowest expansion capacities of the regions examined. The urban land levels 1, 2, 3 and 4 have relative resistance factors (K value) of 0.85, 0.90, 0.95 and 1, respectively. This sequential increase in relative resistance factors indicates a gradual decrease in urban land expansion capacity as the source level increases.
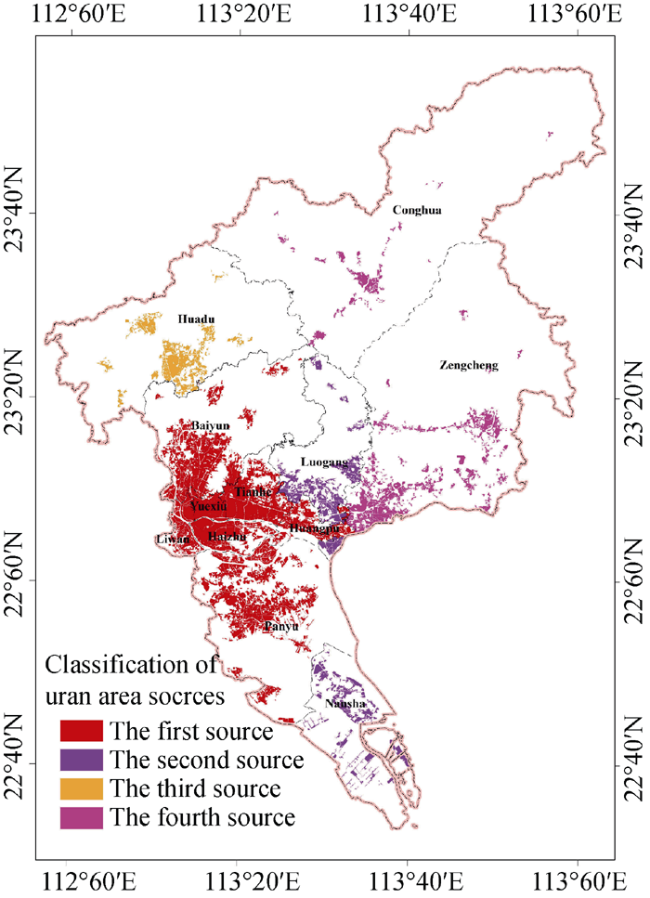
Table 1 The urban land source classification and its fundamental basis
Source level K Districts Locations Development density (%) Population density (people per km2) GDP (hundred million)
Level 1 0.85 Yuexiu, Liwan, Tianhe, Haizhu, Huangpu, Panyu Central city regions 51.40% 4874 8567.1335
Level 2 0.90 Luogang, Nansha Scenic city in the east and coastal city in the south 13.84% 704 2182.3324
Level 3 0.95 Huadu The northern
subcenter
6.95% 978 763.1871
Level 4 1.00 Conghua,
Zengcheng
Suburban counties 6.76% 456 910.786

Notes: Development intensity is defined as the proportion of the urban construction land in the total area of each district

Figure 2 Map indicating the urban land source classifications in Guangzhou
3.2.2 Comprehensive assessments for resistance
First, the ecological barriers were determined. Important water sources represented the first type of ecological barrier; this category included all rivers, reservoirs and water resource conservation areas. These barriers were primarily distributed throughout the dense water networks of the southern portion of the studied region and covered 351.20 km2. The second type of ecological barrier included nature reserves, forest parks, scenic locations and development-prohibited areas. These barriers were primarily distributed throughout the hilly terrain in the northern portion of the region and covered 1237.67 km2. The third type of ecological barrier included basic farmland conservation areas that were primarily distributed throughout Huadu, Zengcheng, Conghua, Panyu and Nansha and covered 1669.47 km2. The aforementioned areas are ecological barriers to urban expansion (Figure 3) that impose rigid constraints on urban expansion and provide the most fundamental protection to urban ecological security. We assigned values of -9999 to these regions using ArcGIS.
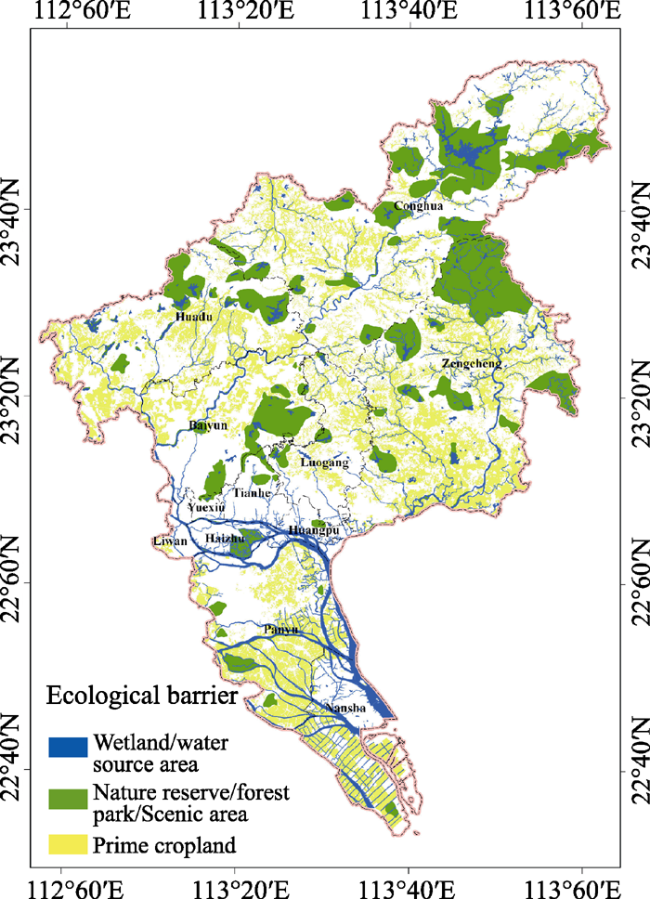
Figure 3 Distribution map of the ecological barriers in Guangzhou
We then established an ecological resistance evaluation system based on the following six factors: topographical gradient, vegetation cover, land cover, ecological sensitivity, ecological importance and relationship to roads. As indicated in Table 2, each ecological resistance factor was divided into five levels represented by the values 1, 3, 5, 7 and 9. Each factor was assigned a weight that was determined via expert scoring. Vegetation coverage was evaluated using the normalized difference vegetation index (NDVI). Ecological sensitivity evaluations accounted for prospective soil erosion, flood sensitivities and geological disasters. The ecological importance considered the protection of sources of drinking water and the conservation of soil and water resources. Although nature reserves, scenic locations, forest parks and first-level water source protection zones are also highly ecologically important, these regions were not re-evaluated in this table because they were already reserved as ecological barriers. Figure 4 shows the single-factor ecological resistance assessments results.
Finally, by combining the ecological barrier distribution and ecological importance evaluation system, we generated the overall evaluation results for the ecological resistance base surfaces in the Guangzhou region (Figure 5). These results reflect the magnitude of the combined effects on urban expansion resulting from the vertical overlaying of the ecological factors that affect each landscape unit. The distance factor was not considered in these evaluations.
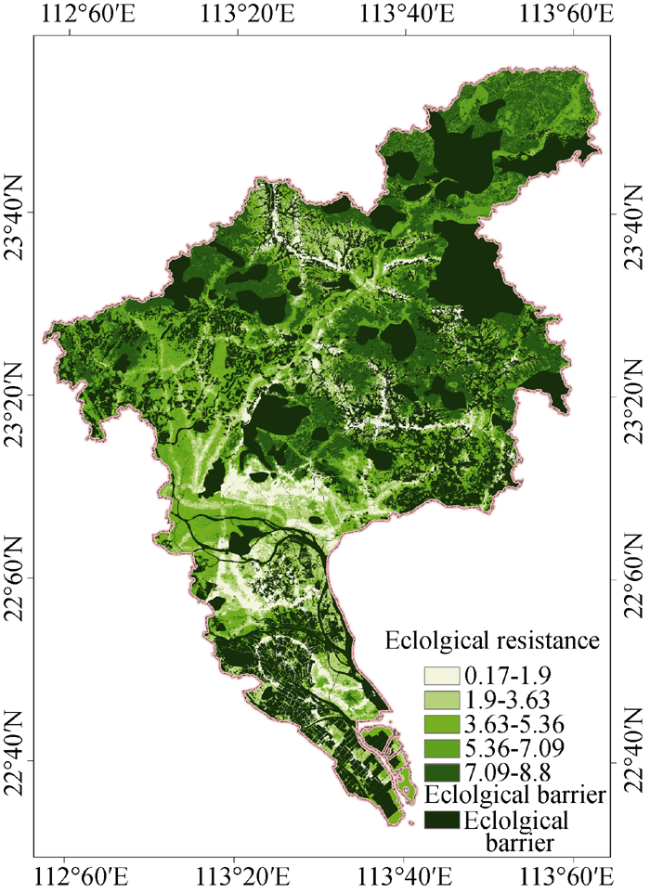
Figure 5 Results from a comprehensive evaluation of ecological resistance in the Guangzhou region
Table 2 The ecological resistance indicator evaluation system of Guangzhou
First-level factor Second-level factor Grade Assigned value Second-level weight First-level weight
Topographic slope Relative elevation <20 m 1 0.5 0.1
20-40 m 3
40-60 m 5
60-80 m 7
>80 m 9
Gradient <3 1 0.5
3-8 3
8-15 5
15-25 7
>25 9
Vegetation coverage NDVI <0.1 1 - 0.1
0.1-0.2 3
0.2-0.3 5
0.3-0.4 7
>0.4 9
Land cover Land use type Cities, designated towns, villages, barren ground 1 - 0.1
Mining land and grassland 3
Garden, drylands, paddy fields, ditches, irrigated fields and other agriculture-supporting lands 5
Ponds, inland tidal flats, port terminals 7
Woodlands, rivers, reservoirs, transportation sites, attractions and unique lands 9
Ecological sensitivity Sensitivity to soil erosion Not sensitive 1 0.3 0.2
Slightly sensitive 3
Moderately sensitive 5
Highly sensitive 7
Extremely sensitive 9
Sensitivity to geological disasters Areas without significant risk 1 0.3
Low-risk areas 3
Medium-risk areas 7
High-risk areas 9
Sensitivity to floods Level 4 flood plain (one flood per 100 years)
Level 4 flooded zone (once in 100 years)
3 0.4
Level 3 flood plain (one flood per 50 years) with a low saltwater intrusion risk 5
Level 2 flood plain (one flood per 50 years) with a medium saltwater intrusion risk
Level 2 flooded zone (once in 50 years) and area with medium risk of salty tide invasion
7
Level 1 flood plain (one flood per 50 years), with a high saltwater intrusion risk
Level 1 flooded zone (once in 50 years) and area with high risk of salty tide invasion
9
Ecological importance Importance for protecting drinking water sources Prospective water source protection zone 5 The maximum value was used 0.5
Level 2 water source protection zone 7
Level 1 water source protection zone 9
Importance for conserving soil and water resources Groundwater conservation zone 5
Surface water conservation zone 7
Importance for maintaining biodiversity Nature reserves, forest parks and scenic locations 9
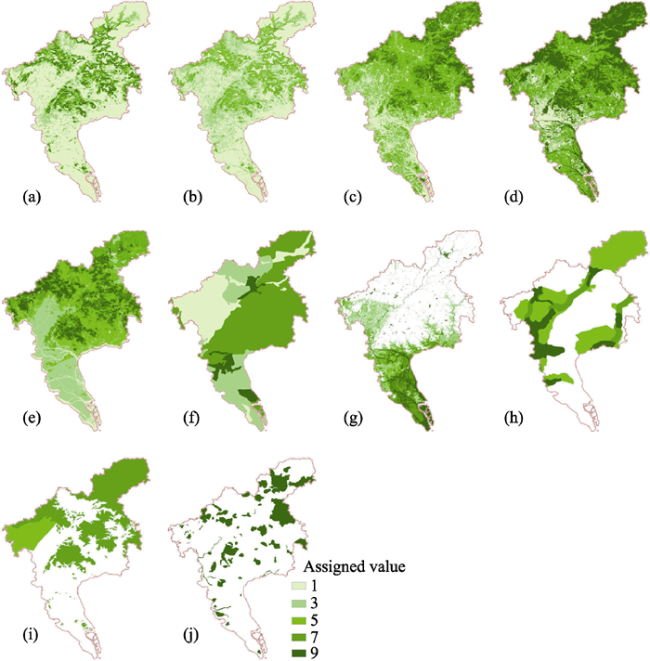
Figure 4 Single-factor ecological resistance assessments of Guangzhou

Note: (a) Relative elevation, (b) Gradient, (c)NDVI, (d) Land use type, (e) Sensitivity to soil erosion, (f) Sensitivity to geological disaster, (g) Sensitivity to floods, (h) Importance for protecting drinking, (i) Importance for conserving soil and water resources, and (j) Importance for maintaining biodiversity.

3.2.3 Construction of ecological resistance surfaces
The resistance results were further modified by incorporating the effects of the distance factor. The UEER model algorithm and Arc-GIS cost-distance module were utilized to generate the ecological resistance surfaces that correspond to sources at levels 1, 2, 3 and 4. An overlay analysis was then performed on these four ecological resistance surfaces (see Figure 6), the minimum value in each grid cell was calculated, and the resulting UEER surface was generated. This surface is depicted in Figure 7. As indicated by Figure 7, due to the distance effects, the overall resistance surface showed a continuously increasing trend outward from a source and was heavily influenced by effects from ecological factors. The resistance increased rapidly upon encountering topographical or ecological elements and abruptly shifted when ecological barriers were encountered. This surface indicates the resistance for urban expansion and can accordingly express the urban expansion spatial movement trends. Therefore, we can use it to simulate and predict urban expansion.
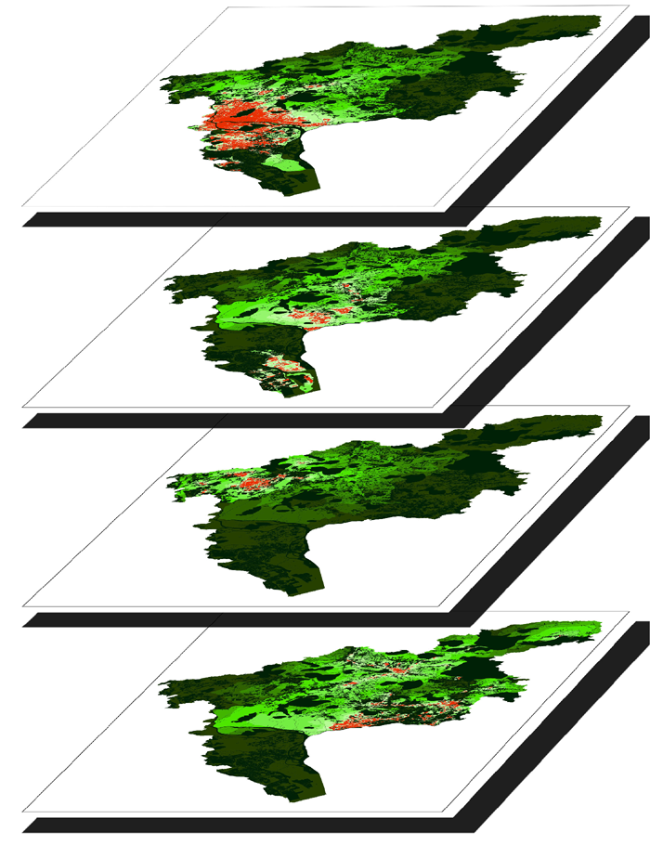
Figure 6 The ecological resistance surfaces generated by sources at various levels and overlay analyses from these surfaces
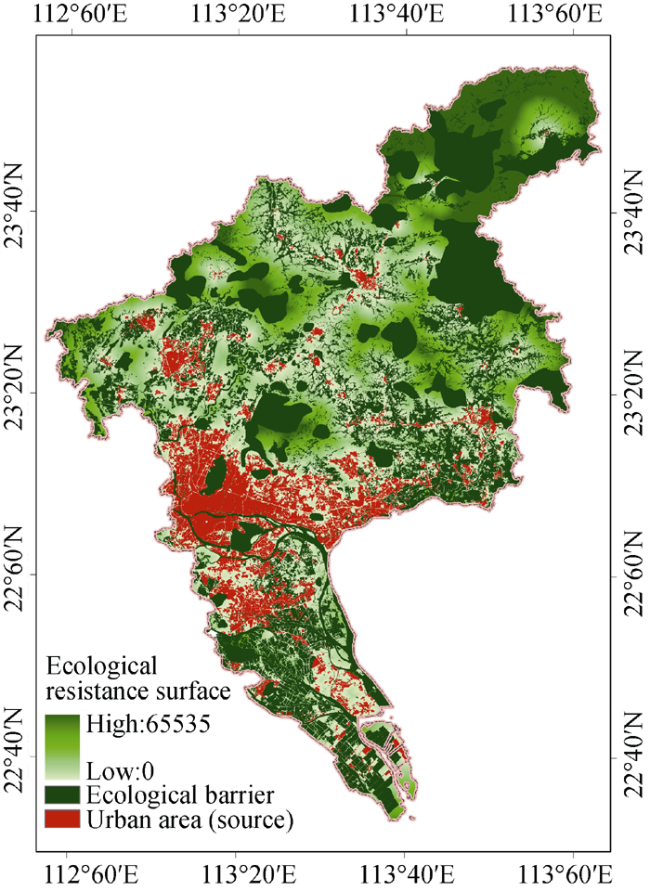
Figure 7 The ecological resistance surface for urban expansion in Guangzhou
An overlay analysis was then performed on these four ecological resistance surfaces (Figure 6), the minimum value in each grid cell was calculated, and the resulting UEER surface was generated. This surface is depicted in Figure 7. The ecological resistance surface shows the trends surrounding urban land sources that reflect the ecological resistances for urban expansion. As indicated by Figure 7, because of distance effects, the overall resistance surface tended to increase continuously outward from the source. Moreover, the overall resistance surface was heavily influenced by effects from ecological factors. The resistance increased rapidly when topographical or ecological element barriers were encountered and abruptly shifted when ecological obstacles were encountered.
3.2.4 Simulation of urban expansion
As discussed above, an ecological resistance surface reflects the ecological resistance to urban expansion and accordingly implies trends in urban expansion spatial movement. Therefore, we can use ecological resistance surfaces to simulate and predict urban expansion.
Urban construction in Guangzhou currently accounts for 852.88 km2. We simulated scenarios wherein this area increased to 1000 km2, 1500 km2 and 2000 km2. As depicted in Figure 8, the results reflect the urban land spatial distributions and boundary conditions of urban construction expansion.
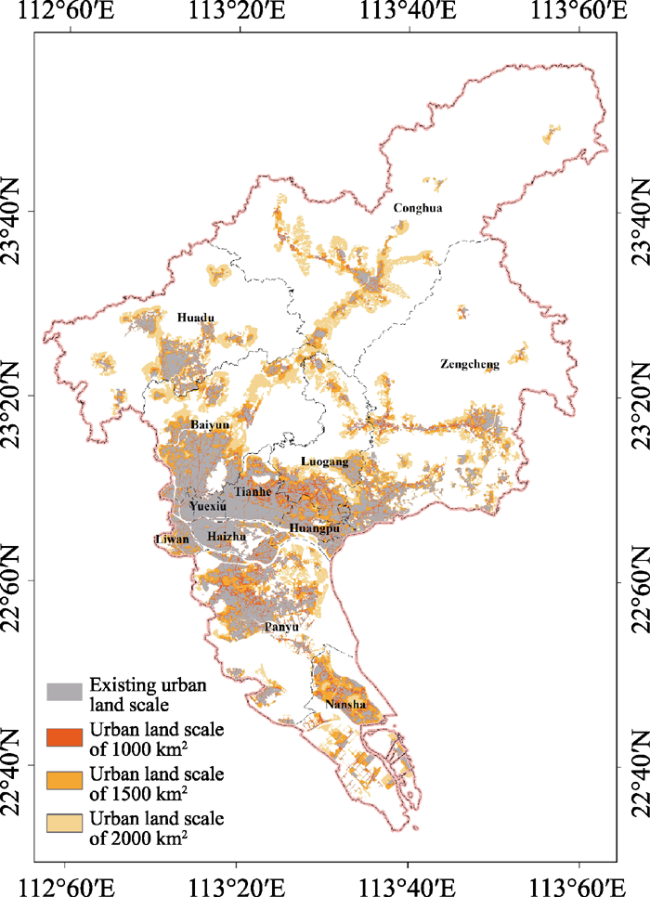
Figure 8 Simulated urban expansion in Guangzhou produced by the UEER-based model
We compared the results of these simulations with results generated by the conventional MCR model; we found that the models produced disparate results. To more clearly illustrate these differences, we compared the results from both models for certain local areas using Figures 9 and 10. Figure 9 shows the expansion simulations for urban construction lands in the Haizhu District. Figure 9a shows the simulation results generated by the conventional MCR model. This model does not consider the rigid constraints imposed by the Pearl River and Wanmu Orchard in the southern part of the region; thus, the simulated urban expansion encroached on and eroded these regions. In contrast, the simulation results from the UEER-based model (Figure 9b) are more conducive to protecting the Pearl River, the Wanmu Orchard (“Guangzhou’s Southern Lung”) and other important ecological elements. Figure 10 depicts expansion simulations for urban construction land in Zengcheng. Figure 10a shows the simulation results from the conventional MCR model, and Figure 10b provides the simulation results from the UEER-based model. Zengcheng is a suburban county of Guangzhou with a relatively weak urban expansion capacity. Because the UEER model considers source expansion capacity, the urban expansion produced by the UEER model (Figure 10b) is more restricted and had a significantly lower magnitude than the MCR model expansion results illustrated in Figure 10a. The UEER model was better able to replicate actual conditions than the MCR model. In addition, the ecological barriers produced clearly demarcated zones intercalated between urban expansion clusters in the UEER model; in particular, these barriers generated an ecological isolation that effectively prevented urban sprawl in urban lands.
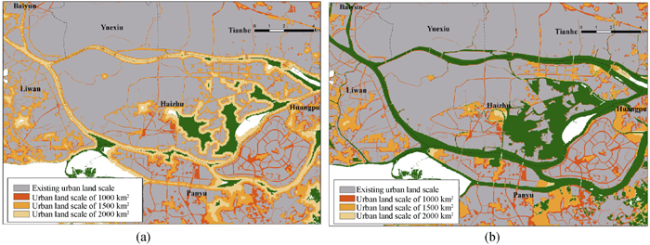
Figure 9 Comparison of urban expansion simulations in the Haizhu District (a) Results based on MCR model, and (b) Results based on UEER model
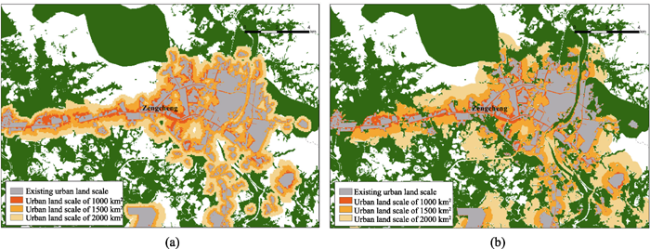
Figure 10 Comparison of urban expansion simulations in Zengcheng based on MCR model (a) and UEER model (b)

4 Conclusions

Based on the consideration of the specific urban expansion characteristics, we developed an innovative approach derived from the conventional MCR model that involved the introduction of a relative resistance factor for different source levels and the consideration of rigid constraints on urban expansion caused by ecological barriers. Using this approach, a UEER model was created to describe ecological resistance surfaces suitable for simulating urban expansion and used to simulate urban expansion in Guangzhou. The study results demonstrate that:
(1) The ecological resistance surface generated by the UEER model comprehensively reflects ecological resistance to urban expansion. It also indicates the spatial trends in urban expansion and can be used to simulate the urban land spatial distributions and boundary conditions of urban construction expansion in scenarios wherein the area increased to 1000 km2, 1500 km2 and 2000 km2.
(2) The simulation results from the UEER-based model were more realistic and more accurately reflected ecological protection requirements than the conventional MCR-based model. Because the UEER model accounted for differences in expansion capacities for different source levels, areas with weak expansion capacities showed more restricted urban expansion and significantly decreased expansion rates and magnitudes. These results were more realistic than the corresponding results generated by the MCR model. In addition, because the UEER model considered rigid constraints resulting from ecological barriers, certain important ecological elements were conserved during rapid urbanization. Moreover, incorporating ecological barriers into the model effectively prevented urban sprawl, thus generating clear clustering characteristics in the UEER urban expansion simulations.
These findings can enhance urban expansion simulation methods and compensate for the inadequacies in most models that ignore ecological constraints to a certain extent.

5 Discussion

In recent decades, urban expansion simulation has been a popular but complex topic in geographical research. Urban expansion is a complex process subject to the combined effects of various factors, including societal, economic, policy-driven, natural and ecological factors. As a result, uncertainties frequently arise during this process. Accurately simulating urban expansion is therefore a difficult task. The essential feature of the UEER model involves solving such uncertainty through a reversal process. This model generated promising results by comprehensively evaluating ecological resistance and constructing the ecological resistance surface for urban expansion; this surface was then utilized to predict trends in spatial movement for urban expansion under ecological constraints.
However, certain components of this model should be further examined with in-depth studies; in particular, the classification of sources should be undertaken in a more scientific manner so that the expansion capacities for these sources are objectively illustrated. In addition, the geographical significance and applicability of ecological resistance surfaces should be further explored. For example, such surfaces could be used to assess the ecological suitability of urban land zoning processes. In addition, the likely functions of such surfaces could be investigated for purposes of managing and controlling urban expansion, such as controlling of expansion boundaries, urban sprawl and strategic points.

The authors have declared that no competing interests exist.

1
Adriaensen F, Chardon J P, De Blust Get al., 2003. The application of ‘least-cost’ modelling as a functional landscape model.Landscape and Urban Planning, 64: 233-247.

2
Al-Ahmadi K, See L, Heppenstall Aet al., 2009. Calibration of a fuzzy cellular automata model of urban dynamics in Saudi Arabia.Ecological Complexity, 6: 80-101.

3
Barredo J I, Kasanko M, McCormick Net al., 2003. Modelling dynamic spatial processes: Simulation of urban future scenarios through cellular automata.Landscape and Urban Planning, 64: 145-160.

4
Berling-Wolff S, Wu J, 2004. Modeling urban landscape dynamics: A case study in Phoenix, USA.Urban Ecosystems, 7(3): 215-240.

5
Chardon J P, Adriaensen F, Matthysen E, 2003. Incorporating landscape elements into a connectivity measure: A case study of speckled wood butterfly. Landscape Ecology, 18: 561-573.

6
Cheng J, Masser I, 2003. Modelling urban growth patterns: A multiscale perspective.Environment and Planning A, 35: 679-704.

7
Costanza R, Ruth M, 1998. Using dynamic modeling to scope environmental problems and build consensus.Environmental Management, 22: 183-195.

8
Couclelis H, 1987. Cellular dynamics: How individual decisions lead to global urban change.European Journal of Operational Research, 30(3): 344-346.

9
Clarke K C, Hoppen S, Gaydos L, 1997. A self-modifying cellular automaton model of historical urbanization in the San Francisco Bay area. Environment and Planning B: Planning and Design, 24: 247-261.

10
Foltête J C, Berthier K, Cosson J F, 2008. Cost distance defined by a topological function of landscape.Ecological Modelling, 210(1/2): 104-114.

11
Grimm N B, Grove J M, Pickett S T Aet al., 2000. Integrated approaches to long-term studies of urban ecological systems.BioScience, 50(7): 571-584.

12
Haregeweyn N, Fikadu G, Tsunekawa Aet al., 2012. The dynamics of urban expansion and its impacts on land use/land cover change and small-scale farmers living near the urban fringe: A case study of Bahir Dar, Ethiopia.Landscape and Urban Planning, 106(2): 149-157.

13
He C, Okada N, Zhang Qet al., 2006. Modeling urban expansion scenarios by coupling cellular automata model and system dynamic model in Beijing, China.Applied Geography, 26: 323-345.

14
He C, Okada N, Zhang Qet al., 2008. Modelling dynamic urban expansion processes incorporating a potential model with cellular automata.Landscape and Urban Planning, 86: 79-91.

15
Knaapen J P, Scheffer M, Harms B, 1992. Estimating hatitat isolation in landscape planning.Landscape and Urban Planning, 23: 1016.

16
Lambin E, Geist J, 2001. Global land use and land cover change: What have we learned so far?Global Change News Letter, 46: 27-30.

17
Li L, Sato Y, Zhu H, 2003. Simulating spatial urban expansion based on a physical process.Landscape and Urban Planning, 64: 67-76.

18
Li X, Yeh A G O, 2000. Modelling sustainable urban development by the integration of constrained cellular automata and GIS.International Journal of Geographical Information Science, 14: 131-152.

19
Li X, Yeh A G O, 2002. Neural-network-based cellular automata for simulating multiple land use changes using GIS.International Journal of Geographical Information Science, 16: 323-343.

20
Liu X, Li X, Shi Xet al., 2008. Simulating complex urban development using kernel-based non-linear cellular automata.Ecological Modelling, 211: 169-181.

21
López E, Bocco G, Mendoza Met al., 2001. Predicting land-cover and land use change in the urban fringe: A case in Morelia city, Mexico.Landscape and Urban Planning, 55: 271-285.

22
Mundia C N, Murayama Y, 2010. Modeling spatial processes of urban growth in African cities: A case study of Nairobi City.Urban Geography, 31(2): 259-272.

23
Nagendra H, Munroe D K, Southworth Jet al., 2004. From pattern to process: Landscape fragmentation and the analysis of land use/land cover change.Agriculture, Ecosystems and Environment, 101: 111-115.

24
Pain G, Baudry J, Burel Fet al., 2000. Land Pop: Un outil d’étude de la structure spatiale des populations animals fragmentées.Revue Internationale de Géomatique, 10: 89-106.

25
Pickett S T A, Cadenasso M L, Grove J Met al., 2001. Urban ecological systems: Linking terrestrial ecological, physical, and socioeconomic components of metropolitan areas.Annual Review of Ecology and Systematics, 32: 127-157.

26
Ray N, Burgman M A, 2006. Subjective uncertainties in habitat suitability maps.Ecological Modelling, 195: 172-186.

27
Ray N, Lehmann A, Joly P, 2002. Modeling spatial distribution of amphibian populations: A GIS approach based on habitat matrix permeability.Biodivers. Conserv., 11: 2143-2165.

28
Stevens D, Dragicevic S, Rothley K, 2007. iCity: A GIS-CA modelling tool for urban planning and decisionmaking.Environmental Modelling & Software, 22: 761-773.

29
Verburg P H, de Koning G H J, Kok Ket al., 1999a. A spatial explicit allocation procedure for modelling the pattern of land use change based upon actual land use.Ecological Modelling, 116: 45-61.

30
Verburg P H, Schot P, Dijst Met al., 2004. Land use change modelling: Current practice and research priorities.GeoJournal, 61(4): 309-324.

31
Verburg P H, Veldkamp A, Fresco L O, 1999b. Simulation of changes in the spatial pattern of land use in China.Applied Geography, 19: 211-233.

32
Weber C, Puissant A, 2003. Urbanization pressure and modeling of urban growth: Example of the Tunis Metropolitan Area.Remote Sensing of Environment, 86: 341-352.

33
Weddell P, 2002. Urbanism: Modeling urban development for land use, transportation, and environment planning.Journal of American Planning Association, 68(3): 297-313.

34
White R, Engelen G, 1993. Cellular automata and fractal urban form: A cellular modelling approach to the evolution of urban land-use patterns.Environment and Planning A, 25: 1175-199.

35
Wu F, Webster C J, 1998. Simulation of land development through the integration of cellular automata and multicriteria evaluation. Environment and Planning B: Planning and Design, 25: 103-126.

36
Yu K J, 1996. Security patterns and surface model in landscape ecological planning. Landscape and Urban Planning, 36: l-17.

Outlines

/