Orginal Article

Evaluating the suitability of TRMM satellite rainfall data for hydrological simulation using a distributed hydrological model in the Weihe River catchment in China

  • ZHAO Haigen , 1, 2, 3 ,
  • YANG Shengtian , 1, 2, * ,
  • WANG Zhiwei 1, 2 ,
  • ZHOU Xu 1, 2 ,
  • LUO Ya 1, 2 ,
  • WU Linna 1, 2
Expand
  • 1. State Key Laboratory of Remote Sensing Science, Jointly Sponsored by Beijing Normal University and the Institute of Remote Sensing Applications of Chinese Academy of Sciences, Beijing 100875, China
  • 2. Research Center for Remote Sensing and GIS, Beijing Key Laboratory for Remote Sensing of Environment and Digital Cities, School of Geography, Beijing Normal University, Beijing100875, China
  • 3. South China Institute of Environmental Sciences, MEP, Guangzhou 510655, China

*Corresponding author: Yang Shengtian (1965-), Professor, E-mail:

Author: Zhao Haigen (1983-), PhD Candidate, specialized in hydrological simulation and remote sensing. E-mail:

Received date: 2014-01-21

  Accepted date: 2014-06-12

  Online published: 2015-02-15

Supported by

National Key Technology P&D Program, No.2012BAB02B00

The Fundamental Research Funds for the Central Universities

Copyright

Journal of Geographical Sciences, All Rights Reserved

Abstract

The objective of this study is to quantitatively evaluate Tropical Rainfall Measuring Mission (TRMM) data with rain gauge data and further to use this TRMM data to drive a Distributed Time-Variant Gain Model (DTVGM) to perform hydrological simulations in the semi-humid Weihe River catchment in China. Before the simulations, a comparison with a 10-year (2001-2010) daily rain gauge data set reveals that, at daily time step, TRMM rainfall data are better at capturing rain occurrence and mean values than rainfall extremes. On a monthly time scale, good linear relationships between TRMM and rain gauge rainfall data are found, with determination coefficients R2 varying between 0.78 and 0.89 for the individual stations. Subsequent simulation results of seven years (2001-2007) of data on daily hydrological processes confirm that the DTVGM when calibrated by rain gauge data performs better than when calibrated by TRMM data, but the performance of the simulation driven by TRMM data is better than that driven by gauge data on a monthly time scale. The results thus suggest that TRMM rainfall data are more suitable for monthly streamflow simulation in the study area, and that, when the effects of recalibration and the results for water balance components are also taken into account, the TRMM 3B42-V7 product has the potential to perform well in similar basins.

Cite this article

ZHAO Haigen , YANG Shengtian , WANG Zhiwei , ZHOU Xu , LUO Ya , WU Linna . Evaluating the suitability of TRMM satellite rainfall data for hydrological simulation using a distributed hydrological model in the Weihe River catchment in China[J]. Journal of Geographical Sciences, 2015 , 25(2) : 177 -195 . DOI: 10.1007/s11442-015-1161-3

1 Introduction

Precipitation and streamflow are two important components in the hydrological cycle. Accurate streamflow simulation is very important in the prediction of floods, in hydraulic engineering and construction, and in water resource management. With the development of computer technology, distributed hydrological models have come to play an increasingly important role in research into hydrological processes and in addressing water resource issues. Such models can convey the spatial heterogeneity of runoff, provide detailed descriptions of hydrological processes and assess the impact of nature- and human-induced changes on water resources in watersheds (Li et al., 2012).
Precipitation is the most important spatial input for distributed hydrological models, so accurate estimates of rainfall over a catchment or a region are critical (Gourley and Vieux, 2006). Unfortunately, precipitation is also one of the most difficult atmospheric fields to measure, because of the limitations of surface-based observational networks and the large inherent variations in rainfall fields themselves. Conventional approaches to obtaining spatial rainfall data include spatial interpolation and geostatistical methods, such as kriging, inverse distance weighting (IDW) and the Thiessen polygon (Kurtzman et al., 2009; Guillermo et al., 1985). The accuracy of these methods depends strongly on the number and density of rainfall stations. However, in many remote parts of the world and in areas with complex terrain, rainfall stations are either sparse or nonexistent. This phenomenon is particularly common in developing countries and reduces the accuracy of runoff simulations.
To address this, a number of remotely sensed precipitation products with high spatial and temporal resolution have been developed in recent years (Sorooshian et al., 2000; Kidd et al., 2003; Joyce et al., 2004). These products provide a potential alternative source of forcing data for hydrological models in regions where conventional rain gauge precipitation measurements are not readily available, but they also pose new challenges for hydrologists in applying the remotely sensed information for hydrological studies. Satellite data exhibit biases and random errors, however, which are caused by various factors such as sampling frequency and uncertainties in rainfall retrieval algorithms (Nair et al., 2009). It is therefore essential to validate the satellite precipitation products with conventional rain gauge data before using those satellite products (Nair et al., 2009).
The Tropical Rainfall Measuring Mission (TRMM) launched in 1997 has the objective of studying and monitoring tropical rainfall (Kummerow et al., 2000; Rozante et al., 2010). It provides precipitation products with high temporal (3 h) and spatial (25 km × 25 km) resolution, covering the globe between the latitude band of 50°NS. The satellite is in a 46-day processing orbit with a period of about 91.5 min. The mission takes advantage of the rich constellation of microwave and infrared sensors on board the TRMM satellite as well as other satellites, along with available rain gauge data over land (Huffman et al., 2007). The less frequent, polar-orbiting passive microwave (90°NS) and high-frequency, geostationary infrared (global coverage) precipitation estimates from the other satellites are ultimately benchmarked by the inclined orbit (36°NS) of the TRMM satellite. TRMM was designed to address some important errors in microwave retrievals, such as beam-filling errors (Chiu et al., 1990) and diurnal bias (Shin and North, 2000). Three-dimensional precipitation information can be obtained from the TRMM microwave radiometer (TMI) and the precipitation radar (PR) on board the TRMM satellite, which makes it the first choice among a variety of space-borne sensors.
In recent years, TRMM data have been validated and used widely in hydrological applications in low and mid latitudes (Narayanan et al., 2005; Rahman and Sengupta, 2007; Su et al., 2008; Stisen and Sandholt, 2010; Yu et al., 2011; Yong et al., 2012; Bitew et al., 2011; Jiang et al., 2012; Zeng et al, 2012; Xue et al., 2013). Rahman and Sengupta (2007) validated the precipitation products, including the Global Precipitation Climate Project (GPCP), 3B42-V5 and 3B42-V6, with the India Meteorological Department (IMD) gridded daily rainfall at a grid resolution of 1° × 1°. Their results showed that the spatial patterns of 3B42-V6 data had the closest agreement with observed patterns of IMD gauge data, except over certain areas. Su et al. (2008) used rain gauge data to evaluate TRMM 3B42-V6 data and run the Variable Infiltration Capacity (VIC) hydrology model with TRMM data in the La Plata basin. A comparison of the hydrological model simulation with conventional rain gauge data showed that the VIC model with TRMM data overestimated peak flows while representing low flows satisfactorily. Xue et al. (2013) explored the improvements and error propagation of the latest 3B42-V7 algorithm compared with its predecessor, 3B42-V6, using the Coupled Routing and Excess Storage (CREST) hydrological model in the mountainous Wangchu Basin of Bhutan. This latest 3B42-V7 algorithm represents a significant upgrade from 3B42-V6, both in precipitation accuracy (i.e., correcting underestimation) and in potential hydrological utility. However, most of the applications have been at sub-continental or regional scales; fewer studies have dealt with the comparison between TRMM rainfall and rain gauge data at a catchment scale, and most studies have focused on areas at low latitude. There has been no extensive statistical and hydrological validation of TRMM data (especially the latest TRMM 3B42-V7 data) in semi-humid East Asian regions.
The aim of this study is therefore to evaluate the suitability of the latest TRMM 3B42-V7 rainfall data using the Distributed Time-Variant Gain Model (DTVGM) (Xia, 2002, 2005) in the Weihe River catchment of China. More specifically, this study is designed to (1) evaluate the accuracy of daily TRMM rainfall derived from TRMM 3B42-V7 with rain gauge data at the Weihe River catchment located in the midstream of the Yellow River in China and (2) cross-compare the performance of the TRMM and rain gauge data in driving the DTVGM in the simulation of daily and monthly hydrological processes.
The paper is organized as follows. In Section 2, the details of the study area and data used in the study are described. In Section 3, the DTVGM is briefly introduced. Major results are presented and discussed in Section 4, and conclusions in Section 5.

2 Study area and data preparation

The Weihe River catchment (33°42′-36°12′N and 103°57′-110°17′E) is located in the midstream of the Yellow River basin and has an important influence on agricultural production and flood protection downstream in the Yellow River basin (Figure 1). The catchment covers about 61,400 km2 and has a semi-humid East Asian climate characterized by an annual precipitation of 400-800 mm. The temporal distribution of precipitation is uneven, with about 80% of precipitation occurring from July to September in the form of storms. Annual evapotranspiration is about 700-1200 mm and annual mean temperatures in the catchment range from 7.8°C to 13.5°C (Liu and Hu, 2006). The elevation ranges from 305 to 3694 m above sea level. The topography varies from high mountainous and hilly areas to alluvial plains in the lower reaches of the primary watercourses. It is possible that snowmelt contributes to a portion of the streamflow, but most of it is driven by the summer monsoon rains. Therefore, neither the precipitation products nor the model used in the study deal explicitly with frozen precipitation.
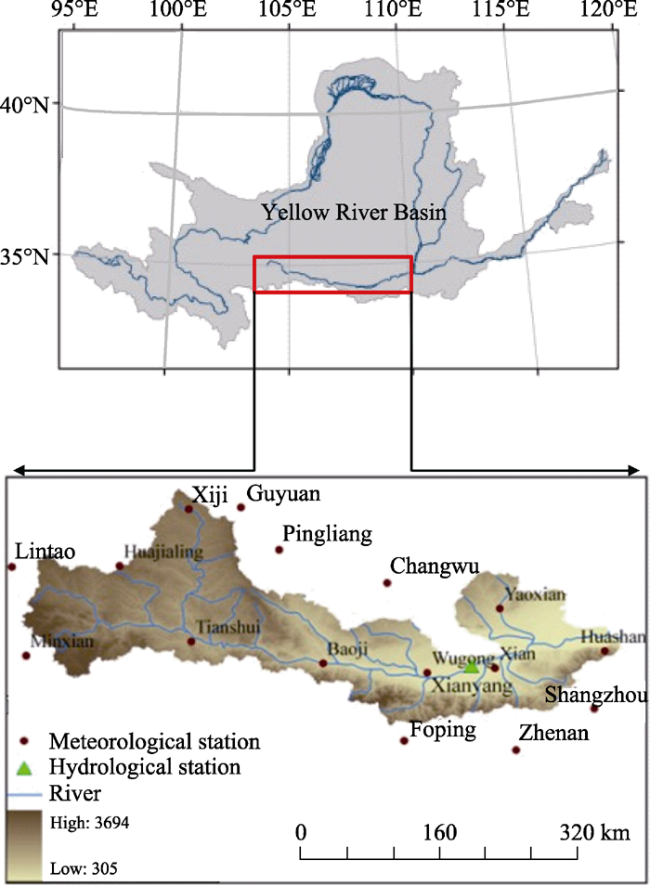
Figure 1 Location of the Weihe River catchment in the Yellow River Basin and the distribution of stations
Based on Digital Elevation Model (DEM) data with a resolution of 90 m, the river network and physical boundaries of the catchment were delineated with ArcGIS software. The land cover data were obtained from the MCD12Q1 product of the Moderate Resolution Imaging Spectroradiometer (MODIS) in 2005. The final land use map (Figure 2) was reclassified into six types of land cover: forest, pasture, cropland, water, urban and unused land. Cropland represents the largest category of land use, covering 47.78% of the catchment area, followed by pasture (28.81%) and forest (21.23%). Other types of land use, such as unused, water bodies and urban, are minor, with a total area of 2.18%.
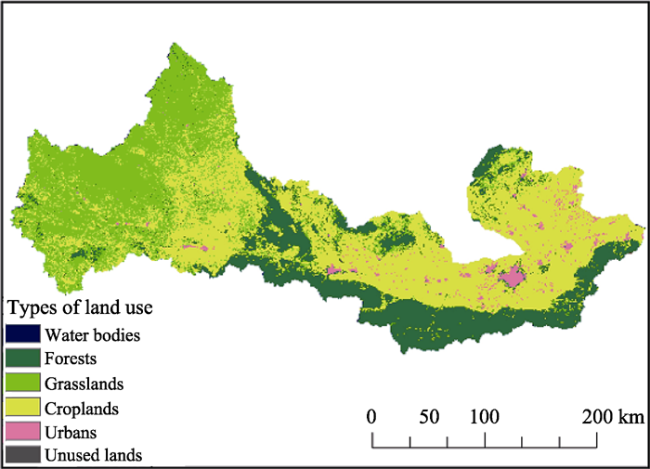
Figure 2 Map of land use in the study area
The soil types in this catchment were derived from the soil map in the Harmonized World Soil Database (HWSD), with a resolution of 1 km. The soil types were then classified according to the Genetic Soil Classification of China. Catchment soil types are dominated by cinnamon soils (34.29%) and cultivated loessial soils (31.73%); other types include brown earth (12.38%), dark loessial soils (7.84%), alluvial soils (7.79%), grey-cinnamon soils (4.26%) and black soils (1.71%) (Figure 3). The properties of each soil type were determined from Soil-Plant-Atmosphere-Water Field & Pond Hydrology (SPAW) software, with wilting moisture ranging from 0.4% to 28.6%, field capacity from 10.2% to 41.4% and saturated moisture content from 41.1% to 54.7%.
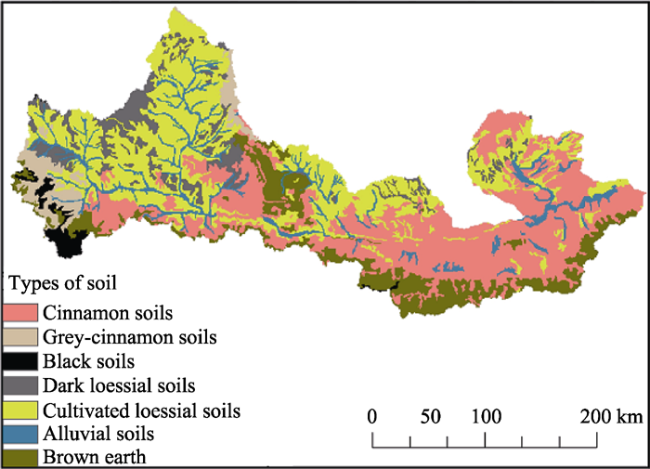
Figure 3 Soil types in the study area
The leaf area index (LAI) data were derived from MOD15A2 of MODIS series products. To obtain the daily LAI data, the eight-day composite LAI data for the period 2002-2007 were interpolated using a piecewise-cubic Hermite polynomial (Zhang and Martin, 2007). MODIS-LAI data have been widely used for estimating evapotranspiration and runoff (Zhang and Martin, 2007; Zhang et al., 2009).
The satellite rainfall data used for the study were TRMM 3B42-V7 daily data from 1 January 2001 to 31 December 2010. The TRMM 3B42-V7 is assumed to be more accurate over land because of the incorporation of a new version of rain gauge data provided by the Global Precipitation Climatology Centre (GPCC) and has been evaluated in tropical cyclone systems (Chen et al., 2013) and in the United States (Kirstetter et al., 2013). For comparison of TRMM 3B42-V7 rainfall data, we used rain gauge data from seven national meteorological stations in the study area, namely Xiji, Tianshui, Baoji, Yaoxian, Xian, Wugong and Huashan, as shown in Figure 1.
Other meteorological data, including daily maximum and minimum temperatures, solar radiation, wind speed, and relative humidity, were also derived from these national stations and used to calculate evapotranspiration and related processes.
Finally, all of the remotely sensed data were discretized into 5 km resolution, with the nearest sampling and daily meteorological data directly interpolated to grid (5 km × 5 km) for the entire basin using the IDW method to satisfy the requirements of the distributed hydrological model. In addition, the observed daily streamflow from the Xianyang hydrological station was used to calibrate the model parameters and validate the simulation results.
Potential evapotranspiration in the study area was estimated by a Penman-Monteith (PM) equation (Allen et al., 1998) recommended by FAO, which has been successfully applied in this area (Zuo et al., 2012). The PM equation calculates the total potential evaporation and transpiration from the Earth’s surface using synoptic meteorological data (solar radiation, air temperature, vapor content and wind speed).

3 Model description

3.1 DTVGM

Because there is heterogeneousness of the relationships and interactions between hydrological processes and spatial characteristics, the hydrological processes are generally too complicated to be expressed as linear systems. Since the 1980s, Xia has developed hydrological nonlinear identification approach to deal with the difficulties of nonlinear hydrological modeling and parameter estimation and has presented a simple Time-Variant Gain Model (TVGM) with a few parameters in terms of hydrological data sets for more than 40 basins around the world (Xia, 1991, 2002; Xia et al., 1997). One of the major contributions of the TVGM is the derivation of a simple relationship between the time-variant runoff coefficient and soil moisture. Verified with real data, the simulation accuracy of TVGM is significantly improved compared with that of other linear models, and the TVGM can be used for real-time forecasting for hydrological systems with nonlinear seasonal disturbances. With the development of GIS, the TVGM has been extended into the DTVGM, which is a time-continuous and spatially distributed model for simulating hydrological components on a daily basis (Xia, 2002). It combines nonlinear hydrological system theory and distributed hydrological simulation, which allows for a relatively simple structure and few required parameters. The DTVGM has been used in a variety of regions (Li et al., 2010; Song et al., 2012; Zhan et al., 2013) since its development.
In addition to hydrological and basic data, such as DEM, flow direction, flow accumulation, slope, saturated soil moisture (WCS), soil field capacity (WCF) and wilting soil moisture (WCW), the DTVGM employs gridded precipitation, LAI and potential evapotranspiration (PET) data as its forcing data. The outputs of the DTVGM include actual evapotranspiration (AET), soil moisture changes and runoff. The DTVGM is composed of five fundamental modules, as shown in Figure 4a. Figure 4b shows the vertical profile of hydrological processes in a grid cell, demonstrating that the precipitation is intercepted by a canopy to generate clear rainfall, and the clear rainfall is then separated into surface runoff and infiltration components by the DTVGM function. Finally, a simplified kinematic wave model is employed to simulate cell routing. Every submodel in the DTVGM was introduced as follows.
(1)Canopy interception
After analyzing the relationship between interception by the canopy and the vegetation fraction (VF), we calculated the accumulative storage capability Sv (mm) for each cell according to the following equation (Aston, 1979):
where Smax is the maximum interception storage (mm), Pcum is the cumulative precipitation (mm), N is a correction coefficient and Cv is the vegetation coverage (%), which is calculated as follows (Nilson, 1971):
where g is a coefficient related to geometric structure.
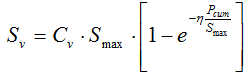
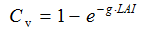
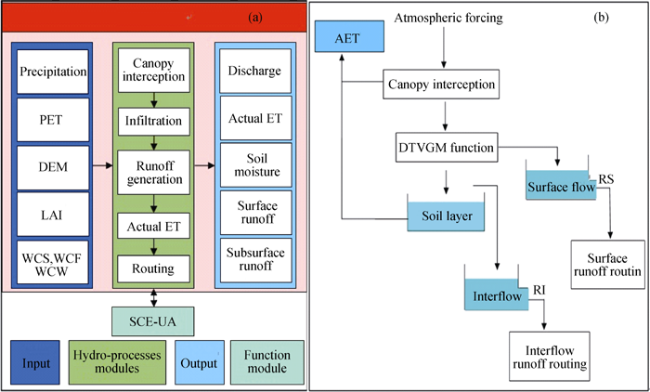
Figure 4 Framework of the DTVGM (a) and vertical profile of hydrological processes (b) in a grid cell
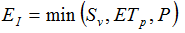
(2) Evapotranspiration
Based on the time scale of the simulation and the location of the study area, we chose the Kristensen-Jensen model (Vázquez and Feyen, 2003; Simon et al., 2008) to calculate the actual evapotranspiration in the DTVGM. The Kristensen-Jensen model comprises evaporation of canopy interception, transpiration of vegetation and evaporation of soil, described by the following formulas:
(3)
(4)
where EI is the evaporation of interception by vegetation (mm), Sv is the interception by vegetation (mm), P is the precipitation (mm), ETp is the potential evapotranspiration (mm), Eat is the actual transpiration of vegetation (mm) and Es is the evaporation from soil. RDF is the root distribution function, which together with f1 reflects the influence of VF on transpiration of vegetation. f2, f3 and f4 are the soil water functions in the root layer, reflecting the influence of soil water on evaporation. C1, C2 and C3 are empirical parameters. θf is the moisture content at field capacity (%), θw is the moisture content at the wilting point (%) and θ is the actual moisture content (%).
(3) Runoff generation
The runoff is composed of surface runoff and subsurface runoff. According to the concept of the TVGM (Xia, 2002), the surface runoff on each grid is calculated according to the following equation:
where Rs is the surface flow, AWs is the actual soil water storage in the soil layer (%), P′ is the clear rainfall (mm) and WMs is the saturation soil water storage in the soil layer (%).
The subsurface runoff can be calculated by coupling the water balance equation and the dynamic storage-outflow function. The formula for subsurface runoff is as follows:
where RI is the subsurface flow, Kr is the storage-outflow coefficient for the soil layer, S is the soil content during the simulation and t is the simulation time.
(4) Flow routing
In the DTVGM, the flow route is composed of a series of ranked grids based on flow direction. The outlet grids can be defined as the first rank, with the grids into which water flows first being ranked second and the rest defined by analogy. Flow routing is undertaken by having the grids with higher rank flow into the grids with lower rank. A simplified kinematic wave model is adopted in the DTVGM; it uses the following formula:
where A is the river cross-sectional area (m2), t is time (s), Q is the discharge (m3/s), X is the flow path (m) and q is the lateral inflow (m3/s).
Table 1 shows six parameters optimized in this hydrological simulation, with their description, range and default values.

3.2 Model evaluation coefficients

In order to objectively estimate the performance of the DTVGM, three statistical coefficients were utilized: the Nash-Sutcliffe coefficient (NSCE, Eq. (13)), the Correlation Coefficient (CC, Eq. (14)) and the Water Balance Relative Error (WBE, Eq. (15)).
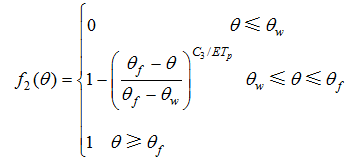
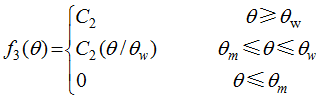
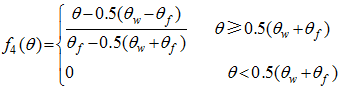
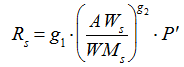
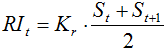
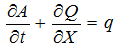
Table 1 Parameters optimized in the DTVGM hydrological simulation
Name Min Max Description Initial value
g1 0.20 0.50 Coefficient of time-variant gain factor 0.25
Ra 0.10 0.60 Initial ratio of soil water in the soil layer 0.20
Kr 0.0001 0.001 Storage-outflow coefficient for the soil layer 0.00015
C1 0.001 1.00 Dimensionless fitting parameter for ET 0.40
C2 0.60 0.80 Dimensionless fitting parameter for ET 0.60
C3 5.00 20.00 Dimensionless fitting parameter for ET 15.00
where N is the number of days of simulation, QO is the observed streamflow at the outlet at time t and QS is the simulated streamflow at the outlet at time t.

4 Results and discussion

4.1 Validation of TRMM rainfall data with rain gauge data

To understand the impact of precipitation on the hydrological simulation, the accuracy of the satellite precipitation data needs to be evaluated against the rain gauge observations. This section compares the basin-average precipitation data from TRMM and gauge observations from 1 January 2001 to 31 December 2010, employing several statistical indices (Table 2).
The areal rainfall averages estimated from rain gauge data using the IDW interpolation method are 1.26-2.15 mm/d in 2001-2010. The averages for TRMM data over the same period are 1.24-2.14 mm/d. The differences are small and acceptable. The areal rainfall averages from TRMM data, however, are smaller than those from rain gauge data in 2002, 2003, 2007 and 2010, with the opposite being true in the other years. A comparison of standard deviations calculated from the two data sets shows that the standard deviations from TRMM data are smaller than the deviations from rain gauge data in 2001-2004, 2006 and 2010, but larger in the other years. The difference in the extreme rainfall is larger than the differences in the mean values and the standard deviations. The maximum daily rainfalls from rain gauge data are larger than those from TRMM data except in 2004-2005, 2007-2008 and 2009. The maximum five-day rainfalls from TRMM data are lower than those from rain gauge data except in 2005, 2007, 2008 and 2007. For the annual rainfall totals, the TRMM data are smaller than the rain gauge data in 2006, 2007 and 2010, but larger in 2001, 2004, 2005, 2008 and 2009.The annual rainfall totals for the two types of data are nearly equal in 2002 and 2003.
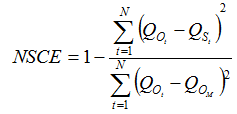
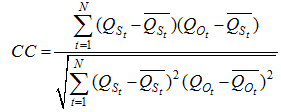
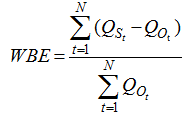
Table 2 Comparison of statistical indices between averaged TRMM rainfall and rain gauge rainfall
Year Areal average (mm/d) Standard deviation (mm) Maximum daily rainfall (mm/d) Maximum 5-day rainfall (mm/5d) Annual rainfall (mm/y)
Gauge TRMM Gauge TRMM Gauge TRMM Gauge TRMM Gauge TRMM
2001 1.29 1.35 2.99 2.91 23.01 21.77 94.15 87.76 468.91 496.30
2002 1.26 1.24 3.36 2.90 36.12 23.91 105.36 94.05 458.57 456.12
2003 2.15 2.14 4.87 4.34 36.82 31.14 142.07 118.28 782.92 781.17
2004 1.31 1.35 3.19 2.94 23.92 27.73 90.46 86.92 480.03 493.15
2005 1.56 1.73 3.84 3.94 27.04 32.03 120.48 121.09 570.38 631.24
2006 1.52 1.36 3.32 2.68 21.62 18.82 94.00 77.42 555.04 497.86
2007 1.58 1.52 3.54 3.65 25.73 35.32 99.00 121.90 575.02 556.21
2008 1.26 1.44 3.09 3.42 22.67 25.64 88.16 109.00 462.70 525.65
2009 1.40 1.47 3.07 3.25 23.26 24.62 85.92 99.89 512.63 525.22
2010 1.61 1.55 4.27 3.42 44.29 22.65 133.07 95.49 589.15 565.08
Figure 5 shows the intensity distributions of daily rainfall in different rainfall categories and their contributions to total rainfall in 2001-2010. As can be seen, the statistics for TRMM rainfall are different from those for rain gauge rainfall. For the TRMM data, the largest category of rainfall occurrence is 0 < rainfall < 2 mm, representing almost 80% of the total days, with the second largest category being 2 mm < rainfall < 5 mm, accounting for approximately10% of the total days. For rain gauge data, the largest rainfall occurrence category is also 0 < rainfall < 2 mm, occurring for about 50% of the total days, followed by non-rainy (about 35%). In other words, more non-rainy days are recorded in rain gauges and more low-rainfall days (0 < rainfall < 2 mm) in TRMM data, which is partly because the rain gauges refer to just seven specific points, so low-rainfall (<0.01 mm) days are often recorded as non-rainy days in the rain gauge data. Figure 5 also shows that although low rainfall (0 < rainfall < 2 mm) occurs on as much as 50-80% of the total days for both rain gauge and TRMM rainfall data, the contribution of low-rainfall days to the total rainfall amount is just 13-15% for both types of rainfall data, while the high-rainfall days (>10 mm) occur on just 4-5% of the total days but contribute to approximately 45% of the average values for total rainfall using rain gauge data and 35% for total rainfall using TRMM data. This is important because high-rainfall events often induce flash floods and so are dangerous and present a threat to the economy and human life (Varikoden et al., 2010). The middle category of rainfall (2 mm < rainfall <10 mm) for rain gauge data is smaller (13.61%) than for TRMM rainfall data (16.18%), with the contributions to total rainfall being 42.46% and 47.99%, respectively.
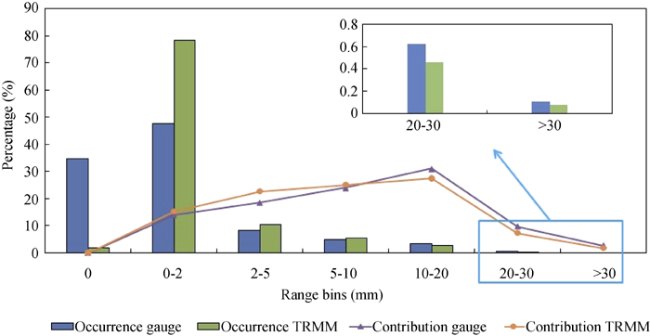
Figure 5 Distribution of daily rainfall in different rainfall categories and relative contribution to total rainfall, 2001-2010
Table 2 and Figure 5 demonstrate that the TRMM data are less sensitive to the high-rainfall events than the rain gauge data but more sensitive to low-rainfall events. The reason is that the TRMM precipitation radar wavelength is sensitive to attenuation in the vertical direction, leading to measurements that underestimate rainfall in heavy rainstorms; the attenuation problem does not exist in the horizontal direction, and the radar therefore produces better measurements of low-rainfall events.
Figure 6 shows correlations of the TRMM and rain gauge data sets using scatter plots of monthly TRMM rainfall data against rain gauge rainfall data for the seven national meteorological stations. The figure demonstrates that there are good linear relationships between the TRMM and rain gauge data at every station. With the exception of the Wugong station, the values of R2 are all larger than 0.80, with the highest, 0.89, at Huashan station. The values of the slopes range from 0.84 for Xiji to 0.98 for Xian and Baoji. For the areal average, the R2 and slope values are as high as 0.96 and 0.98. These statistical values indicate that the TRMM satellite tends to underestimate monthly rainfall in this area compared with the rain gauge data; the reason is that the TRMM satellite underestimates extreme rainfall.
Figures 1 and 6 show that the correlation of TRMM and rain gauge data generally improves with decreasing elevation. In general, elevation significantly affects the accuracy of TRMM, a finding that is consistent with previous studies (Karaseva et al., 2012; Zeng et al., 2013). However, the Wugong and Huashan stations are exceptions, which may be the result of the intersection of local topography and the resolution of remote sensing.

4.2 Hydrological process simulation

Although the first phase of the study has established that there is a good correlation between TRMM and rain gauge data sets, the spatial heterogeneity in the two data sets calls for a comparison to test the hydrological simulation. Because of the limitations of streamflow observations, the hydrological simulation evaluation was performed from 2001 to 2007 under two scenarios.
In Scenario I, the DTVGM was calibrated and optimized with four years of rain gauge data (January 2001 to December 2004) and validated with three years of rain gauge data (January 2005 to December 2007). The rain gauge forcing was then replaced by TRMM rainfall data derived from 3B42-V7 for an independent validation from January 2001 to December 2007 with unaltered model parameter values over the same time periods. In Scenario II, the DTVGM was calibrated and optimized with four years of TRMM data (January 2001 to December 2004) and validated with three years of TRMM data (January 2005 to December 2007). The TRMM forcing was then replaced by rain gauge data for an independent validation from January 2001 to December 2007 with unaltered model parameter values in the same periods. The summary values of the evaluation criteria for the performance of the model in the two scenarios are shown in Table 3.
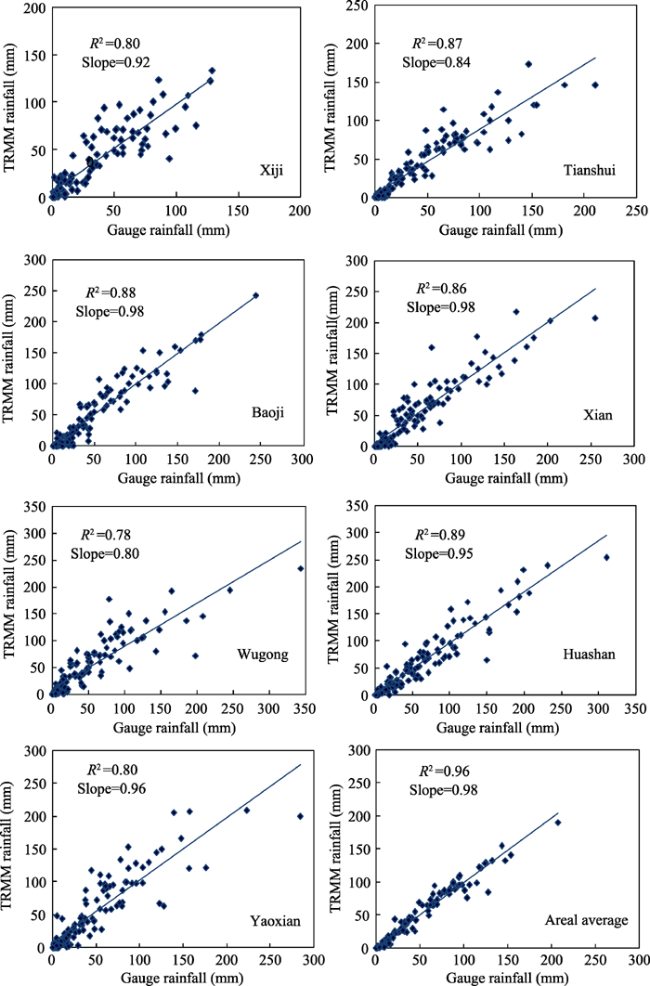
Figure 6 Scatter plots of monthly rainfall from TRMM and rain gauge data for the seven national meteorological stations and the areal average data
Table 3 Comparison of daily observed and simulated streamflow under two calibration scenarios
Precipitation
products
Scenario I Scenario II
NSCE WBE (%) CC NSCE WBE (%) CC
Calibration period
Gauge 0.69 18.71 0.84 0.68 14.37 0.83
TRMM 0.59 21.96 0.78 0.60 18.02 0.78
Validation period
Gauge 0.55 -18.85 0.78 0.52 -23.85 0.74
TRMM 0.48 -15.38 0.71 0.50 -19.91 0.72
As can be seen from Table 3, the model driven by rain gauge data produces a good fit in the calibration period and a reasonable simulation in the validation period in Scenario I. The NSCE values for rain gauge data are 0.69 and 0.55 in the calibration and validation periods, respectively. The relatively high values of CC (0.84 and 0.78) in the calibration and validation periods confirm that the simulation is capable of describing the variation in streamflow observations. The values of WBE (18.71% and -18.85%) in the calibration and validation periods are all in a reasonable range. Based on the criteria of the statistical indices reported by Moriasi et al. (2007), the model calibration and validation results indicate that the DTVGM is adequately benchmarked by the rain gauge data at the daily scale and that the model can be used to evaluate the utility of the satellite precipitation products for streamflow simulation in the catchment. Compared with the performance of rain gauge data, the daily simulation forced by TRMM data shows poor results in the calibration and validation periods. The NSCE values are respectively 0.59 and 0.48 in these two periods, those of CC are 0.78 and 0.71 and those of WBE are 21.96% and -15.38%.
To further assess the effect of TRMM data on streamflow, the DTVGM was recalibrated and validated with TRMM data for the same period used in Scenario I. This scenario is often used as an alternative strategy for remote sensing of precipitation over ungauged basins. As shown in Table 3, in Scenario II, the performance of the simulation with rain gauge data is still better than with TRMM rain data. The NSCE values are 0.68 and 0.52 and the WBE values are 14.37% and -23.85% in the calibration and validation periods, respectively; the CC values also relatively high (0.83 and 0.74, respectively). At the same time, in addition to the value of water balance relative error WBE in the validation period, the statistical indices for simulation by TRMM data are improved after the recalibration: the NSCE values are 0.60 and 0.50 and the values of CC are 0.78 and 0.72 in the calibration and validation periods, respectively.
Figures 7 and 8 compare the observed and simulated daily streamflow hydrographs, which are produced respectively using the model calibrated by rain gauge rainfall data and by TRMM rainfall data with their own optimal parameter values. Both figures show that general agreement exists between the observed and simulated streamflow hydrographs. However, the simulated streamflow hydrographs with rain gauge data show closer agreement with the observed hydrographs. In Figures 7 and 8, the simulated streamflow consistently underestimates the peaks in relatively high-flow years (2003 and 2005) because of the scarcity of rain stations and the low precision of TRMM rainfall data in matching the maximum rainfall. Besides, the results of Figures 7 and 8 are consistent with the results of Figure 5 and Table 2. From Table 2, we can see that the maximum daily rainfall from rain gauge data is clearly larger than that from TRMM data in 2003, while the reverse is true in 2007. Correspondingly, the hydrographic peak for TRMM data is clearly lower than that for rain gauge data in 2003, with the reverse being true in 2007.
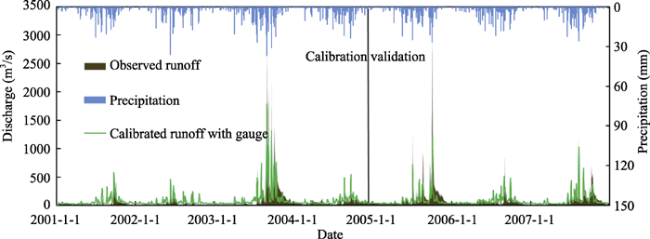
Figure 7 Comparison of observed and simulated hydrographs using daily rain gauge data at Xianyang hydrological station
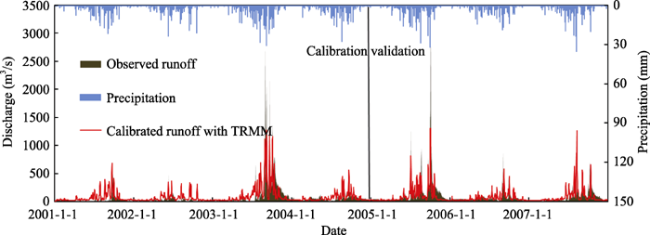
Figure 8 Comparison of observed and simulated hydrographs using daily TRMM data at Xianyang hydrological station
We subsequently examined the precision of the model using TRMM rainfall data for a monthly streamflow simulation. Table 4 shows the results of the evaluation of the model performance using TRMM and rain gauge rainfall data for the complete simulation periods and the comparison of the observed and simulated monthly hydrographs.
Table 4 shows that in Scenario II, the model using TRMM rainfall data produced a better result than the model using rain gauge data, with an NSCE value of 0.68, a CC value of 0.84 and a WBE value of -1.78%. Interestingly, with the exception of the WBE values, the statistical indices of the model using TRMM data are better than those of the model using rain gauge data in Scenario I, with an NSCE value of 0.67 and a CC value of 0.84. This could be explained by the fact that when monthly scale results are calculated, the positive and negative daily fluctuations interact to improve modeling results over a longer time scale.
Table 4 Comparison of monthly observed and simulated streamflow under two calibration scenarios
Precipitation
products
Scenario I Scenario II
NSCE WBE (%) CC NSCE WBE (%) CC
Gauge 0.64 -0.84 0.83 0.64 -5.58 0.82
TRMM 0.67 2.52 0.84 0.68 -1.78 0.84
Figure 9 makes it clear that the simulated monthly hydrographs generated by rain gauge and TRMM data generally match well and describe the seasonal variations well, although they slightly underpredict or overpredict some peak flows. In fact, in comparison of the studies by Eckhardt et al. (2005) and Beskow et al. (2011), it is clear that it is difficult to simulate and predict the peak discharge using a hydrological model. The reasons for this are that (i) the rainfall gauging network cannot reflect fully the spatial variability of rainfall and (ii) the TRMM data underestimate extreme rainfall. Compared with the results of the daily simulation, the TRMM rainfall data appear more suitable for monthly streamflow simulation in this study area, and have the potential to be suitable for data-poor or ungauged basins, particularly in developing countries or remote locations.
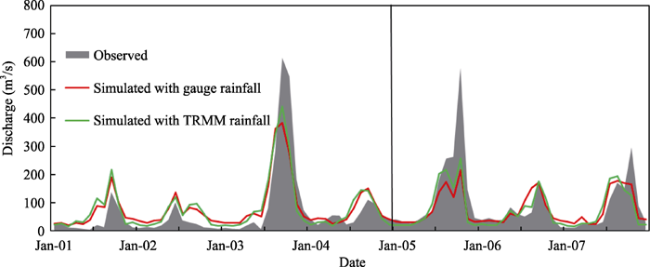
Figure 9 Comparison of observed and simulated discharge with monthly TRMM and rain gauge data at Xianyang hydrological station

4.3 Analysis of parameter recalibration effect and water balance

Table 5 shows the optimum parameter sets forced by TRMM 3B42-V7 and rain gauge data for the calibration period from 2001 to 2004 using the SCE-UA algorithm. The g1 value is reduced from 0.23 for rain gauge forcing to 0.22 for TRMM forcing, the Kr value is decreased from 0.0006 to 0.0002 and the C1 value is increased from 0.50 to 0.52. The overall effect of the recalibration of these four parameters is to decrease runoff volume, making the relative error in the water balance more reasonable. Table 5 shows that the decreased C2 and C3 retain more water in the river basin after recalibration of the parameters, possibly to partially offset the above runoff reduction, among other parametric interactions. It also shows that the Ra for TRMM forcing is increased to 0.51 from its value of 0.15 for gauge forcing to hold more water in the soil layer and compensate for its underestimation, as shown in Figures 8 and 9.
Table 5 DTVGM model parameter values calibrated with different rainfall inputs for the calibration period
Parameters Gauge TRMM
g1 0.23 0.22
Kr 0.0006 0.0002
C1 0.50 0.52
C2 0.78 0.66
C3 10.00 9.96
Ra 0.15 0.51
Generally, parameter recalibration has the shortcoming of providing a locally optimized model with parameter values unrepresentative of reality. This might limit the model’s predictive capability under different initial conditions. However, the study shows that, for TRMM data, different combinations of parameter settings produce very similar simulation results, a phenomenon called ‘equifinality’ of the hydrological model (Zak and Beven, 1999; Beven and Freer, 2001). The results from TRMM 3B42-V7 in the study area are almost unaffected by the recalibration; that is to say, the 3B42-V7 product should be suitable for use in similar regions, even without needing recalibration.
In addition to analysis of parameter properties, water balance analysis is another important indicator for analyzing the influence of precipitation on hydrological simulations. Therefore, Figure 10 shows comparisons of the yearly averaged water balance components from 2001 to 2007, based on the modeling results.
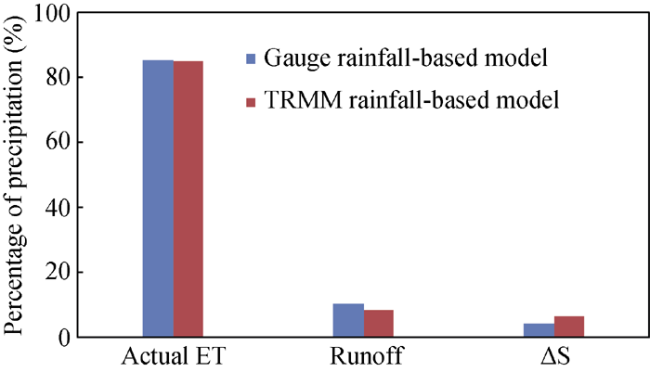
Figure 10 Relative changes to water balance components in models based on rain gauge and TRMM rainfall data
In the DTVGM, the water balance partitions the precipitation into evapotranspiration (Actual ET), runoff and soil moisture content (△S). Figure 10 reveals differences for water balance components generated by the models based on rain gauge and TRMM rainfall data. It can be seen that 85.31% of precipitation is consumed by evapotranspiration for the rain gauge-based model, while the rate is 85.07% in the TRMM-based model. The difference is very small, and the rates of evapotranspiration in the two models are similar to those found in a previous study (Xu and Zuo, 2012). However, the rates of soil water storage are different in the two models. In the rain gauge-based model, 4.26% of precipitation is stored in the catchment, while the corresponding value is 6.34% in the TRMM-based model. As far as total runoff is concerned, the percentage of precipitation for the rain gauge-based model (10.43%) is larger than that for the TRMM-based model (8.59%). The general conclusion that can be drawn from Figure 10 is that different rainfall data sources can change the proportions of water balance components in hydrological simulations. However, as can be seen from Figure 10, the differences in the proportions of water balance components in TRMM-based and rain gauge-based models are small. In other words, the TRMM rainfall data can be considered suitable for hydrological simulation in the Weihe River catchment.

5 Conclusions

This study focused first on statistically assessing the accuracy of the latest version of TRMM 3B42-V7 using rain gauge data, and then evaluated its performance in hydrological simulations using the DTVGM distributed hydrological model in the semi-humid Weihe River catchment in China.
The statistical results reveal that daily TRMM rainfall data are better at capturing rain occurrence (16.18%) than are rain gauge data (13.61%) for the middle range of rainfall (2 mm < rainfall <10 mm), with greater differences in maximum daily and maximum five-day rainfalls for the two rainfall data sources. A linear relationship between the monthly TRMM rainfall data and monthly rain gauge rainfall data has also been presented for each rain gauge station.
Simulation of daily hydrological processes shows that the DTVGM calibrated by conventional rain gauge data performs better than the model calibrated by TRMM rainfall data at daily time steps. Compared with the rain gauge data, however, the TRMM rainfall data are capable of better performance for monthly streamflow simulations. The results imply that TRMM rainfall data are more suitable for monthly simulation in this study area. Comparison of parameters in two calibration schemes using the two types of rainfall data shows that different rainfall data sources can, to some extent, change parameter values. It confirms that the performance of the 3B42-V7 product is almost unaffected by recalibration and that this product can be used with high confidence in similar basins, even without needing recalibration. The proportions of water balance components differ between the rain gauge-based and TRMM-based models. However, these differences are small, which also confirms that the TRMM rainfall data are suitable for hydrological simulation in the Weihe River catchment.
In conclusion, despite generally being unable to detect extreme rainfall and being unsuitable for hydrological simulations at short time steps, TRMM rainfall data are suitable for hydrological simulations at monthly or seasonal time steps in semi-humid East Asian regions, which is particularly promising for water resource management and assessment in data-poor or ungauged regions.

The authors have declared that no competing interests exist.

1
Allen R G, Pereira L S, Raes Det al., 1998. Crop Evapotranspiration: Guidelines for Computing Crop Water Requirements. FAO Irrigation and Drainage.

2
Aston A R, 1979. Rainfall interception by eight small trees.Journal of Hydrology, 42: 383-396.

3
Beskow S, Mello C R, Norton L Det al., 2011. Performance of a distributed semi-conceptual hydrological model under tropical watershed conditions.Catena, 86: 160-171.

4
Beven K J, Freer J, 2001. Equifinality, data assimilation, and uncertainty estimation in mechanistic modelling of complex environmental systems using the GLUE methodology.Journal of Hydrology, 249(1-4): 11-29.

5
Bitew M M, Gebremichael M, Gebremichael L Tet al., 2011. Evaluation of high-resolution satellite rainfall products through streamflow simulation in a hydrological modeling of a small mountainous watershed in Ethiopia.Journal of Hydrometeorology, 13(1): 338-350.

6
Chen Y, Ebert E E, Walsh K J Eet al., 2013. Evaluation of TRMM 3B42 precipitation estimates of tropical cyclone rainfall using PACRAIN Data.Journal of Geophysical Research - Atmospheres, 118(5): 2184-2196.

7
Chiu L S, North G R, McConnell Aet al., 1990. Rain estimation from satellites: Effect of finite field of view.J. Geophys. Res., 95: 2177-2186.

8
Eckhardt K, Fohrer N, Frede H, 2005. Automatic model calibration.Hydrological Processes, 19(3): 651-658.

9
Gourley J J, Vieux B E, 2006. A method for identifying sources of model uncertainty in rainfall-runoff simulations.Journal of Hydrology, 327(1/2): 68-80.

10
Guillermo Q, Tabios III G Q, Salas J D, 1985. A comparative analysis of techniques for spatial interpolation of precipitation.Journal of the American Water Resources Association, 21: 365-380.

11
Huffman G J, Adler R F, Bolvin D Tet al., 2007. The TRMM Multisatellite Precipitation Analysis (TMPA): Quasi-global, multiyear, combined-sensor precipitation estimates at fine scales.Journal of Hydrometeorology, 8: 38-55.

12
Jiang S, Ren L L, Hong Yet al., 2012. Comprehensive evaluation of multi-satellite precipitation products with a dense rain gauge network and optimally merging their simulated hydrological flows using the Bayesian model averaging method.Journal of Hydrology, 452/453: 213-225.

13
Joyce R J, Janowiak J E, Arkin P Aet al., 2004. CMORPH: A method that produces global precipitation estimates from passive microwave and infrared data at high spatial and temporal resolution.Journal of Hydrometeorology, 5(3): 487-503.

14
Karaseva M O, Prakash S, Gairola R M, 2012. Validation of high-resolution TRMM-3B43 precipitation product using rain gauge measurements over Kyrgyzstan.Theoretical and Applied Climatology, 108: 147-157.

15
Kidd C, Kniveton D R, Todd M C, 2003. Satellite rainfall estimation using combined passive microwave and infrared algorithms.Journal of Hydrometeorology, 4(6): 1088-1104.

16
Kirstetter P E, Hong Y, Gourley J Jet al., 2013. Comparison of TRMM 2A25 products, Version 6 and Version 7, with NOAA/NSSL ground radar-based national mosaic QPE.Journal of Hydrometeorology, 14: 661-669.

17
Kummerow C, Simpson J, Thiele Oet al., 2000. The status of the Tropical Rainfall Measuring Mission (TRMM) after two years in orbit.Journal of Applied Meteorology, 39(1): 1965-1982.

18
Kurtzman D, Navon S, Morin E, 2009. Improving interpolation of daily precipitation for hydrologic modeling: Spatial patterns of preferred interpolators.Hydrological Processes, 23: 3281-3291.

19
Li L, Xia J, Xu C Yet al., 2010. Evaluation of the subjective factors of the GLUE method and comparison with the formal Bayesian method in uncertainty assessment of hydrological models.Journal of Hydrology, 390: 210-221.

20
Li X H, Zhang Q, Xu C X, 2012. Suitability of the TRMM satellite rainfalls in driving a distributed hydrological model for water balance computations in Xinjiang catchment, Poyang Lake Basin.Journal of Hydrology, 426/427: 27-28.

21
Liu Y, Hu A Y, 2006. Changes of precipitation characters along Weihe Basin in 50 years and its influence on water resources.Journal of Arid Land Resources and Environment, 20(1): 85-87. (in Chinese)

22
Moriasi D N, Arnold J G, Van Lew M Wet al., 2007. Model evaluation guidelines for systematic quantification of accuracy in watershed simulations.ASABE, 50(3): 885-900.

23
Nair S, Srinivasan G, Nemani R, 2009. Evaluation of multi-satellite TRMM derived rainfall estimates over a western state of India.Journal of the Meteorological Society of Japan, 87(6): 927-939.

24
Narayanan M S, Shah S, Kishtawal C Met al., 2005. Validation of TRMM merge daily rainfall with IMD rain gauge analysis over Indian land mass. Technical Report, Space Applications Centre, Ahmedabad, India.

25
Nijssen B, Lettenmaier D P, 2004. Effect of precipitation sampling error on simulated hydrological fluxes and states: Anticipating the global precipitation measurement satellites.J. Geophys. Res., 109, D02103, doi: 10.1029/2003JD003497.

26
Nilson T, 1971. A theoretical analysis of the frequency of gaps in plant stands.Journal of Agricultural Meteorology, 8: 25-38.

27
Rahman H, Sengupta D, 2007. Preliminary comparison of daily rainfall from satellites and Indian gauge data. CAOS Technical Report No. 2007AS1, Centre for Atmospheric and Oceanic Sciences, Indian Institute of Science, Bangalore-12.

28
Rozante J R, Moreira D S, Gustavo Let al, 2010. Combining TRMM and surface observations of precipitation: Technique and validation over South America.Weather and Forecasting, 25(3): 885-894.

29
Shin D B, North G R, 2000. Errors incurred in sampling a cyclostationary field.Journal of Atmospheric and Oceanic Technology, 17: 656-664.

30
Simon S, Jensen K H, Sandholt Iet al., 2008. A remote sensing driven distributed hydrological model of the Senegal River Basin.Journal of Hydrology, 354: 131-148.

31
Song X M, Zhan C S, Xia Jet al., 2012. An efficient global sensitivity analysis approach for distributed hydrological model.Journal of Geographical Sciences, 22(2): 209-222.

32
Sorooshian S, Hsu K L, Gao X Get al., 2000. Evaluation of PERSIANN system satellite-based estimates of tropical rainfall.Bulletin of the American Meteorological Society, 81(9): 2035-2046.

33
Stisen S, Sandholt I, 2010. Evaluation of remote-sensing-based rainfall products through predictive capability in hydrological runoff modeling.Hydrological Processes, 24(7): 879-891.

34
Su F, Hong Y, Lettenmaier D P, 2008. Evaluation of TRMM multisatellite precipitation analysis (TMPA) and its utility in hydrologic prediction in the La Plata Basin.Journal of Hydrometeorology, 9(4): 622-640.

35
Varikoden H, Samah A A, Babu C A, 2010. Spatial and temporal characteristics of rain intensity in the peninsular Malaysia using TRMM rain rate.Journal of Hydrology, 387: 312-319.

36
Vázquez R F, Feyen J, 2003. Effect of potential evapotranspiration estimates on effective parameters and performance of the MIKE SHE-code applied to a medium-size catchment.Journal of Hydrology, 270: 309-327.

37
Xia J, 1991. Identification of a constrained nonlinear hydrological system described by Volterra functional series,Water Resources Research, 27(9): 2415-2420.

38
Xia J, 2002. A system approach to real time hydrological forecasts in watersheds.Water International, 27(1): 87-97.

39
Xia J, 2005. Development of distributed time-variant gain model for nonlinear hydrological systems. Science in China Series D: Earth Sciences, 48(6): 713-723.

40
Xia J, O'Connor K M, Kachroo P Ket al., 1997. A non-linear perturbation model considering catchment wetness and its application in river flow forecasting.Journal of Hydrology, 200: 164-178.

41
Xu Z X, Zuo D P, 2012. Assessment on blue and green water resources at different scales in the Wei River Basin.Special Issue of National Water Resources Rational Allocation and Optimal Scheduling Technology, 139-158. (in Chinese)

42
Xue X W, Hong Y, Limaye A Set al., 2013. Statistical and hydrological evaluation of TRMM-based multi-satellite precipitation analysis over the Wangchu Basin of Bhutan: Are the latest satellite precipitation products 3B42V7 ready for use in ungauged basins?Journal of Hydrology, 499: 91-99.

43
Yong B, Hong Y, Ren L Let al., 2012. Assessment of evolving TRMM-based multisatellite real-time precipitation estimation methods and their impacts on hydrologic prediction in a high latitude basin.Journal of Geophysical Research - Atmospheres, 117: D09108.

44
Yu M Y, Chen X, Li L Het al., 2011. Streamflow simulation by SWAT using different precipitation sources in large arid basins with scarce raingauges.Water Resources Management, 25: 2669-2681.

45
Zak S K, Beven K J, 1999. Equifinality, sensitivity and predictive uncertainty in the estimation of critical loads.Science of the Total Environment, 236(1-3): 191-124.

46
Zeng H W, Li L J, Hu J M, 2013. Accuracy validation of TRMM multisatellite precipitation analysis daily precipitation products in the Lancang River Basin of China.Theoretical and Applied Climatology, 112: 389-401.

47
Zeng H W, Li L J, Li J Y, 2012. The evaluation of TRMM Multisatellite Precipitation Analysis (TMPA) in drought monitoring in the Lancang River Basin.Journal of Geographical Sciences, 22(2): 273-282.

48
Zhan C S, Song X M, Xia Jet al., 2013. An efficient integrated approach for global sensitivity analysis of hydrological model parameters.Environmental Modelling and Software, 41: 39-52.

49
Zhang Y Q, Chiew F H S, Zhang L, 2009. Use of remotely sensed actual evapotranspiration to improve rainfall-runoff modeling in southeast Australia.Journal of Hydrometeorology, 10: 969-980.

50
Zhang Y Q, Martin W, 2007. Predicting runoff in ungauged catchments by using Xinanjiang model with MODIS leaf area index.Journal of Hydrology, 370: 155-162.

51
Zuo D P, Xu Z X, Yang Het al., 2012. Spatiotemporal variations and abrupt changes of potential evapotranspiration and its sensitivity to key meteorological variables in the Wei River Basin, China.Hydrological Processes, 26: 1149-1160.

Outlines

/