
Journal of Geographical Sciences >
Hydrological processes of glacier and snow melting and runoff in the Urumqi River source region, eastern Tianshan Mountains, China
Author: Sun Meiping (1981-), PhD and Associate Professor, specialized in the research of hydrological processes and the climate change impact assessment. E-mail:sunmeiping1982@163.com
Received date: 2014-08-29
Accepted date: 2014-09-22
Online published: 2015-02-15
Supported by
National Science and Technology Support Plan Projects, No.2012BAC19B07
Scientific Research Project of Higher Learning Institution in Gansu Province, No.2013A-018
Project of Scientific Ability Promoting of Young Teachers of Northwest Normal University, No.NWNU- LKQN-12-20
Copyright
Hydrological processes were compared, with and without the influence of precipitation on discharge, to identify the differences between glacierized and non-glacierized catchments in the Urumqi River source region, on the northern slope of the eastern Tianshan Mountains, during the melting season (May-September) in 2011. The study was based on hydrological data observed at 10-min intervals, meteorological data observed at 15-min intervals, and glacier melting and snow observations from the Empty Cirque, Zongkong, and Urumqi Glacier No.1 gauging stations. The results indicated that the discharge differed markedly among the three gauging stations. The daily discharge was more than the nightly discharge at the Glacier No.1 gauging station, which contrasted with the patterns observed at the Zongkong and Empty Cirque gauging stations. There was a clear daily variation in the discharge at the three gauging stations, with differences in the magnitude and duration of the peak discharge. When precipitation was not considered, the time-lags between the maximum discharge and the highest temperature were 1-3 h, 10-16 h, and 5-11 h at the Glacier No.1, Empty Cirque, and Zongkong gauging stations, respectively. When precipitation was taken into consideration, the corresponding time-lags were 0-1 h, 13 h, and 6-7 h, respectively. Therefore, the duration from the generation of discharge to confluence was the shortest in the glacierized catchment and the longest in the catchment where was mainly covered by snow. It was also shown that the hydrological process from the generation of discharge to confluence shortened when precipitation was considered. The factors influencing changes in the discharge among the three gauging stations were different. For Glacier No.1 station, the discharge was mainly controlled by heat conditions in the glacierized region, and the discharge displayed an accelerated growth when the temperature exceeded 5°C in the melt season. It was found that the englacial and subglacial drainage channel of Glacier No.1 had become simpler during the past 20 years. Its weaker retardance and storage of glacier melting water resulted in rapid discharge confluence. It was also shown that the discharge curve and the time-lag between the maximum discharge and the highest temperature could be used to reveal the evolution of the drainage system and the process of glacier and snow melting at different levels of glacier coverage.
SUN Meiping , YAO Xiaojun , LI Zhongqin , ZHANG Mingjun . Hydrological processes of glacier and snow melting and runoff in the Urumqi River source region, eastern Tianshan Mountains, China[J]. Journal of Geographical Sciences, 2015 , 25(2) : 149 -164 . DOI: 10.1007/s11442-015-1159-x
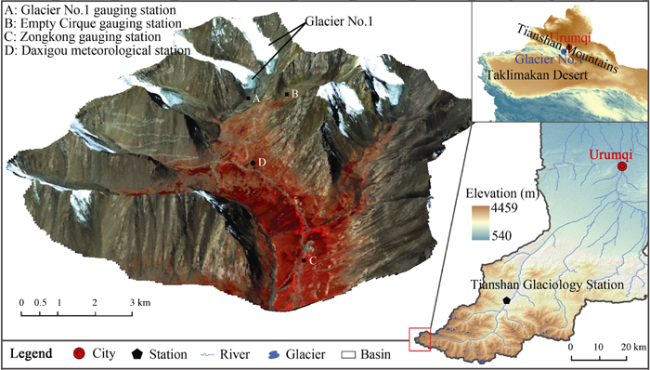
Figure 1 The location of Urumqi River source region and the glacier distribution (the base map is the SPOT 5 image acquired on September 7, 2005) |
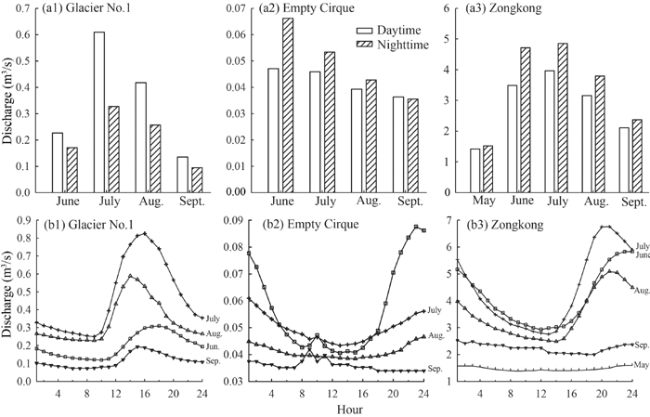
Figure 2 The comparison of daytime (09:00-20:00) and nighttime (21:00-08:00) discharges and mean diurnal variation in discharge during the ablation season at the three gauging stations |
Table 1 The time and its duration when daily maximum and minimum discharges occur at the three gauging stations |
| Gauging station | Months | Minimum discharge occurrence time | Maximum discharge occurrence time | Duration from minimum discharge to maximum discharge (h) |
|---|---|---|---|---|
| Glacier No.1 | 6 | 10:00 | 18:00 | 8 |
| 7 | 09:00 | 16:00 | 7 | |
| 8 | 09:00 | 14:00 | 5 | |
| 9 | 08:00 | 15:00 | 7 | |
| Empty Cirque | 6 | 15:00 | 23:00 | 8 |
| 7 | 13:00 | 01:00 | 12 | |
| 8 | 15:00 | 24:00 | 9 | |
| Zongkong | 5 | 14:00 | 23:00 | 9 |
| 6 | 15:00 | 23:00 | 8 | |
| 7 | 13:00 | 21:00 | 8 | |
| 8 | 14:00 | 21:00 | 7 | |
| 9 | 18:00 | 01:00 | 7 |
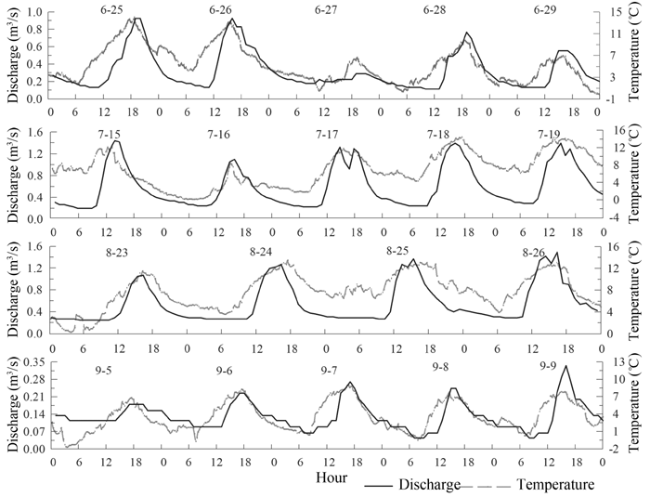
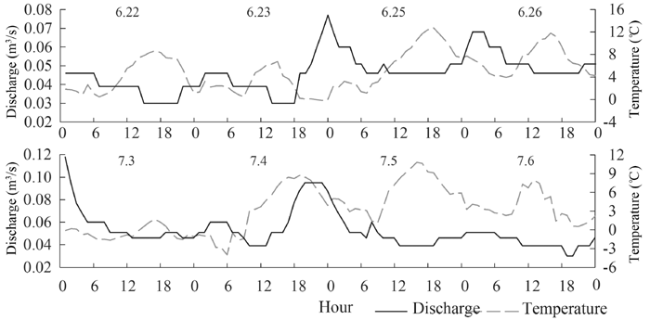
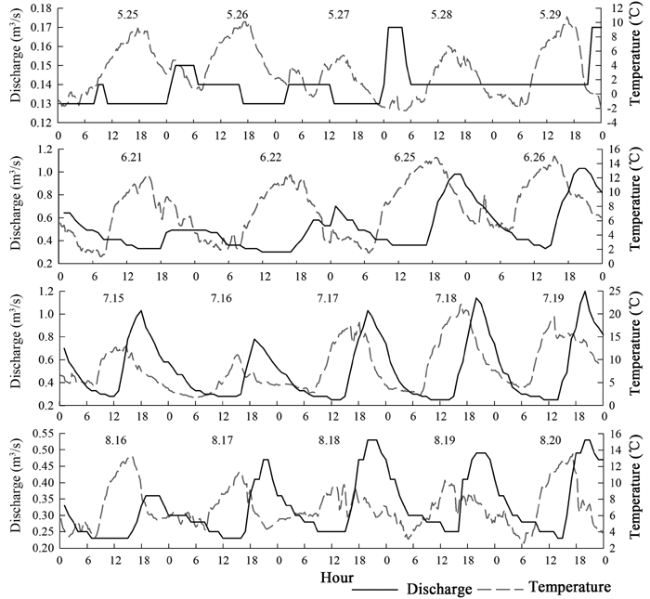
Figure 3 Diurnal variation in discharge (solid line) and temperature (dashed line) of Glacier No.1 gauging station in the clear weather days |
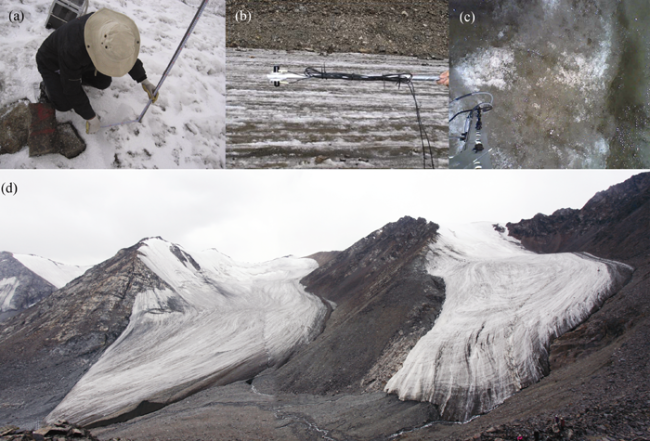
Figure 4 Ablation stacks observation (a), radiation observation (b) and surface ablation observation of east branch (c); the full view of Glacier No.1 (d) on August 2, 2011 (Photographs provided by Wang Wenbin and Jin Shuang) |
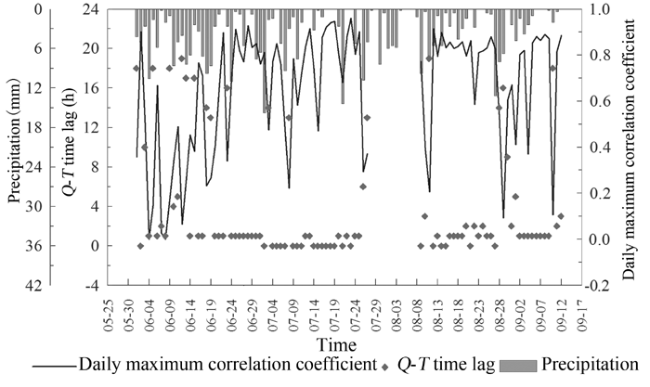
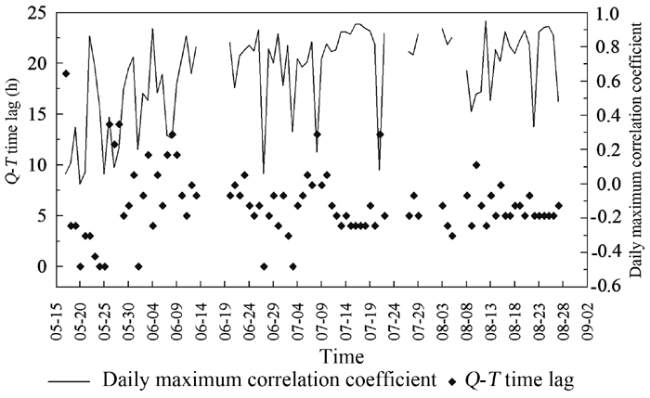
Figure 5 The variation of daily time-lag between discharge and air temperature and daily maximum correlation coefficient at Glacier No.1 gauging station during the ablation season in 2011 |
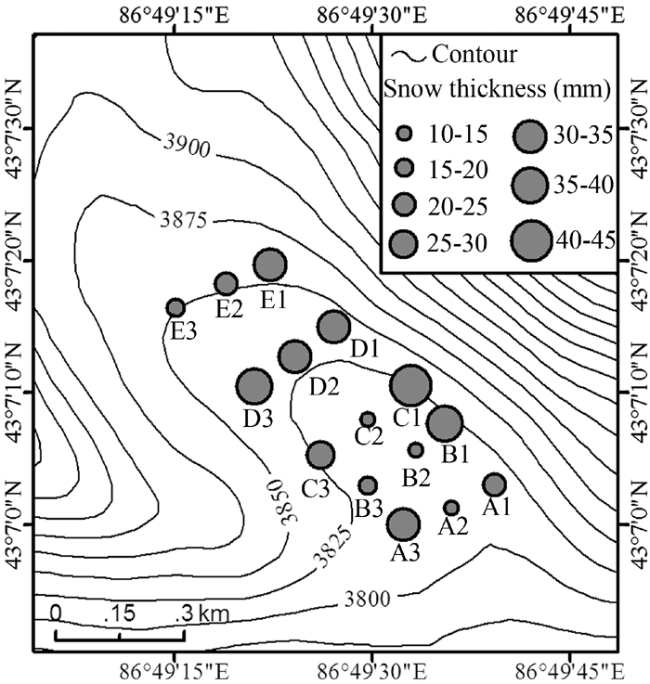
Figure 6 The spatial distribution of snow thickness in the Empty Cirque area on April 23, 2011 |
Figure 7 Diurnal variation in discharge (solid line) and temperature (dashed line) of Empty Cirque gauging station in the clear weather days |
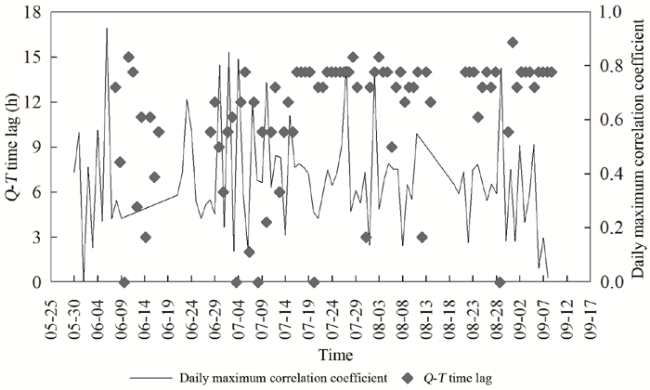
Figure 8 The variation of daily time-lag between discharge and air temperature and daily maximum correlation coefficient at Empty Cirque gauging station during the ablation season in 2011 |
Figure 9 Diurnal variation in discharge (solid line) and temperature (dashed line) of Zongkong gauging station in the clear weather days |
Figure 10 The variation of daily time-lag between discharge and air temperature and daily maximum correlation coefficient at Zongkong gauging station in the ablation season in 2011 |
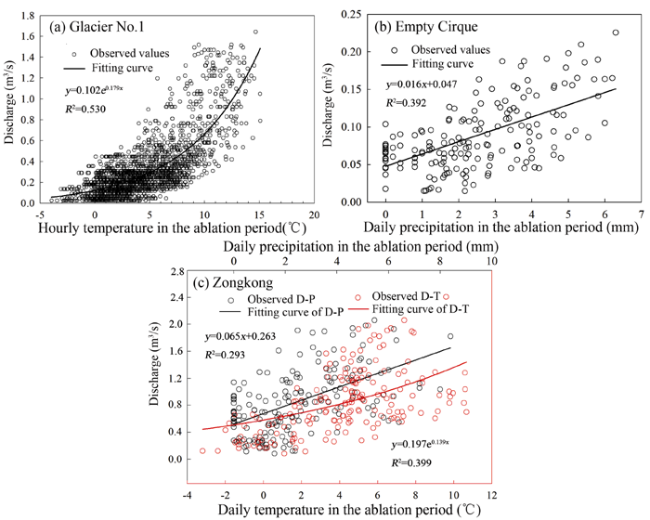
Figure 11 Relationships between discharge and precipitation and temperature at the three gauging stations in the ablation period of 2011 |
Table 2 The comparisons of glacier melt-runoff characteristics among seven glaciers |
| Glacier | Glacier area (km2) | Distance from gauging site to the snout of glacier (m) | Q-T time lag (h) | Maximum discharge occurrence time | Minimum discharge occurrence time | Observation time | References |
|---|---|---|---|---|---|---|---|
| Hailuogou | 25.71 | 500 | 4-12 | 2003-2005 | Liu and Liu, 2009 | ||
| Rongbuk | 203.00 | Near the snout of glacier | 9-14 | 24:00-01:00 | 12:00-15:00 | 2005.06 | Liu et al., 2010 |
| Koxkar | 83.56 | Near the snout of glacier | 4-10 | 18:00-02:00 | 07:00-10:00 | 2000-2003 | Han et al., 2009 |
| Qiyi | 2.87 | Near the snout of glacier | 2 | 17:00 | 2006.08-09 | Song et al., 2008 | |
| Gangotri | 286.00 | 3000 | 4-7.3 | 17:00-21:00 | 08:00-09:00 | 2000-2003 | Singh et al., 2006 |
| Baounet | 2.50 | Near the snout of glacier | 2-9 | 2003-2004 | Jobard and Dzikowski, 2006 |
The authors have declared that no competing interests exist.
| 1 |
|
| 2 |
|
| 3 |
|
| 4 |
|
| 5 |
|
| 6 |
|
| 7 |
|
| 8 |
|
| 9 |
|
| 10 |
|
| 11 |
|
| 12 |
|
| 13 |
|
| 14 |
|
| 15 |
|
| 16 |
|
| 17 |
|
| 18 |
|
| 19 |
|
| 20 |
|
| 21 |
|
| 22 |
|
| 23 |
|
| 24 |
|
| 25 |
|
| 26 |
|
| 27 |
|
| 28 |
|
/
| 〈 |
|
〉 |