
Journal of Geographical Sciences >
Dynamic trends and driving forces of land use intensification of cultivated land in China
*Corresponding author: Li Yurui (1983-), PhD, E-mail:liyr@igsnrr.ac.cn
Author: Wang Guogang (1984-), PhD, specialized in land sciences, agricultural economics and rural development. E-mail:caswang@126.com
Received date: 2014-06-23
Accepted date: 2014-08-20
Online published: 2015-01-15
Supported by
National Natural Science Foundation of China, No.41401203, No.41130748
Central Research Institutes of Basic Research and Public Service Special Operations, No.005201400127
Copyright
The aim of this study is to establish several important factors representing land use intensification in cultivated land (denoted by CII), using a multi-dimensional approach to achieve realistic and practical cultivated land use policies in China. For this reason, the theoretical framework was first built to explain the changes of land use intensification in the cultivated land, and then the variables and index were further developed for the purpose of characterizing the dynamic trends and driving forces of the land use intensification in the cultivated land at the provincial level. The study results indicate that the extent of CII significantly increased during the period of 1996 to 2008, due to the extensive use of fertilizers, machinery and pesticide, increased labor and capital input, and intensified land use. Moreover, the principal component regression results show that the productivity of cultivated land, economic benefits of cultivated land, labor productivity, and land use conversion are the main factors affecting the village development. The first three factors play a positive role, while the last one has a negative effect on the land use intensification in the cultivated land. According to these results, the main policies for sustainable intensification in cultivated land are proposed. First, the sustainable pathways for intensification should be adopted to reduce the unsustainable uses of chemical fertilizer, agricultural chemicals, etc. Second, the conditions for agricultural production should be further improved to increase the cultivated land productivity. Third, it is very necessary and helpful for improving labor productivity and land use efficiency from the viewpoint of accelerated the cultivated land circulation. The last step is to positively affect the production activities of peasants by means of reforming the subsidy standards.
Key words: cultivated land; land use intensification; spatial pattern; factors; China
WANG Guogang , LIU Yansui , LI Yurui , CHEN Yangfen . Dynamic trends and driving forces of land use intensification of cultivated land in China[J]. Journal of Geographical Sciences, 2015 , 25(1) : 45 -57 . DOI: 10.1007/s11442-015-1152-4
Table 1 Cropland intensive utilization evaluation indices and their meanings |
| Evaluation index | Metering method | Index description | Effect |
|---|---|---|---|
| Labor input (V1) | Labor / Cropland area | Labor input level | + |
| Fertilizer input (V2) | Fertilizer pure quantity / Cropland area | Fertilizer input intensity | + |
| Pesticide input (V3) | Pesticide usage / Cropland area | Pesticide input intensity | + |
| Mechanical input (V4) | Mechanical power / Cropland area | Mechanical use level | + |
| Agricultural expenditure per unit area of cropland (V5) | Agricultural expenditure / Cropland area | Capital input level | + |
| Multiple crop index (V6) | Total cropping area / Cropland area | Cropland use intensity | + |
| Relative abandoning index % (V7) | Note①(①Calculation method of cropland abandoning index:  in which AAI is the cropland abandoning index, MCI is the multiple crop index, and i and j respectively represent the region and year. The MCIimax indicates the maximum multiple crop index value in Region i. The cropland abandoning index mainly reflects the intensive utilization of cropland in quantity. The greater the AAI value is, the higher the cropland abandoning degree will be, otherwise it will be lower.) in which AAI is the cropland abandoning index, MCI is the multiple crop index, and i and j respectively represent the region and year. The MCIimax indicates the maximum multiple crop index value in Region i. The cropland abandoning index mainly reflects the intensive utilization of cropland in quantity. The greater the AAI value is, the higher the cropland abandoning degree will be, otherwise it will be lower.) | Cropland intensive utilization degree | - |
| Cropland change rate (V8) | (Cropland end area - base area) / Cropland end area | Cropland transition degree | - |
| Effective irrigated area proportion (V9) | Effective irrigated area / Cropland area | Irrigation fundamental infrastructure status | + |


Table 2 Total variance and rotated component matrix |
| Factors | Rotated value | Variables | ||||||||||||||||||||||||
|---|---|---|---|---|---|---|---|---|---|---|---|---|---|---|---|---|---|---|---|---|---|---|---|---|---|---|
| λ | Cumulative variance (%) | V1 | V2 | V3 | V4 | V5 | V6 | V7 | V8 | V9 | ||||||||||||||||
| 1 | 2.24 | 24.85 | 0.57 | 0.87 | 0.79 | -0.08 | 0.04 | 0.64 | -0.05 | -0.03 | 0.3 | |||||||||||||||
| 2 | 1.94 | 46.41 | 0.18 | -0.07 | 0.4 | 0.89 | 0.04 | 0.47 | 0.01 | -0.04 | 0.86 | |||||||||||||||
| 3 | 1.52 | 63.32 | 0.68 | 0.03 | 0.25 | 0.12 | -0.92 | 0.35 | 0.03 | -0.09 | -0.06 | |||||||||||||||
| 4 | 1.08 | 75.33 | -0.12 | -0.12 | 0.04 | -0.1 | -0.07 | -0.21 | 0.99 | -0.05 | 0.11 | |||||||||||||||
| 5 | 1.05 | 87.00 | 0.17 | -0.07 | 0.03 | -0.02 | 0.2 | 0.13 | -0.05 | 0.98 | -0.02 | |||||||||||||||
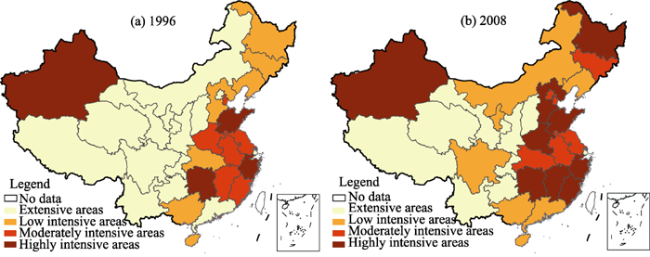
Figure 1 Spatial patterns of cultivated land intensive use during 1996-2008 at provincial level |
Figure 2 Dynamic pattern of cultivated land intensive use and shift of its gravity centers during 1996-2008 |
Table 3 The results of correlation analysis |
| Variables | Y | X1 | X2 | X3 | X4 | X5 | X6 | X7 | X8 | X9 |
|---|---|---|---|---|---|---|---|---|---|---|
| Y | 1 | |||||||||
| X1 | 0.605** | 1 | ||||||||
| X2 | 0.147* | 0.317** | 1 | |||||||
| X3 | -0.125* | -0.477** | -0.178** | 1 | ||||||
| X4 | 0.408** | -0.017 | 0.148** | 0.545** | 1 | |||||
| X5 | 0.529** | -0.276** | -0.1 | 0.689** | 0.625** | 1 | ||||
| X6 | 0.643** | 0.160** | 0.049 | 0.275** | 0.563** | 0.038 | 1 | |||
| X7 | -0.469** | -0.358** | -0.323** | 0.347** | -0.058 | 0.107 | -0.052 | 1 | ||
| X8 | 0.01 | -0.403** | -0.367** | 0.516** | 0.390** | 0.343** | 0.233** | 0.454** | 1 | |
| X9 | 0.580** | 0.764** | 0.262** | -0.182** | 0.210** | -0.106 | 0.458** | -0.151** | 0.046 | 1 |
Table 4 Rotated factor loading matrix |
| Factors | X1 | X4 | X5 | X6 | X7 | X9 |
|---|---|---|---|---|---|---|
| 1 | 0.925 | 0.055 | -0.13 | 0.188 | -0.148 | 0.913 |
| 2 | -0.134 | 0.758 | 0.963 | 0.072 | 0.025 | 0.016 |
| 3 | -0.015 | 0.568 | -0.046 | 0.962 | -0.018 | 0.306 |
| 4 | -0.242 | -0.078 | 0.075 | -0.005 | 0.985 | 0.011 |
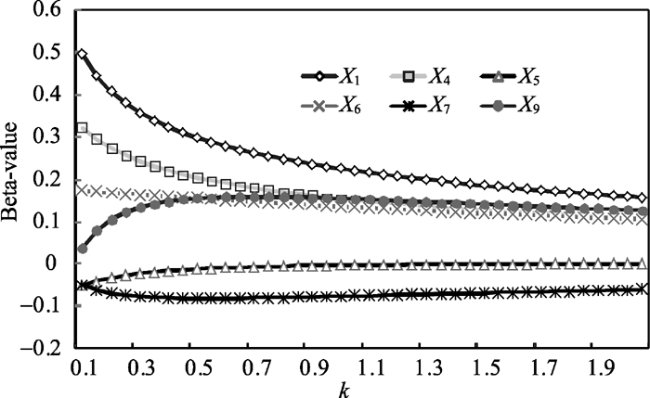
Figure 3 Ridge trace of driving factors of cultivated land intensive use |

 =0.767; R2=0.781; DF=56.01; P=0.0000)
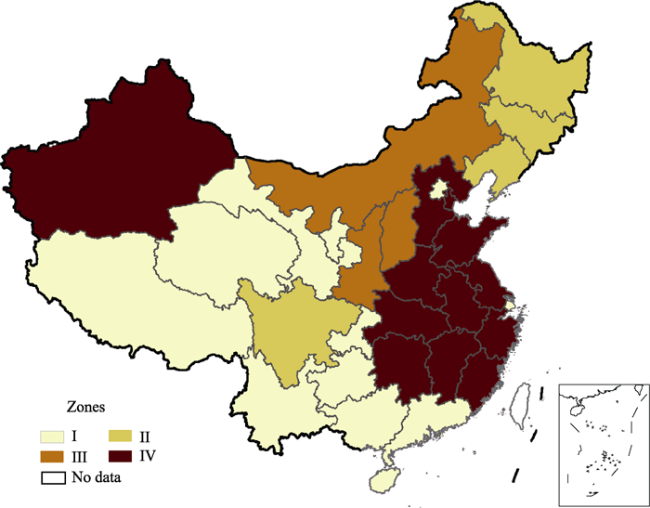
Figure 4 Divisions of cultivated land intensive use during 1996-2008 at provincial level |
The authors have declared that no competing interests exist.
| 1 |
|
| 2 |
|
| 3 |
|
| 4 |
|
| 5 |
|
| 6 |
|
| 7 |
|
| 8 |
|
| 9 |
|
| 10 |
|
| 11 |
|
| 12 |
|
| 13 |
|
| 14 |
|
| 15 |
|
| 16 |
|
| 17 |
|
| 18 |
|
| 19 |
|
| 20 |
|
| 21 |
|
| 22 |
|
| 23 |
|
/
| 〈 |
|
〉 |
