Orginal Article

Intra-annual variability of satellite observed surface albedo associated with typical land cover types in China

  • LIU Zhengjia , 1, 2 ,
  • SHAO Quanqin , 1, * ,
  • TAO Jian 1, 2 ,
  • CHI Wenfeng 1, 2
Expand
  • 1. Key Laboratory of Land Surface Pattern and Simulation, Institute of Geographic Sciences and Natural Resources Research, CAS, Beijing 100101, China
  • 2. University of Chinese Academy Sciences, Beijing 100049, China

*Corresponding author: Shao Quanqin, Professor, E-mail:

Author: Liu Zhengjia, PhD, specialized in LUCC and land surface processes. E-mail:

Received date: 2013-12-28

  Accepted date: 2014-06-09

  Online published: 2015-01-15

Supported by

National Key Basic Research Program of China (973 Program), No.2010CB950902

Copyright

Journal of Geographical Sciences, All Rights Reserved

Abstract

Surface albedo is a primary causative variable associated with the process of surface energy exchange. Numerous studies have examined diurnal variation of surface albedo at a regional scale; however, few studies have analyzed the intra-annual variations of surface albedo in concurrence with different land cover types. In this study, we amalgamated surface albedo product data (MCD43) from 2001 to 2008, land-use data (in 2000 and 2008) and land cover data (in 2000); quantitative analyses of surface albedo variation pertaining to diverse land cover types and the effect of the presence/absence of ground snow were undertaken. Results indicate that intra-annual surface albedo values exhibit flat Gaussian or triangular distributions depending upon land cover types. During snow-free periods, satellite observed surface albedo associated with the non-growing season was lower than that associated with the growing season. Satellite observed surface albedo during the presence of ground snow period was 2-4 times higher than that observed during snow-free periods. Surface albedo reference values in typical land cover types have been calculated; notably, grassland, cropland and built-up land were associated with higher surface albedo reference values than barren while ground snow was present. Irrespective of land cover types, the lowest surface albedo reference values were associated with forested areas. Proposed reference values may prove extremely useful in diverse research areas, including ecological modeling, land surface process modeling and radiation energy balance applications.

Cite this article

LIU Zhengjia , SHAO Quanqin , TAO Jian , CHI Wenfeng . Intra-annual variability of satellite observed surface albedo associated with typical land cover types in China[J]. Journal of Geographical Sciences, 2015 , 25(1) : 35 -44 . DOI: 10.1007/s11442-015-1151-5

1 Introduction

Multiple studies have reported on the adverse effects of climate change brought upon global vegetation ecosystems (Liu et al., 2011; Lawrence and Chase, 2010; Gibbard et al., 2005). Moreover, changes in vegetation ecosystem may potentially result in feedback effects on regional climate systems. Vegetation changes have impacted local surface energy exchange between the land surface and atmosphere through surface albedo variations, thus influencing local climate (Zhai et al., 2013; Cui et al., 2012; Liu et al., 2011; Loridan et al., 2011).
Surface albedo controls the net input of solar radiation arriving at the Earth’s surface (Rusell et al., 1997). Accordingly, it is significantly associated with thermal-hydrologic exchanges between the land surface and atmosphere (Betts, 2000; Jiang, 2006 Hanners and David, 2010; Xiao et al., 2011). Furthermore, it is a primary determinant with respect to the distribution of solar radiation between the Earth’s surface and the atmosphere (Wang et al., 2014). Therefore, as previously reported by several studies, surface albedo is considered a critical parameter for surface energy exchange processes. A general circulation model simulation generated by Charse et al. (1996) indicates that a decreasing leaf area index in concurrence with an increasing surface albedo results in a surface sensible heat flux increase and a latent heat flux decrease during January and July, respectively.
Pitman et al. (2009) conclude that land cover variation affects regional climate via a number of factors, including impacted surface albedo and radiative forcing, available energy partitioning, altered soil moisture profile and depth, boundary layer temperature variation and rainfall partitioning. Findell et al. (2009) have shown that the removal of natural vegetation (e.g. deforestation) is associated with decreased canopy structure and rooting depths, thus resulting in increased sensible heat flux. Therefore, considerable scientific evidence demonstrates the concurrence of land cover changes with surface albedo variation, and impacting radiative forcing. Accordingly, research related to surface albedo temporality is considered critical in furthering our current understanding of global energy exchange mechanisms.
Surface albedo variation with subsequent impact on radiative forcing may be further elevated via a process of positive feedback with ground snow (Betts, 2000). Within both climate and land surface process modeling, surface albedo is typically parameterized based upon associated land cover, with significant surface albedo differences routinely associated with the presence or absence of ground snow (Zhang et al., 2010). During snow-free periods, surface albedo is often defined as a vegetation-dependent function or as a local vegetation-based constant. During periods characterized by ground snow cover, surface albedo is either defined as a function of snow depth or a constant based on the presence of ground snow (Zhang et al., 2010). Previous studies have shown that surface albedo exhibits significant diurnal and intra-annual scale variation (Ji et al., 2003; Liu et al., 2008; Feng et al., 2010; Xiao et al., 2010). Through analysis of MODIS surface albedo products, Wang et al. (2004) have demonstrated that the temporal variation associated with surface albedo in China was distinctly correlated with land cover types. Accordingly, it is recommended that surface albedo parameterization should take a dynamic rather than static (fixed) approach.
Previous studies of land surface process parameterization have typically been undertaken at the regional scale (Liu et al., 2008; Feng et al., 2010; Xiao et al., 2010; Zhang et al., 2010; Wu et al., 2013). However, a paucity of data and understanding still exists with regard to surface albedo variation associated with diverse conditions including both land cover and land-use types, particularly at the large (i.e. national) scale. According to Wang et al. (2004), combined land cover from China and surface albedo data have not been adequately employed for the evaluation of land surface process model parameterization, which could be effectively used to increase current understanding of both terrestrial ecosystem energy and water cycles in China.
Remote sensing techniques provide a particularly efficient approach to obtaining large-scale land surface albedo data. In the current study, using surface albedo, land use and land cover data, together with statistical methods, we have addressed the following questions:
(1) How does the intra-annual surface albedo vary in different land cover types, with a particular focus on the presence or absence of ground snow?
(2) How does snow cover impact intra-annual variations of surface albedo with respect to diverse land cover types?

2 Data and methods

2.1 Land-use and land cover data

1-km-resolution land-use data were combined with land cover data for acquiring the study of land cover types using a recent classification scheme from Liu et al. (2014). Land-use data in 2000 and 2008 were acquired from the current Chinese Land-Use/Cover Datasets (CLUDs) (Liu et al., 2005; Liu et al., 2014). The primary land-use classifications include forest land, grassland, cropland, built-up land, water body and unused land. By overlaying land-use data in 2000 and 2008, unchanged land use grids were extracted. Land cover data from 2000 was acquired from WestDC (http://westdc.westgis.ac.cn/); this dataset corresponds with the IGBP classification system in 2000 (Ran et al., 2010). Subsequently, upon recombination of land cover data in 2000 with unchanged land-use data, unchanged land cover grids were extracted (Figure 1).
Figure 1 Map of China’s land cover types in 2000 (ENF: evergreen needle-leaf forest; EBF: evergreen broad-leaf forest; DNF: deciduous needle-leaf forest; DBF: deciduous broad-leaf forest; MF: mixed forests; Changed area: the changed area of land-use and land cover (without any analysis in this study)

2.2 Surface albedo

The Moderate Resolution Imaging Spectroradiometer (MODIS) platform, a key instrument aboard the Terra (EOS AM) and Aqua (EOS PM) satellites, provides an accurate representation of the Earth’s surface at diverse spatial and temporal scales. Accordingly, it is an attractive source of spatial and temporal surface albedo data. Surface albedo data from MODIS surface albedo products (V005), including MCD43B3 (data file) and MCD43B2 (quality identification documents), were acquired and employed in the current study. Land cover variation may significantly affect surface albedo (Findell et al., 2009; Pitman et al., 2009), thus surface albedo data pertaining to a relatively short temporal period (2000-2008) has been examined here. Data were characterized by a 1-km spatial resolution and an 8-day temporal resolution (http://lpdaac.usgs.gov/). All MODIS products are validated at the global scale, with appropriate inherent precision for spatio-temporal analysis of surface characteristic parameters.
Within the current study, surface albedo data (short-wave data: 0.3-5.0 μm) were processed as follows. Data quality information from MCD43B2(BRDF_Albedo_Quality/QA file) were employed to ensure sufficient data efficacy, and for selection of processed surface albedo data (QA=0). Subsequently, surface albedo data associated with periods of ground snow (identified as 1) and snow-free periods (identified as 0) were categorized based upon identification information comprised in the MCD43B2 file (Snow_BRDF_Albedo). Generally, actual surface albedo data were obtained via a weighted summation of white-sky albedo and black-sky albedo based upon a proportionate sky scatter factor (i.e. diffuse sky radiation). Several observational data sources and sets, including the scattered light ratio, solar altitude, atmospheric conditions and regression coefficients, were hardly employed to calculate the sky scatter factor at national scale (Chen et al., 2012). And these complicated processed limits surface albedo of potential application. Wang and Gao (2004) have theorized that white-sky albedo is integral to each incident angle, therefore it is close to actual surface albedo. Based on this, we employ white-sky albedo as a proxy of actual surface albedo.

2.3 Statistical methods

In order to appropriately analyze the intra-annual variation of surface albedo associated with different land cover types, periodic (8-day) annual averaged surface albedo pertaining to each grid was calculated. The average value calculation formula is:
where j is a specific land cover type; uj is surface albedo average for the jth land cover type; nj is the total number of grids assigned to the jth land cover type; Xj,i is the ith grid surface albedo for the jth land cover type.
The standard deviation (σ) of the calculation formula is:
In the current study, a specific data processing approach was developed and employed as follows:
(1) Based on unchanged land cover data, the surface albedo mean and standard deviation for each 8-day period were calculated for No.1 to No.10 land cover types (No.1 to No.10 correspond to evergreen needle-leaf forest, evergreen broad-leaf forest, deciduous needle-leaf forest, deciduous broad-leaf forest, mixed forests, shrub, grassland, cropland, built-up land and barren);
(2) Surface albedo outliers were excluded from further analysis based upon elimination of datapoints located greater than two standard deviations from the mean (Liu et al., 2014). Means and standard deviations were subsequently recalculated using data located within the ‘range of reliability’;
(3) Periodic (8-day) surface albedo means were calculated for different (n = 10) land cover types;
(4) Annual mean values of surface albedo were calculated using the aforementioned 8-day mean values, with mean surface albedo values corresponding to the growing and non-growing seasons additionally calculated.

3 Results

3.1 Intra-annual variation of surface albedo during snow-free periods

As shown in Figure 2, intra-annual surface albedo values exhibited flat Gaussian (inverted ‘U’ shape) or triangular (inverted ‘V’ shape) distributions depending upon different land cover types. Surface albedo values associated with the non-growing season were lower than those observed during the growing season. Through comparison of surface albedo values of different land cover types, we noted that barren generally displayed very high surface albedo values, while deciduous needle-leaf forest displayed very low surface albedo values. The largest numerical variation ranges of surface albedo values were between 0.194 and 0.250 in barren; grasslands were also associated with large surface albedo variation, ranging between 0.175 and 0.205. Surface albedo values associated with croplands were similar to those found in built-up land, with narrow ranges of 0.138-0.172 and 0.144-0.171, respectively. Surface albedo values associated with evergreen needle-leaf forests, evergreen broad-leaf forests, deciduous needle-leaf forests, deciduous broad-leaf forests, mixed forests and shrub also displayed narrow ranges of variance (0.095-0.132, 0.104-0.133, 0.077-0.134, 0.100-0.151, 0.095-0.140, and 0.109-0.145, respectively). Surface albedo in barren displayed the most extreme intra-annual variation of all land cover types, particularly during colder months (January, February, November and December).
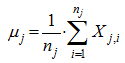
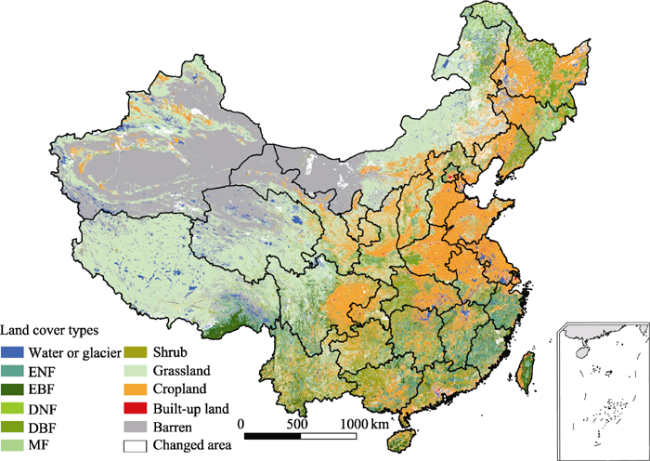
Figure 2 Intra-annual variations of surface albedo during snow-free periods in different land cover types (ENF: evergreen needle-leaf forest; EBF: evergreen broad-leaf forest; DNF: deciduous needle-leaf forest; DBF: deciduous broad-leaf forest; MF: mixed forests)

3.2 Intra-annual variation of surface albedo during snow periods

During periods with ground snow present, surface albedo values associated with grassland were very similar to those displayed in barren prior to the growing season. Upon end of the growing season, their surface albedo values were observed to gradually converge, likely due to grass growth cycles and freezing of underlying soils (Figure 3). Observed surface albedo variation ranges associated with grassland and barren were 0.486-0.627 and 0.441-0.625, respectively. During the cold season, surface albedo values relating to grassland, cropland and built-up land were greater than those observed in barren. Surface albedo values associated for forest lands appeared not to be affected by the presence of snow in any significant manner. Surface albedo changes for cropland and built-up land showed relatively consistent trends within the ranges of 0.313-0.576 and 0.326-0.547, respectively.
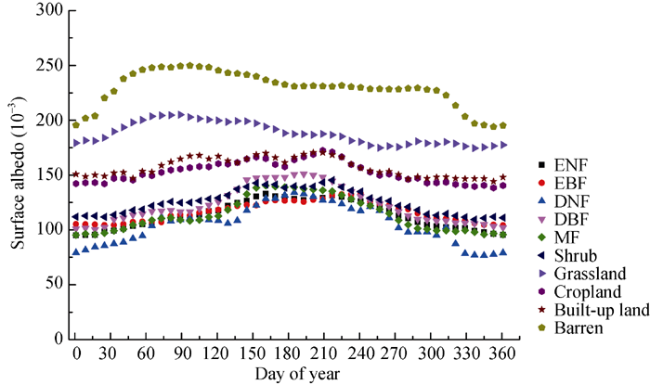
Figure 3 Intra-annual variation of surface albedo with ground snow present in different land cover types. Since statistical magnitude of pixels in the period of 113-289 (day of year) is too little with a sample size of < 500 pixels (snow-free present), they are ignored. (ENF: evergreen needle-leaf forest; EBF: evergreen broad-leaf forest; DNF: deciduous needle-leaf forest; DBF: deciduous broad-leaf forest; MF: mixed forests)

3.3 Reference values of surface albedo for different land cover types

As evidenced in Table 1, ranges of surface albedo variation differed significantly with respect to different land cover types. Results indicate that maximum surface albedo reference values are associated with barren (0.229±0.017), while minimum reference values were found within the deciduous needle-leaf forest (0.105±0.018). Variation ranges within these two land cover types were also significantly higher than those found among other land cover types. Surface albedo reference values for other land cover types ordered from high to low: grassland > built-up land > cropland > shrub > evergreen broad-leaf forest > deciduous broad-leaf forest > mixed forests > evergreen needle-leaf forest (Table 1). During both the growing season in the absence of ground snow and the non-growing season, the relative order of surface albedo reference values pertaining to different land cover types were the same to those at the intra-annual scale. Both surface albedo reference values and variation ranges for different land cover types during the growing season were greater than those exhibited during the non-growing season.
Table 1 Surface albedo reference values of diverse land cover types during three distinct time periods
Snow-free Snow
All of year Growing season Non-growing season All of year
Ave. Std. Ave. Std. Ave. Std. Ave. Std.
ENF 0.113 0.013 0.122 0.008 0.101 0.005 0.296 0.050
EBF 0.116 0.009 0.123 0.006 0.107 0.003 0.223 0.071
DNF 0.105 0.018 0.117 0.011 0.090 0.012 0.313 0.045
DBF 0.122 0.017 0.133 0.014 0.108 0.006 0.392 0.042
MF 0.114 0.016 0.124 0.013 0.101 0.005 0.294 0.043
Shrub 0.125 0.011 0.133 0.009 0.115 0.005 0.390 0.056
Grassland 0.188 0.010 0.188 0.009 0.187 0.011 0.572 0.045
Cropland 0.153 0.010 0.159 0.008 0.145 0.005 0.500 0.059
Built-up land 0.157 0.009 0.162 0.008 0.151 0.005 0.490 0.066
Barren 0.229 0.017 0.235 0.007 0.221 0.021 0.544 0.062

ENF: evergreen needle-leaf forest; EBF: evergreen broad-leaf forest; DNF: deciduous needle-leaf forest; DBF: deciduous broad-leaf forest; MF: mixed forests; Ave. is average; Std. is Standard deviation

During periods characterized by the presence of ground snow, means and standard deviations of intra-annual surface albedo were calculated for the different land cover types (Table 1). Results indicate that reference values and variation ranges during these periods are typically greater than those displayed during snow-free phases across all land cover types. Surface albedo reference values exhibited during ground snow periods were 2-4 times more than those during snow-free time phases. The maximum surface albedo reference value was associated with grassland (0.572±0.045), while the minimum value was exhibited by evergreen broad-leaf forest (0.223±0.071).

4 Discussion

4.1 Intra-annual variation analysis of surface albedo in snow-free

The observed flat Gaussian (inverted ‘U’ shape) and triangular (inverted ‘V’ shape) distributions of intra-annual surface albedo patterns in different land cover types may be associated with vegetation growth and increased air temperatures. Yan and Shen (2012) have recently reported that a positive relationship between surface albedo and air temperature was found during a study of the spatial and temporal variation characteristics of surface albedo in the middle Yellow River. Additionally, it is considered that solar altitude changes caused by varying distance between the Earth and the Sun may provide an important contribution to intra-annual surface albedo variation. Observed surface albedo values associated with barren displayed more abrupt variation at the start and end of the cold season. This is due to a lack of vegetation, with land surface water (including soil moisture) considered more vulnerable to interference from environmental factors (e.g., temperature).

4.2 Intra-annual variation analysis of surface albedo in snow

Both surface albedo variation and reference values were found to be impacted by the presence of ground snow. As shown (Figure 3), at the beginning of the cold season, surface albedo data across all land cover types exhibited rising trends; however, upon end of the cold season, gradual decreasing patterns were noted. Surface albedo values typically approached their maximum just prior to the arrival of spring; this is considered to be caused by the freezing and thawing of ground snow and resulting variation with respect to the spatial extent of ground snows. Wang and Gao (2004) have reported that surface albedo associated with new snow is greater than those associated with dirty and/or melting snow. Furthermore, they theorize that new snow albedo may be as high as 0.9, with surface albedo associated with melting and dirty snow of approximately 0.4 and 0.2, respectively. Betts (2000) has indicated that although forests are associated with a higher level of exposure a priori snow cover, croplands are often entirely covered by ground snow. Although snow cover areas within forests are typically extensive, due to high levels of reflected light scattering in the canopy, observed surface albedo associated with forests were lower than that noted in cropland. Surface albedo differences within diverse evergreen forests are likely results of varying vegetation canopy structure. During periods characterized by snow cover, surface albedo values pertaining to grassland and cropland were notably greater than those associated with barren, likely due to higher levels of reflectivity associated with new or melting snow cover.

4.3 Contrastive analysis of surface albedo reference values

Surface albedo values in concurrence with different land cover types were found to differ from previous results. Chen (1964) employed literature statistical data to develop surface albedo reference values associated with the naturally occurring vegetation. There was a deviation with 0.02-0.03 compared with our study. Using observational data from cropland (wheat) and the desert, Ji et al. (2003) analyzed monthly surface albedo variation in the Heihe area; results indicate a mean surface albedo of 0.162 during the period May-October within cropland, while a mean value of 0.269 was found within the desert during the same period. In our study, surface albedo reference values of 0.159 and 0.235 were associated with cropland and barren, respectively. Based on observation data from 2006 to 2007 in Sanjiang region, mean surface albedo in degraded grassland was 0.18 during the period May-September (Feng et al., 2010). The current study resulted in a reference surface albedo value of 0.188 associated with grasslands during the growing season. Wang et al. (2004) have analyzed surface albedo characteristics under clear skies over China via the utilization of MODIS data during snow-free periods (2002). A threshold value method was employed to distinguish between the presence and absence of ground snow. Mean surface albedo values reported in this study (Wang et al., 2004) and the current study are generally comparable. However, resultant ranges of variation differ significantly with respect to specific land cover types, although this is likely due to the use of different land cover classification schema, thus affecting statistical results. Moreover, surface albedo values ranges were also found to differ significantly. The current authors consider that the use of data extracted from MODIS (MCD43B2) to distinguish between the presence and absence of snow cover is superior to the threshold value method. Accordingly, the range of results found in the current is believed to represent a more accurate and reliable approach. Through comparative analyses of previous studies, the surface albedo reference values presented by the current study would appear to be very reasonable with respect to different land cover types, particularly in light of the use of high resolution pixel data from MODIS, adding further credibility and external verification to our findings.

5 Conclusions

In this study, we found that (1) Intra-annual surface albedo values exhibited flat Gaussian (inverted ‘U’ shape) or triangular (inverted ‘V’ shape) distributions depending on land cover types. (2) Surface albedo data in the non-growing season were lower than those of the growing season. In growing season, surface albedo reference values of evergreen needle-leaf forest, evergreen broad-leaf forest, deciduous needle-leaf forest, deciduous broad-leaf forest, mixed forests, shrub, grassland, cropland, built-up land and barren were 0.122, 0.123, 0.117, 0.133, 0.124, 0.133, 0.188, 0.159, 0.162 and 0.235, respectively. In non-growing season, surface albedo reference values of evergreen needle-leaf forest, evergreen broad-leaf forest, deciduous needle-leaf forest, deciduous broad-leaf forest, mixed forests, shrub, grassland, cropland, built-up land and barren were 0.101, 0.107, 0.090, 0.108, 0.101, 0.115, 0.187, 0.145, 0.151 and 0.221, respectively. Surface albedo in barren was the highest, but surface albedo of deciduous needle-leaf forest was the lowest due to the difference of canopy structure. (3) Owing to the impact of snow, surface albedo data in different land cover types were amplified. Surface albedo reference values of evergreen needle-leaf forest, evergreen broad-leaf forest, deciduous needle-leaf forest, deciduous broad-leaf forest, mixed forests, shrub, grassland, cropland, built-up land and barren were 0.296, 0.223, 0.313, 0.392, 0.294, 0.390, 0.572, 0.500, 0.490 and 0.544, respectively. Surface albedo reference values in snow for the various land cover types were 2-4 times more than those in snow-free period. In addition, compared with other literature data, it showed our results have high credibility. The results may provide information for modifying and optimizing the parameterization scheme of climate models and land surface process models.
Although there is significant correlation between our results and other collected observation data or statistical information, our results presented in this study also suggest that more historical data or situ observations are certainly needed to validate the results. In addition, it is noted that this study may ignore the special phenomenon in specific areas only using statistical methods to analyze ten kinds of typical land cover types.

The authors have declared that no competing interests exist.

1
Betts R A, 2000. Offset of the potential carbon sink from boreal forestation by decreases in surface albedo.Nature, 408: 187-190.

2
Chase T N, Pielke R A, Kittel T Get al., 1996. Sensitivity of a general circulation model to global changes in leaf area index.Journal of Geophysical Research, 101(D3): 7393-7408.

3
Chen A J, Liang X W, Bian L Get al., 2012. Assessment on the accuracy of MODIS albedos over the Tibetan Plateau.Transactions of Atmospheric Sciences, 35(6): 664-672. (in Chinese)

4
Chen J S, 1964. The distribution and change of surface albedo in China.Acta Geographica Sinica, 30(2): 85-93. (in Chinese)

5
Cui Y P, Liu J Y, Hu Y Fet al., 2012. Modeling the radiation balance of difference urban underlying surfaces.Chinese Science Bulletin, 57(6): 465-473. (in Chinese)

6
Feng C, Gu S, Zhao Let al., 2010. Albedo characteristics of degraded grassland ecosystem in the source region of Three Rivers in Qinghai-Tibetan Plateau.Plateau Meteorology, 29(1): 70-77. (in Chinese)

7
Findell K L, Pitman A J, England M Het al., 2009. Regional and global impacts of land cover change and sea surface temperature anomalies.Journal of Climate, 22: 3248-3269.

8
Gibbard S, Caldeira K, Bala Get al., 2005. Climate effects of global land cover change.Geophysical Research Letters, 32(23): L23705

9
Hannes P S, David N B, 2010. Integration of albedo effects caused by land use change into the climate balance: Should we still account in greenhouse gas units.Forest Ecology and Management, 260: 278-286.

10
Ji G L, Ma X Y, Zou J Let al., 2003. Characteristics of the radiation budget over oases in arid region.Arid Meteorology, 21(3): 29-33. (in Chinese)

11
Jiang X, 2006. Progress in the research of snow and ice albedo.Journal of Glaciology and Geocryology, 28(5): 728-738. (in Chinese)

12
Lawrence P J, Chase T N, 2010. Investigating the climate impacts of global land cover change in the community climate system model.International Journal of Climatology, 30(13): 2066-2087.

13
Liu J Y, Kuang W H, Zhang Z Xet al., 2014. Spatiotemporal characteristics, patterns, and causes of land-use changes in China since the late 1980s.Journal of Geographical Sciences, 24(2): 195-210.

14
Liu J Y, Shao Q Q, Yan X Det al., 2011. An overview of the progress and research framework on the effects of land use change upon global climate.Advances in Earth Science, 26(10): 1015-1022. (in Chinese)

15
Liu J Y, Tian H Q, Liu M Let al., 2005. China's changing landscape during the 1990s: Large-scale land transformations estimated with satellite data.Geophysical Research Letters, 32(2): L02405.

16
Liu Z H, Tu G, Gao X J, 2008. The characteristics of surface albedo in different semi-arid landscape.Chinese Science Bulletin, 53(10): 1220-1227. (in Chinese)

17
Liu Z J, Liu J Y, Shao Q Q, 2014. Optimum temperature of vegetation growth for various land cover types in China.Journal of Geo-information Science, 16(1): 1-7. (in Chinese)

18
Loridan T, Grimmond C S, Brian D Oet al., 2011. Local-scale urban meteorological parameterization scheme (LUMPS): Long wave radiation parameterization and seasonality-related developments.Journal of Applied Meteorology and Climatology, 50: 185-202.

19
Pitman A J, Noblet N, Cruz F Tet al., 2009. Uncertainties in climate responses to past land cover change: First results from the LUCID intercomparison study.Geophysical Research Letters, 36: L14814.

20
Ran Y H, Li X, Lu L, 2010. Evaluation of four remote sensing based land cover products over China.International Journal of Remote Sensing, 31(2): 391-401.

21
Russell M J, Nunez M, Chladil M Aet al., 1997. Conversion of nadir, narrowband reflectance in red and near-infrared channels to hemispherical surface albedo.Remote Sensing of Environment, 61(1): 16-23.

22
Wang K C, Liu J M, Zhou X Jet al., 2004. Retrieval of the surface albedo under clear sky over China and its characteristics analysis by using MODIS satellite date.Chinese Journal of Atmospheric Sciences, 28(6): 941-949. (in Chinese)

23
Wang J M, Gao F, 2004. Discussion on the problems on land surface albedo retrieval by remote sensing data.Remote Sensing technology and Application, 19(5): 295-300. (in Chinese)

24
Wang Y L, Feng J M, Gao H, 2014. Numerical simulation of the impact of land cover change on regional climate in China.Theoretical and Applied Climatology, 115(1): 141-152.

25
Wu X J, Lu A X, Wang L Het al., 2013. Spatial and temporal distribution and trend of snow albedo changes in the source region of the Yangtze River in last decade based on MODIS.Scientia Geographica Sinica, 33(3): 371-377. (in Chinese)

26
Xiao D P, Tao F L, Moiwo J P, 2011. Research progress on surface albedo under global change.Advances in Earth Science, 26(11): 217-224. (in Chinese)

27
Xiao Y, Zhao L, Li Ret al., 2010. The characteristics of surface albedo in permafrost regions of northern Tibetan Plateau.Journal of Glaciology and Geocryology, 32(3): 480-488. (in Chinese)

28
Yan Y, Shen R P, 2012. The spatial and temporal variation characteristics of surface albedo in the middle Yellow River based on remote sensing.Journal of Anhui Agricultural Sciences, 40(26): 13023-13025, 13137. (in Chinese)

29
Zhai J, Liu R G, Liu J Yet al., 2013. Radiative forcing over China due to albedo change caused by land cover change during 1990-2010.Acta Geographica Sinica, 68(7): 875-885. (in Chinese)

30
Zhang G, Zhou G S, Yang F L, 2010. Analysis on dynamic characteristics of surface albedo over a desert steppe in Inner Mongolia.Acta Ecologica Sinica, 30(24): 6943-6951. (in Chinese)

Outlines

/