Orginal Article

Impact of farmland changes on production potential in China during 1990-2010

  • LIU Luo , 1, 2, 3 ,
  • XU Xinliang , 2, * ,
  • LIU Jiyuan 2 ,
  • CHEN Xi 1 ,
  • NING Jia 2, 3
Expand
  • 1. State Key Laboratory of Desert and Oasis Ecology, Xinjiang Institute of Ecology and Geography, CAS, Urumqi 830011, China
  • 2. State Key Laboratory of Resources and Environmental Information System, Institute of Geographic Sciences and Natural Resources Research, CAS, Beijing 100101, China
  • 3. University of Chinese Academy of Sciences, Beijing 100049, China

*Corresponding author: Xu Xinliang (1972-), Associate Professor, specialized in remote sensing of natural resources and environment, land use and cover change (LUCC). E-mail:

Author: Liu Luo (1987-), PhD Candidate, specialized in research of land use and cover change (LUCC). E-mail:

Received date: 2014-03-09

  Accepted date: 2014-04-18

  Online published: 2015-01-15

Supported by

National Key Project of Scientific and Technical Supporting Programs, No.2013BAC03B01

Project of CAS Action-plan for West Development, No.KZCX2-XB3-08-01

Important National Project of High-resolution Earth Observation System, No.05-Y30B02-9001-13/15-10

Copyright

Journal of Geographical Sciences, All Rights Reserved

Abstract

The quantity and spatial pattern of farmland has changed in China, which has led to a major change in the production potential under the influence of the national project of ecological environmental protection and rapid economic growth during 1990-2010. In this study, the production potential in China was calculated based on meteorological, terrain elevation, soil and land-use data from 1990, 2000 and 2010 using the Global Agro-ecological Zones model. Then, changes in the production potential in response to farmland changes from 1990 to 2010 were subsequently analyzed. The main conclusions were the following. First, the total production potential was 1.055 billion tons in China in 2010. Moreover, the average production potential was 7614 kg/ha and showed tremendous heterogeneity in spatial pattern. Total production in eastern China was high, whereas that in northwestern China was low. The regions with high per unit production potential were mainly distributed over southern China and the middle and lower reaches of the Yangtze River. Second, the obvious spatiotemporal heterogeneity in farmland changes from 1990 to 2010 had a significant influence on the production potential in China. The total production potential decreased in southern China and increased in northern China. Furthermore, the center of growth of the production potential moved gradually from northeastern China to northwestern China. The net decrease in the production potential was 2.97 million tons, which occupied 0.29% of the national total actual production in 2010. Third, obvious differences in the production potential in response to farmland changes from 1990 to 2000 and from 2000 to 2010 were detected. The net increase in the production potential during the first decade was 10.11 million tons and mainly distributed in the Northeast China Plain and the arid and semi-arid regions of northern China. The net decrease in the production potential during the next decade was 13.08 million tons and primarily distributed in the middle and lower reaches of the Yangtze River region and the Huang-Huai-Hai Plain. In general, the reason for the increase in the production potential during the past two decades might be due to the reclamation of grasslands, woodlands and unused land, and the reason for the decrease in the production potential might be urbanization that occupied the farmland and Green for Grain Project, which returned farmland to forests and grasslands.

Cite this article

LIU Luo , XU Xinliang , LIU Jiyuan , CHEN Xi , NING Jia . Impact of farmland changes on production potential in China during 1990-2010[J]. Journal of Geographical Sciences, 2015 , 25(1) : 19 -34 . DOI: 10.1007/s11442-015-1150-6

1 Introduction

Food is a specialized commodity and a strategic reserve, which relates directly to a country’s well-being. Food security is an important part of national security. As a populous developing country, China’s food security, which has attracted worldwide attention, also has an important influence on world food security. Many factors influence grain production, including institutional and political innovations, scientific and technological progress, material and labor inputs, farmland, and climate change (Song et al., 2009; Liu and Wu, 2002; Zeng et al., 2006). Farmland is the basic material condition of yield, and changes in its quantity and quality directly influence grain yields and the effectiveness of the grain supply. Along with the accelerating process of industrialization, urbanization, and construction of ecological civilization, farmland has increasingly received competition from industrial and urban land, and nonagricultural conversion of some farmland is inevitable, which has influenced the food security of China severely and has drawn broad attention worldwide (Fu et al., 2001).
Farmland in China has gone through changes in area, quality, and spatial distribution due to reclamation, urbanization, and the Green for Grain Project during the past 20 years. Many studies have examined the impacts of regional change in farmland on grain production worldwide. For example, Liu et al. (2005) analyzed the impacts of the land use and land-cover change (LUCC) process on potential light-temperature production and its regional differences during the 1990s in China. Qin et al. (2013) analyzed the impacts of China’s urbanization process and the Green for Grain Project on spatial distribution and production of farmland, while Shi et al. (2008) investigated the impacts of the quantity, quality, and cropping systems on grain production in northeastern China. Xu et al. (2007) revealed the impacts of climate fluctuations and the LUCC process on production potential in northeastern China. Previous studies have focused mainly on the issue of regional farmland changes, grain production, and security. However, further exploration of the global crisis of food security is needed to systematically reveal the pattern and trend in farmland conversion, and the resulting changes in production potential and its regional differences at the national macro-level (Xu et al., 2003). In 2009, the Chinese government began to examine the national production potential and its regional differences, and scientifically analyzed and estimated changes in land production. Therefore, summarizing the spatiotemporal process of Chinese farmland, and to correctly understand the change in grain production and its regional distribution, is of great strategic significance in understanding the rules of supply and demand for farmland, as well as the relationship between farmland changes and food security to consolidate the basis of grain production and to ensure food security.
We comprehensively estimated the production potential based on farmland data from 1990, 2000 and 2010 using meteorological data from the past 30 years, as well as soil data and Digital Elevation Model (DEM) data. We also used the Global Agro-ecological Zones (GAEZ) model and considered light, temperature, water, CO2 concentration, diseases and insect pests, climatic limitations, soil, and terrain. The change in production potential and its spatial distribution and causes were analyzed to reveal the spatial pattern of impacts of Chinese farmland changes on grain production.

2 Materials and methods

2.1 Data sources

The input data for this study included farmland, terrain elevation, soil, and meteorological data. The farmland data included those from 1990, 2000 and 2010, which were extracted from the land-use database developed by the Chinese Academy of Sciences. This database is a multi-temporal land-use data set covering land areas of China with a mapping scale of 1:100,000, which was developed through years of accumulation under the support of several major scientific and technological projects, such as the National Key Technology Research and Development Program of the Ministry of Science and Technology of China and the Main Direction Program of Knowledge Innovation of the Chinese Academy of Sciences (Liu et al., 2003; Liu et al., 2005a; Liu et al., 2005b; Liu et al., 2010; Liu et al., 2012; Liu et al., 2014). The primary source for the land-use database was Landsat TM/ETM images, which were processed into land-use data by manual visual interpretation. The land-use data were classified into 25 categories, which were subsequently grouped into six classes of cropland, woodland, grassland, water bodies, built-up areas, and unused land. Through field verifications, the general evaluating precision of each class was >94.3%, satisfying the accuracy requirement of 1:100,000 mapping.
The terrain elevation data set derived from the shuttle radar topography mission (SRTM) C-band data was the first publicly available near-global, high-resolution raster DEM. SRTM data have been used for environmental analyses in numerous previous studies because of their fidelity and free access (Shortridge and Messina, 2011).
Meteorological data for 1980-2010, including monthly maximum air temperature, minimum air temperature, precipitation, relative humidity, wind speed at 10 m height, and hours of sunshine, were obtained from more than 760 national meteorological stations maintained by the Chinese Meteorological Administration. The monthly data for the above six key plant growth factors were interpolated to a 1-km resolution using ANUSPLIN software based on the digital terrain model of China (Hutchinson, 1995; Hutchinson, 1998a; Hutchinson, 1998b).
Soil data were obtained from a nationwide soil data set at a scale of 1:1,000,000, which was provided by the Data Center for Resources and Environmental Sciences at the Chinese Academy of Sciences. The attributes included type, constituents, depth, and water-holding capacity.

2.2 Methodology

2.2.1 Farmland change analysis method
First, the characteristics of farmland area and spatial distribution were obtained from 1990, 2000 and 2010 farmland data using GIS spatial analysis methods. We obtained the characteristic changes in area and spatial distribution between 1990-2000 and 2000-2010, as well as the characteristics of conversion between farmland and land of other types, such as farmland expansion caused by reclamation of forest and grassland, and farmland loss due to urbanization.
2.2.2 Production potential simulation method
Production potential was estimated using the GAEZ model, which is a large-scale model developed by the Food and Agriculture Organization and the International Institute for Applied Systems Analysis over the past 30 years. The GAEZ model estimates the meteorological suitability of some kinds of crops based on climatic conditions and then calculates the production potential using a stepwise limiting method, including the light production potential (only limiting light), light and temperature production potential (limiting light and temperature), climatic production potential (limiting light, temperature, and water), the land production potential (limiting light, temperature, water, and soil), and the agricultural production potential (e.g., limiting agricultural input level, management methods) (Fischer et al., 2005; Fischer et al., 2006; Fischer and Sun, 2001; Fischer et al., 2008; Fischer et al., 2007; Fischer et al., 2002). In this study, the production potential under the average climatic conditions during 1980-2010 was calculated using the GAEZ model, which mainly considered wheat (four subspecies), maize (four subspecies), rice (two subspecies), sweet potato, and soybean (Figure 1). These five crops are major crops in China, providing 97.7% of the country’s total grain output (Chen et al., 2012). We felt that the irrigation conditions were appropriate for rice because most rice crops are cultivated under irrigation. We considered both irrigated and rain-fed conditions for other crops.
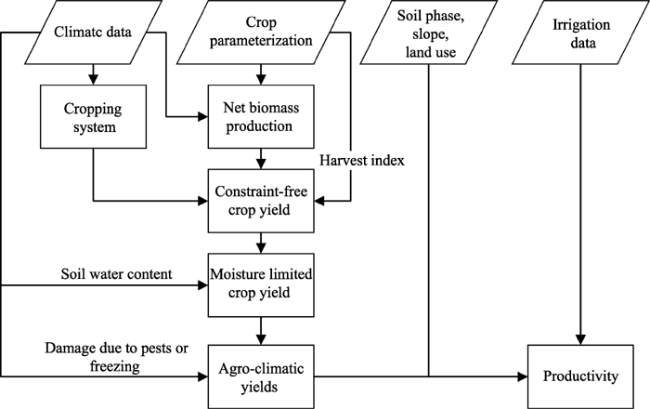
Figure 1 Schematic diagram of the overall structure and data integration of the Global Agro-ecological Zones model
The use of multiple cropping systems in China has been considered to calculate the production potential (Yan et al., 2012). Based on the potential cropping system calculated by the GAEZ model and the practical cropping systems in China, the maximum production potential was determined using multiple cropping system combinations (including double cropping per year, triple cropping for two years, and triple cropping per year).
The GAEZ model included irrigated and rain-fed scenarios. Calculations of the production potential for the rain-fed scenarios were based on light, temperature, and water conditions, whereas those for the irrigation scenarios only used the light and temperature conditions assuming sufficient water for crop growth and no water stress. The equation used to calculate crop yields within each grid cell under the rain-fed and irrigated scenarios was (Tatsumi et al., 2011)
yieldtotal = yieldrain-fed × (1 - I) + yieldirrigated × i
where yieldtotal is the production potential within each grid cell (kg/ha), yieldrain-fed is the yield under rain-fed scenarios within each grid cell (kg/ha), yieldirrigated is the yield under irrigated scenarios within each grid cell (kg/ha), and i (%) is the ratio of irrigation-cultivated area to total cultivated area based on official statistics from the National Bureau of Statistics of China.

3 Results

3.1 Verification

The calculated production potential in 2010 was compared with the actual production as reported in official statistics for 2010 to verify the accuracy of the calculated results. The average production potential in 2010 was 8.32 tons/ha, which was nearly 1.55 times the actual production. The correlation between the calculated production potential and actual production is shown in Figure 2. The cross- correlation coefficient was 0.82, and the standard deviation was 7400 tons, indicating a good correlation, and the actual production equaled 65.4% of the calculated production potential. Consequently, the trend in the calculated production potential reflected the trend in actual production.
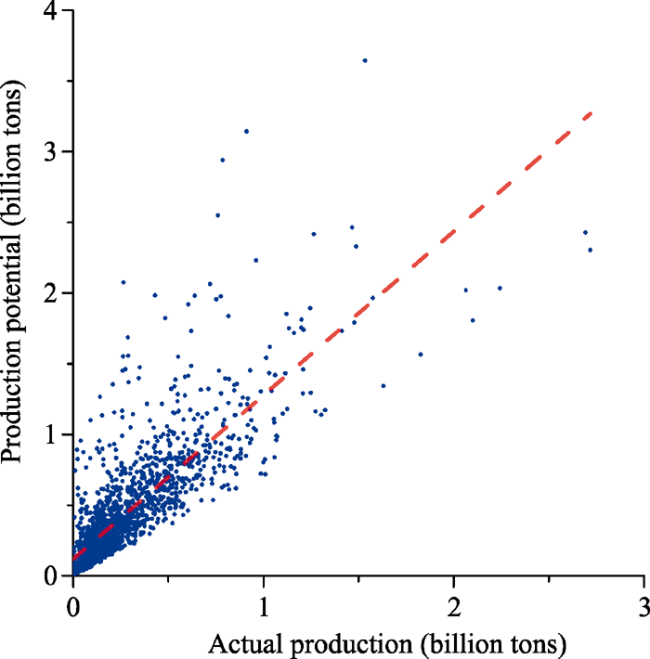
Figure 2 Comparison between potential and actual production in each county in 2010

3.2 Spatial patterns of the production potential in China

The impacts of farmland change on the production potential during 1980-2010 were analyzed using monthly average meteorological factors under the assumption that climatic conditions, terrain elevation, and soil conditions remained unchanged.
In 2010, the total production potential in China was 1.06 billion tons, and the average production potential was 7.61 tons/ha. The spatial pattern of the production potential showed an upward trend from north to south and from west to east (Figure 3), which was mainly due to the uneven distribution of farmland in China. Specifically, it is flat, fertile, and has suitable hydrothermal conditions in the east, whereas the western area has more complex terrain, degraded soil, and worse hydrothermal conditions. The middle-lower Yangtze Plain had the most production potential of 328.43 million tons and was also the area with the fastest economic development and most severe land-use contradictions. In contrast, the area with the least total production potential was the Qinghai-Tibet Plateau at 2.13 million tons, which has a comparatively scarce population, a small area of cropland of poor quality, and unsuitable hydrothermal conditions. The maximum production potential was 25.99 tons/ha, which was much higher than that of other areas in China that had profuse rainfall, suitable temperature, relatively high solar radiation, and a long growth period. The area with the greatest average production potential was the middle-lower Yangtze Plain at 12.09 tons/ha (Figure 4).
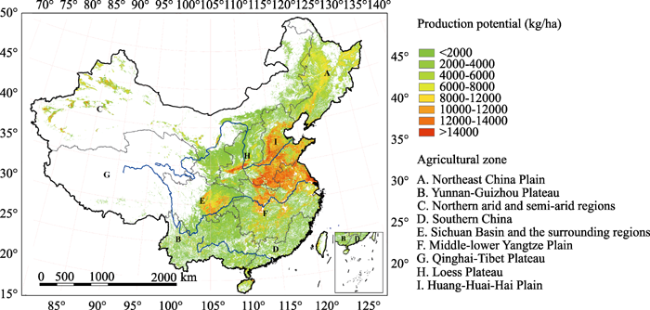
Figure 3 Map of the production potential for farmland in China in 2005
Figure 4 Production potential in 2010

3.3 Impacts of farmland change on the production potential

3.3.1 Characteristics of farmland change in China during 1990-2010
The total area of farmland in China has remained fundamentally unchanged during the past 20 years, but it showed different characteristics of change between the first and second decades. The area of farmland increased by 28,300 km2 during the first decade, with an increase in the north and a decrease in the south. The areas with an increasing production potential were mainly located to east of the northern arid and semi-arid regions, whereas areas with a decreasing production potential were located mainly in the middle-lower Yangtze Plain (Figure 5). During the second decade, the area of farmland decreased by 10,200 km2, mainly due to the expansion of land for residential areas, mining in eastern coastal areas, and the Green for Grain Project, which returned farmland to forests and grasslands in the central and western ecologically fragile regions, as well as farmland reclamation in some areas in the northern arid and semi-arid regions (Figure 5).
Urbanization was the main cause for the farmland decrease in China during the past 20 years. The area of farmland occupied by urbanization accounted for 45.96% during the first decade and 55.44% during the second decade. The annual rate of conversion from farmland to construction land has increased from about 2 million units per year during the first decade to more than 3 million units per year during the second decade, indicating the obvious contradiction between farmland protection and urbanization. The conversion among forests, grassland, and farmland was another main cause for the change in farmland area. Because of conversion, the area of farmland increased by 40,500 km2 during the first decade and 9,300 km2 during the second decade, indicating more attention was drawn to environmental protection and the Green for Grain Project.
3.3.2 Impacts of farmland changes on the production potential
During the past 20 years, the basic characteristics of the production potential change led by farmland changes were as follows. The total amount of production potential decreased, with a decrease in the north and an increase in the south. The center of the newly increased area began to move from the northeast to the northwest. The production potential increased by 45.89 million tons, then decreased by 48.86 million tons. The net decrease was 2.97 million tons, accounting for 0.29% of the total yield of China in 2010 (Table 1).
The net increase in production potential led by farmland change was 10.11 million tons during the first decade. The total increase in production potential was 1.4 times the total decrease. However, the net increase was at the cost of losing traditional farmland resources and destroying the natural environment. The increase was mainly distributed in the Northeast China Plain and the northern arid and semi-arid regions, accounting for 47.8% and 40.0%, respectively, of the total increase. The increase was mainly due to reclamation of forests and grasslands, which accounted for 81.5% of the total increase. The decrease was mainly distributed in the middle-lower Yangtze Plain, northern arid and semi-arid regions, and the Huang-Huai-Hai Plain, accounting for 27.8%, 25.8%, and 23.5%, respectively, of the total decrease. The decrease was mainly due to urbanization, accounting for 52.8% of the total reduction (Figure 7). Returning farmland to forests and grasslands was another reason for 32.3% of the total decrease.
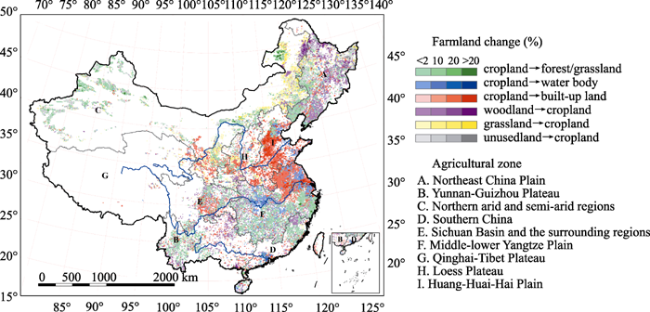
Figure 5 Map of the farmland changes in China from 1990 to 2000
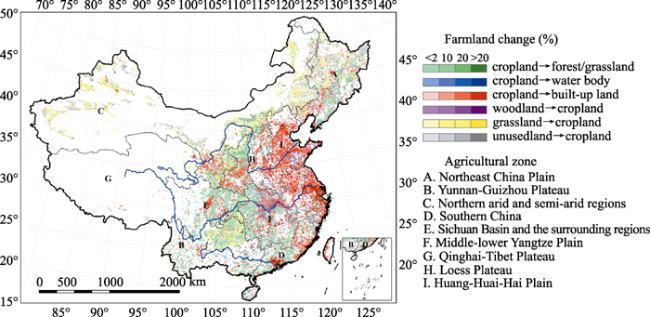
Figure 6 Map of the farmland changes in China from 2000 to 2010
The net decrease in the production potential led by farmland change was 13.08 million tons during the second decade. The total decrease in production potential was 2.19 times the total increase. The increase was mainly distributed in the middle-lower Yangtze Plain and the Huang-Huai-Hai Plain, accounting for 38.0% and 22.6%, respectively, of the total decrease, which was mainly due to urbanization that accounted for 66.0% of the total reduction. The increase was mainly distributed in northern arid and semi-arid regions, accounting for 64.1% of the total increase. The increase was mainly due to the reclamation of unused land and grassland, accounting for 48.7% and 27.3%, respectively (Figure 8).
The impacts of farmland change on the production potential showed obvious regional differences during the past 20 years. The regional characteristics of the impacts are as follows (Tables 2 and 3).
In the Northeast China Plain, the production potential during the past 20 years increased by 19.17 million tons, decreased by 3.78 million tons, and the net increase was 15.39 million tons. During the first decade, the production potential increased by 16.72 million tons, decreased by 2.22 million tons, and the net increase was 14.50 million tons. The increase and net increase were the first in China, mainly due to the reclamation of forests and grasslands in the north as well as returning farmland to forests and grasslands in the central part. During the second decade, the production potential increased by 2.45 million tons, decreased by 1.56 million tons, and the net increase was 0.89 million tons, mainly due to reclamation of unused land, forests, and grasslands. At the same time, returning farmland to forests and grasslands, and urbanization also constrained the increase.
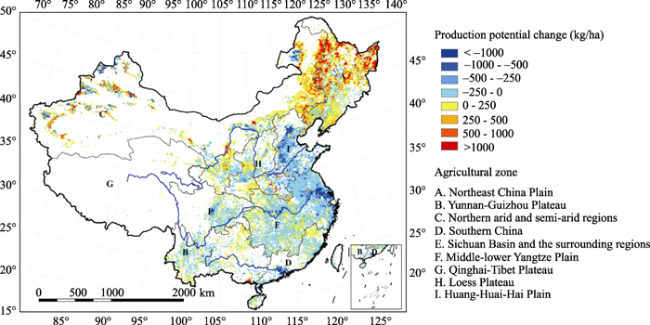
Figure 7 Map of the changes in the farmland production potential in China from 1990 to 2000
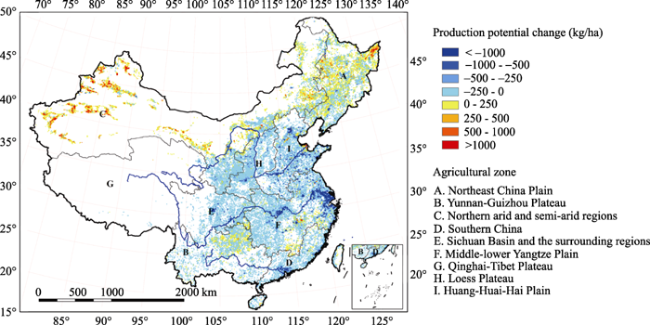
Figure 8 Map of the changes in the farmland production potential in China from 2000 to 2010
Table 1 Distribution of changes in farmland potential productivity in China during 1990-2010
Period Change type Main causes Total change
(million tons)
Proportion
(%)
Spatial distribution
1990-2000 Increase Farmland expansion (forest and grassland reclamation), accounting for 81.5% of the total increase 34.8689 3.30 Mainly distributed in the Northeast China Plain and northern arid and semi-arid regions (Figure 5), accounting for 47.8% and 40.0%, respectively
Decrease Urban sprawl and the Green for Grain Project that returns farmland to forests and grasslands, accounting for 52.8% and 32.3%, respectively of the total decrease -24.7589 -2.34 Mainly distributed in the middle-lower Yangtze Plain, northern arid and semi-arid regions, and the Huang-Huai-Hai Plain (Figure 5), accounting for 27.8%, 25.8%, and 23.5%, respectively
2000-2010 Increase Reclamation of unused land and grassland, accounting for 48.7% and 27.3%, respectively, of the total increase 11.0183 1.03 Mainly distributed in the northern arid and semi-arid regions (Figure 6), accounting for 64.1% of the total decrease
Decrease Urban sprawl, accounting for 66.0% of the total decrease -24.1028 -2.26 Mainly distributed in the middle-lower Yangtze Plain and Huang-Huai-Hai Plain (Figure 6), accounting for 38.0% and 22.6%, respectively, of the total decrease
The production potential in the Yunnan-Guizhou Plateau during the past 20 years increased by 0.96 million tons, decreased by 1.49 million tons, and the net decrease was 0.53 million tons. During the first decade, the production potential increased by 0.72 million tons, decreased by 0.76 million tons, and the net decrease was 0.04 million tons. In this area, conversion among forests, grasslands, and farmland was frequent. Despite slight expansion of construction land, the general potential was stable. The production potential during the second decade increased by 0.24 million tons, decreased by 0.72 million tons, and the net decrease was 0.48 million tons, mainly due to returning farmland to forests and grasslands and construction land expansion along with some grassland reclamation.
Table 2 Impacts of regional farmland change potential productivity in China during 1990-2000
In the northern arid and semi-arid regions, the production potential during the past 20 years increased by 20.86 million tons, decreased by 8.64 million tons, and the net increase was 12.22 million tons. During the first decade, the production potential increased by 13.80 million tons, decreased by 6.37 million tons, and the net increase was 7.43 million tons, mainly due to a large amount of grassland reclamation. At the same time, the Green for Grain Project, which returns farmland to forests and grasslands, brought noticeable achievements in the middle Yellow River basin and some parts of the Hetao Plain. The production potential during the second decade increased by 7.06 million tons, decreased by 2.27 million tons, and the net increase was 4.79 million tons, mainly due to reclamation of grasslands and unused land in Xinjiang. However, returning farmland to grassland also occurred in central China.
Table 3 Impacts of regional farmland change on potential productivity in China during 2000-2010
The production potential in southern China during the past 20 years increased by 0.33 million tons, decreased by 3.24 million tons, and the net decrease was 2.91 million tons. During the first decade, the production potential increased by 0.24 million tons, decreased by 1.34 million tons, and the net decrease was 1.09 million tons, mainly due to returning farmland to forests and lakes as well as urbanization. The production potential during the second decade increased by 0.08 million tons, decreased by 1.90 million tons, and the net decrease was 1.82 million tons, mainly due to urbanization.
The production potential during the past 20 years in the Sichuan Basin and surrounding regions increased by 0.11 million tons, decreased by 1.92 million tons, and the net decrease was 1.81 million tons. During the first decade, the production potential increased by 0.10 million tons, decreased by 0.67 million tons, and the net decrease was 0.57 million tons, mainly distributed in the east and due to urbanization. During the second decade, the production potential increased by 0.02 million tons, decreased by 1.25 million tons, and the net decrease was 1.23 million tons, primarily due to urbanization in the east.
Production potential in the middle-lower Yangtze Plain during the past 20 years increased by 1.47 million tons, decreased by 16.02 million tons, and the net decrease was 14.56 million tons. The production potential during the first decade increased by 0.90 million tons, decreased by 6.86 million tons, and the net decrease was 5.97 million tons. The production potential during the second decade increased by 0.57 million tons, decreased by 9.16 million tons, and the net decrease was 8,595.97 million tons. In this area, the decrease and the net decrease were the first in China, mainly due to urbanization and returning farmland to lakes.
The production potential in the Qinghai-Tibet Plateau during the past 20 years increased by 0.12 million tons, decreased by 0.09 million tons, and the net increase was 0.03 million tons. The production potential during the first decade increased by 0.10 million tons, decreased by 0.03 million tons, and the net increase was 0.07 million tons. The production potential during the second decade increased by 0.02 million tons, decreased by 0.06 million tons, and the net decrease was 0.05 million tons. The farmland area has remained basically stable in this region.
The production potential in the Loess Plateau during the past 20 years increased by 0.67 million tons, decreased by 2.43 million tons, and the net decrease was 1.76 million tons. The production potential during the first decade increased by 0.55 million tons, decreased by 0.69 million tons, and the net decrease was 0.14 million tons. The production potential during 2000-2012 increased by 0.13 million tons, decreased by 1.74 million tons, and the net decrease was 1.61 million tons, mainly due to returning farmland to forests and grasslands, as well as urbanization.
The production potential in the Huang-Huai-Hai Plain during the past 20 years increased by 1.29 million tons, decreased by 11.25 million tons, and the net decrease was 9.06 million tons. The production potential during the first decade increased by 1.74 million tons, decreased by 5.81 million tons, and the net decrease was 4.07 million tons. The production potential during the second decade increased by 0.45 million tons, decreased by 5.44 million tons, and the net decrease was 4.99 million tons, mainly due to urbanization along with reclamation of forests, grasslands and lakes in the south.

4 Conclusions and discussion

4.1 Conclusions

The quantity and spatial pattern of farmland has changed, which has led to major changes in the production potential under the influence of the national project of ecological environmental protection and rapid economic growth during the last two decades. We analyzed the spatial characteristics and production potential of five major crops in China using the GAEZ model and their impacts on farmland change during 1990-2000 and 2000-2010 in China. The conclusions are as follows:
(1) Total production potential in China in 2010 was 1.055 billion tons, and the average production potential was 7,614 kg/ha. The production potential showed tremendous heterogeneity in spatial patterns. Production in eastern China was high, whereas that in northwestern China was low. The high-value production potential region was mainly distributed over southern China and the middle and lower reaches of the Yangtze River.
(2) The obvious spatiotemporal heterogeneity of farmland change from 1990 to 2010 had a significant influence on the production potential in China. The production potential decreased in southern China and increased in northern China. Furthermore, the center of the growth of production potential moved gradually from northeastern to northwestern China. The net decrease in production potential was 2.97 million tons, which occupied 0.29% of total national production.
(3) An obvious difference in the production potential in response to farmland change between the two periods of 1990-2000 and 2000-2010 was detected. During the first decade, the net increase in farmland area was 10.11 million tons and mainly distributed in the Northeast China Plain and the arid and semi-arid regions of northern China. During the next decade, the net decrease in farmland area was 13.08 million tons and primarily distributed in the middle and lower reaches of the Yangtze River region and the Huang-Huai-Hai Plain. In general, the reason for the increased production potential during the last two decades might be due to the reclamation of grassland, woodland, and unused land, and the reason for the decrease in production potential might be from the urbanization that occupied farmland and the Green for Grain Project that returned farmland to forests and grasslands.

4.2 Discussion

Finally, we note the limitations of this study. (1) Extreme weather conditions were not considered, although they may have had an extreme effect on the production potential. (2) The irrigation scenario in this study assumed a sufficient supply of water for crop growth, but the actual availability of water provided by irrigation still poses limitations on crop growth in actual practice. (3) The selection of crop species and cropping systems was determined while ignoring farmers’ financial interests.
Farmland area in China has generally decreased continually since 2000. The conversion from cropland to nonagricultural land has led to a downward trend in the total production potential (Jiang et al., 2010). Therefore, correctly determining the production potential and its regional differences, and the impacts of farmland change on the production potential, is of great importance in protecting safe baseline of farmland, maintaining stability of the total farmland area, ensuring food security, and managing land resources. Farmland area in China may continually decrease in the future under the influence of constructing an ecological security barrier, and civilization and urbanization. Therefore, constantly developing, promoting, updating, and restoring farmland production is a crucial way to ensure food security based on an understanding of the impacts of farmland loss on the production potential and proper control of cropland conversion (Gao et al., 2005).

The authors have declared that no competing interests exist.

1
Chen Yinjun, Yi Xiaoyan, Fang Linnaet al., 2012. Analysis for arable land resource and its grain production capacity in China.Chinese Journal of Agricultural Resources and Regional Planning, 33(6): 4-10. (in Chinese)

2
Fischer G, Shah M, Tubiello F Net al., 2005. Socio-economic and climate change impacts on agriculture: An integrated assessment, 1990-2080.Philosophical Transactions of the Royal Society B: Biological Sciences, 360(1463): 2067-2083.

3
Fischer G, Shah M, Velthuizen Het al., 2006. Agro-ecological zones assessments. Land Use and Land Cover. Encyclopedia of Life Support Systems (EOLSS), Developed under the Auspices of the UNESCO. Oxford, UK: Eolss Publishers.

4
Fischer G, Sun L X, 2001. Model based analysis of future land-use development in China.Agriculture Ecosystems & Environment, 85(1): 163-176.

5
Fischer G, Teixeira E, Hizsnyik E Tet al., 2008. Land use dynamics and sugarcane production. Sugarcane Ethanol: Contribution to Climate Change Mitigation and the Environment. Wageningen Academic, Wageningen, 29-62.

6
Fischer G, Tubiello F N, Van Velthuizen Het al., 2007. Climate change impacts on irrigation water requirements: effects of mitigation, 1990-2080.Technological Forecasting and Social Change, 74(7): 1083-1107.

7
Fischer G, Van Velthuizen H, Shah Met al., 2002. Global agro-ecological assessment for agriculture in the 21st century: Methodology and results. International Institute for Applied Systems Analysis.

8
Fu Zeqiang, Cai Yunlong, Yang Youxiaoet al., 2001. Research on the relationship of cultivated land change and food security in China.Journal of Natural Resources, 16(4): 313-319. (in Chinese)

9
Gao Z, Liu J, Cao Met al., 2005. Impacts of land-use and climate changes on ecosystem productivity and carbon cycle in the cropping-grazing transitional zone in China.Science in China Series D: Earth Sciences, 48(9): 1479-1491.

10
Hutchinson M F, 1995. Interpolating mean rainfall using thin plate smoothing splines.International Journal of Geographical Information Systems, 9(4): 385-403.

11
Hutchinson M F, 1998a. Interpolation of rainfall data with thin plate smoothing splines. Part II: Analysis of topographic dependence.Journal of Geographic Information and Decision Analysis, 2(2): 152-167.

12
Hutchinson M F, 1998b. Interpolation of rainfall data with thin plate smoothing splines. Part I: Two dimensional smoothing of data with short range correlation.Journal of Geographic Information and Decision Analysis, 2(2): 139-151.

13
Jiang Qunou, Deng Xiangzheng, Lin Zhiyinget al., 2010. Impacts of cultivated land conversion on cultivated land productivity in China: Prediction and analysis.Chinese Journal of Applied Ecology, 21(12): 3113-3119. (in Chinese)

14
Liu J, Kuang W, Zhang Zet al., 2014. Spatiotemporal characteristics, patterns, and causes of land-use changes in China since the late 1980s.Journal of Geographical Sciences, 24(2): 195-210.

15
Liu J, Liu M, Tian H Met al., 2005. Spatial and temporal patterns of China's cropland during 1990-2000: An analysis based on Landsat TM data.Remote Sensing of Environment, 98(4): 442-456.

16
Liu J, Liu M, Zhuang Det al., 2003. Study on spatial pattern of land-use change in China during 1995-2000. Science in China Series D: Earth Sciences, 46(4): 373-384.

17
Liu J, Tian H, Liu Met al., 2005. China's changing landscape during the 1990s: Large-scale land transformations estimated with satellite data. Geophysical Research Letters, 32(2).

18
Liu J, Zhang Q, Hu Y, 2012. Regional differences of China’s urban expansion from late 20th to early 21st century based on remote sensing information.Chinese Geographical Science, 22(1): 1-14.

19
Liu J, Zhang Z, Xu Xet al., 2010. Spatial patterns and driving forces of land use change in China during the early 21st century.Journal of Geographical Sciences, 20(4): 483-494.

20
Liu Jiyuan, Xu Xinliang, Zhuang Dafanget al., 2005. Impact of LUCC on light-temperature potential production in 1990s. Science in China Series D:Earth Sciences, 35(6): 483-492. (in Chinese)

21
Liu Yansui, Wu Chuanjun, 2002. Situation of land-water resources and analysis of sustainable food security in China.Journal of Natural Resources, 17(3): 270-275. (in Chinese)

22
Qin Y, Yan H, Liu Jet al., 2013. Impacts of ecological restoration projects on agricultural productivity in China.Journal of Geographical Sciences, 23(3): 404-416.

23
Shi S, Chen Y, Yao Yet al., 2008. Impact assessment of cultivated land change upon grain productive capacity in Northeast China.Acta Geographica Sinica, 63(6): 574-586. (in Chinese)

24
Shortridge A, Messina J, 2011. Spatial structure and landscape associations of SRTM error.Remote Sensing of Environment, 115(6): 1576-1587.

25
Song W, Chen B M, Chen X W, 2009. Evaluation for use efficiency of agricultural resources in grain production: A case study of Changshu, Taihe and Ansai in China.Chinese Geographical Science, 19(1): 46-54.

26
Tatsumi K, Yamashiki Y, Valmir da Silva Ret al., 2011. Estimation of potential changes in cereals production under climate change scenarios.Hydrological Processes, 25(17): 2715-2725.

27
Xu Xiaoli, Shi Peijun, Yang Mingchuan, 2003. The impact of the national land policy on the sustainable arable land use in China since 1949. Journal of Beijing Normal University (Social Science Edition), (2): 115-123. (in Chinese)

28
Xu Xinliang, Liu Jiyuan, Cao Mingkuiet al., 2007. Impact of recent climate fluctuation and LUCC process on potential productivity for crops in Northeast China.Scientia Geographica Sinica, 27(3): 318-324. (in Chinese)

29
Zeng Kejun, Chen Yi, Gao Zhongguiet al., 2006. Study on the relationship of cultivated land change and food security in Yangtze River Delta.Geography and Geo-Information Science, 22(6): 58-61. (in Chinese)

Outlines

/