
Journal of Geographical Sciences >
Spatio-temporal characteristics of intra-urban land cover in the cities of China and USA from 1978 to 2010
*Corresponding author: Kuang Wenhui (1978-), Associate Professor, specialized in land use and cover change (LUCC) and urban ecology and environment. E-mail:kuangwh1978@sina.com
Author: Chi Wenfeng, PhD, specialized in land use and cover change. E-mail:chiwenfeng2005@126.com
Received date: 2014-06-05
Accepted date: 2014-08-15
Online published: 2015-01-15
Supported by
National Natural Science Foundation of China, No.41371408
National High-Tech R&D Program of China, No.2013AA122802
National Basic Research Program of China, No.2010CB950900
No.2014CB954302
National Key Technology R&D Program, No.2012BAJ15B02
Copyright
Urban land cover has major impacts on a city’s ecosystem services and the inherent quality of its urban residential environment. The spatio-temporal distribution of impervious surface area and green areas in Chinese cities has exhibited a significantly marked difference in comparison with USA cities. This study focused on monitoring and comparing the spatio-temporal dynamics, land cover patterns and characteristics of functional regions in six Chinese (n=3) and USA (n=3) cities. The study data were collated from Landsat TM/MSS imagery during the period 1978-2010. Results indicate that Chinese cities have developed compactly over the past three decades, while development has been notably dispersed among USA cities. Mean vegetation coverage in USA cities is approximately 2.2 times that found amongst Chinese urban agglomerations. Land use types within Chinese cities are significantly more complex, with a higher density of impervious surface area. Conversely, the central business district (CBD) and residential areas within USA cities were comprised of a lower proportion of impervious surface area and a higher proportion of green land. Results may be used to contribute to future urban planning and administration efforts in both China and the USA.
Key words: urban structure; impervious surface area; vegetation; China; USA; remote sensing
CHI Wenfeng , SHI Wenjiao , KUANG Wenhui . Spatio-temporal characteristics of intra-urban land cover in the cities of China and USA from 1978 to 2010[J]. Journal of Geographical Sciences, 2015 , 25(1) : 3 -18 . DOI: 10.1007/s11442-015-1149-z
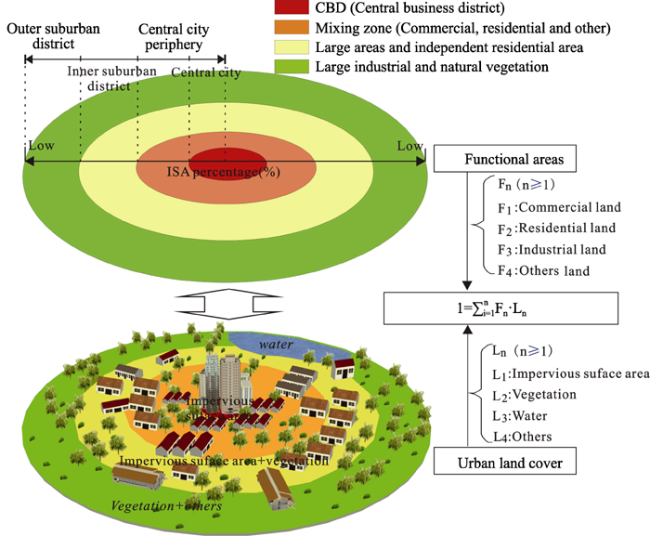
Figure 1 Theoretical model of urban locations and land cover components |
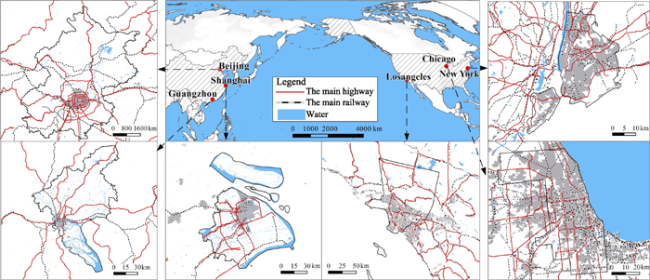
Figure 2 Locations of the study cities |
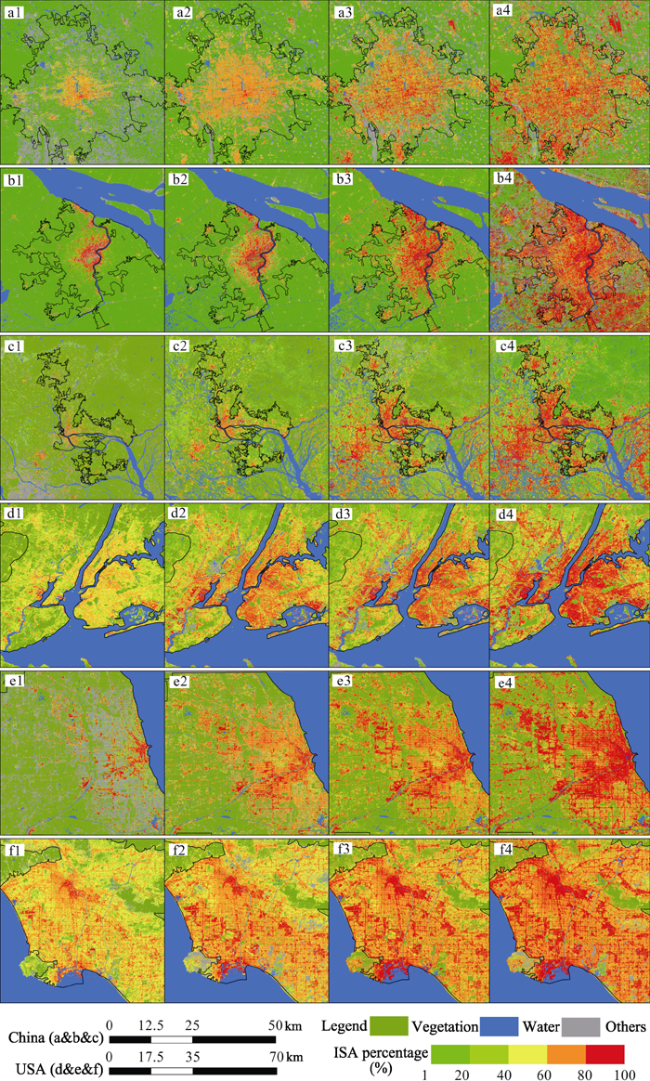
Figure 3 Spatial patterns of intra-urban land cover in the cities of China and USA from 1978 to 2010 (a, b, c, d, e and f represent Beijing, Shanghai, Guangzhou, New York, Chicago and Los Angeles, respectively; a1, a2, a3 and a4 represent intra-urban land cover from 1978, 1990, 2000 and 2010, respectively) |
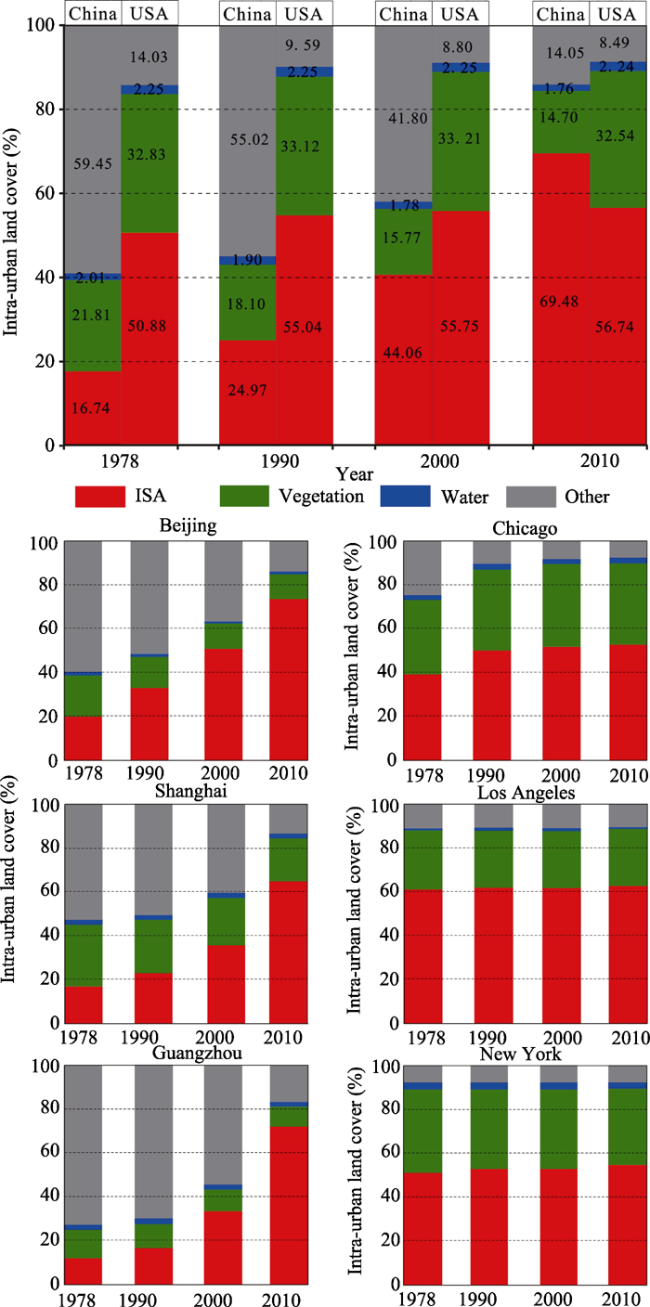
Figure 4 Percentage of intra-urban land cover in the cities of China and USA from 1978 to 2010 |
Table 1 Changes in intra-urban land cover within Chinese and USA study cities from 1978 to 2010 (km2) |
| Intra-urban land cover types | 1978-1990 | 1990-2000 | 2000-2010 | 1978-2010 | ||||
|---|---|---|---|---|---|---|---|---|
| ΔS | ΔS′ | ΔS | ΔS′ | ΔS | ΔS′ | ΔS | ΔS′ | |
| China | ||||||||
| ISA | 309.68 | 25.81 | 589.85 | 58.98 | 1083.98 | 108.40 | 1983.51 | 61.98 |
| Vegetation | -139.53 | -11.63 | -87.80 | -8.78 | -40.10 | -4.01 | -267.43 | -8.36 |
| Water | -3.90 | -0.33 | -4.63 | -0.46 | -0.55 | -0.05 | -9.08 | -0.28 |
| Others | -166.24 | -13.85 | -497.42 | -49.74 | -1043.34 | -104.33 | -1707.00 | -53.34 |
| USA | ||||||||
| ISA | 447.87 | 37.32 | 76.48 | 7.65 | 106.76 | 10.68 | 631.12 | 19.72 |
| Vegetation | 31.45 | 2.62 | 8.91 | 0.89 | -72.34 | -7.23 | -31.98 | -1.00 |
| Water | -0.73 | -0.06 | -0.14 | -0.01 | -0.43 | -0.04 | -1.30 | -0.04 |
| Others | -478.60 | -39.88 | -85.26 | -8.53 | -33.99 | -3.40 | -597.84 | -18.68 |
| Beijing | ||||||||
| ISA | 169.17 | 14.10 | 236.97 | 23.70 | 293.11 | 29.31 | 699.24 | 21.85 |
| Vegetation | -60.00 | -5.00 | -32.36 | -3.24 | -5.26 | -0.53 | -97.62 | -3.05 |
| Water | -3.47 | -0.29 | -3.19 | -0.32 | -0.46 | -0.05 | -7.11 | -0.22 |
| Others | -105.70 | -8.81 | -201.41 | -20.14 | -287.39 | -28.74 | -594.51 | -18.58 |
| Guangzhou | ||||||||
| ISA | 37.88 | 3.16 | 132.92 | 13.29 | 307.92 | 30.79 | 478.72 | 14.96 |
| Vegetation | -15.19 | -1.27 | -8.90 | -0.89 | -5.13 | -0.51 | -29.22 | -0.91 |
| Water | -0.42 | -0.03 | -0.80 | -0.08 | -0.05 | 0.00 | -1.27 | -0.04 |
| Others | -22.27 | -1.86 | -123.22 | -12.32 | -302.74 | -30.27 | -448.23 | -14.01 |
| Shanghai | ||||||||
| ISA | 102.63 | 8.55 | 219.96 | 22.00 | 482.96 | 48.30 | 805.55 | 25.17 |
| Vegetation | -64.34 | -5.36 | -46.54 | -4.65 | -29.71 | -2.97 | -140.58 | -4.39 |
| Water | -0.02 | 0.00 | -0.64 | -0.06 | -0.04 | 0.00 | -0.70 | -0.02 |
| Others | -38.27 | -3.19 | -172.78 | -17.28 | -453.21 | -45.32 | -664.26 | -20.76 |
| Chicago | ||||||||
| ISA | 359.53 | 29.96 | 61.25 | 6.13 | 28.68 | 2.87 | 449.47 | 14.05 |
| Vegetation | 120.08 | 10.01 | 15.81 | 1.58 | -20.11 | -2.01 | 115.78 | 3.62 |
| Water | -1.92 | -0.16 | -0.01 | 0.00 | -0.13 | -0.01 | -2.06 | -0.06 |
| Others | -477.69 | -39.81 | -77.05 | -7.71 | -8.44 | -0.84 | -563.19 | -17.60 |
| Los Angeles | ||||||||
| ISA | 31.21 | 2.60 | 6.39 | 0.64 | 19.36 | 1.94 | 56.97 | 1.78 |
| Vegetation | -21.35 | -1.78 | -9.36 | -0.94 | 4.80 | 0.48 | -25.91 | -0.81 |
| Water | 1.28 | 0.11 | -0.21 | -0.02 | -0.22 | -0.02 | 0.85 | 0.03 |
| Others | -11.14 | -0.93 | 3.17 | 0.32 | -23.94 | -2.39 | -31.90 | -1.00 |
| New York | ||||||||
| ISA | 57.13 | 4.76 | 8.84 | 0.88 | 58.72 | 5.87 | 124.69 | 3.90 |
| Vegetation | -67.28 | -5.61 | 2.45 | 0.25 | -57.03 | -5.70 | -121.85 | -3.81 |
| Water | -0.08 | -0.01 | 0.08 | 0.01 | -0.08 | -0.01 | -0.08 | 0.00 |
| Others | 10.24 | 0.85 | -11.38 | -1.14 | -1.61 | -0.16 | -2.75 | -0.09 |
Note: Changes in intra-urban land cover ΔS and the annual change ΔS′represent changes in number (positive number represent increasing area, ‘-’ represents decreasing area) |
Table 2 Sampling sites from typical functional areas within the six study cities from China and the USA |
| Function areas | City | Central coordinate (LAT/LON, degree) | District |
|---|---|---|---|
| Business | Beijing | 116.462/39.909 | China World Trade Center Area |
| Shanghai | 121.438/31.195 | Xujiahui region | |
| Guangzhou | 113.321/23.120 | Zhujiang New City | |
| New York | -73.984/40.746 | Manhattan | |
| Chicago | -87.636/41.879 | Sears Tower | |
| Los Angeles | -118.149/34.147 | Old Town Pasadena | |
| Residential | Beijing | 116.328/40.061 | Huilongguan |
| Shanghai | 121.379/31.112 | Minhang District | |
| Guangzhou | 113.322/22.968 | Qifuxin Country | |
| Los Angeles | -118.106/34.094 | San Gabriel | |
| New York | -73.951/40.626 | Centralized living area | |
| Chicago | -87.754/41.930 | Greenwich Village | |
| Industrial | Beijing | 116.461/39.810 | Yizhuang Star Light Industrial Park |
| Shanghai | 121.620/31.262 | Jinlingjinqiao Industrial Park | |
| Guangzhou | 113.522/23.137 | Luogangyunbu industrial zone | |
| Chicago | -87.630/41.884 | Chicago Loop Area | |
| New York | -73.970/40.697 | Brooklyn | |
| Los Angeles | -118.165/34.045 | Seattle South Industrial Zone |
Table 3 Percentages of ISA and vegetation within dominant functional areas in Chinese and USA cities, 2010 |
| Function areas | Cover type | Shanghai | Beijing | Guangzhou | New York | Los Angeles | Chicago |
|---|---|---|---|---|---|---|---|
| Business | ISA | 0.83 | 0.83 | 0.81 | 0.78 | 0.78 | 0.76 |
| Vegetat. | 0.08 | 0.08 | 0.06 | 0.18 | 0.09 | 0.15 | |
| Residential | ISA | 0.68 | 0.65 | 0.62 | 0.45 | 0.52 | 0.56 |
| Vegetat. | 0.16 | 0.11 | 0.15 | 0.36 | 0.28 | 0.32 | |
| Industrial | ISA | 0.60 | 0.63 | 0.61 | 0.76 | 0.74 | 0.72 |
| Vegetat. | 0.07 | 0.06 | 0.05 | 0.03 | 0.02 | 0.02 |
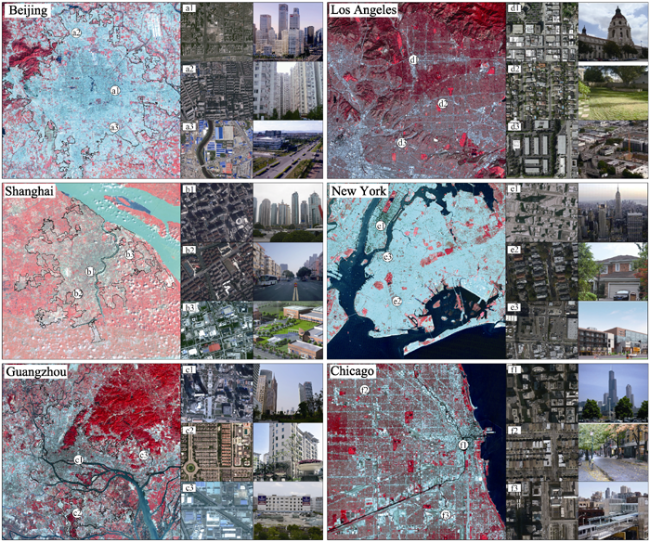
Figure 5 Image characteristics of functional areas in Chinese and USA cities under examination |
The authors have declared that no competing interests exist.
| 1 |
|
| 2 |
|
| 3 |
|
| 4 |
|
| 5 |
|
| 6 |
|
| 7 |
|
| 8 |
|
| 9 |
|
| 10 |
|
| 11 |
|
| 12 |
|
| 13 |
|
| 14 |
|
| 15 |
|
| 16 |
|
| 17 |
|
| 18 |
|
| 19 |
|
| 20 |
|
| 21 |
|
| 22 |
|
| 23 |
|
| 24 |
|
| 25 |
|
| 26 |
|
| 27 |
|
| 28 |
|
| 29 |
|
| 30 |
|
| 31 |
|
| 32 |
|
| 33 |
|
/
| 〈 |
|
〉 |