Orginal Article

Multi-scale variability of water discharge and sediment load into the Bohai Sea from 1950 to 2011

  • REN Huiru , 1, 2 ,
  • LI Guosheng , 1, * ,
  • CUI Linlin 1, 2 ,
  • HE Lei 1, 2
Expand
  • 1. Key Laboratory of Land Surface Pattern and Simulation, Institute of Geographic Sciences and Natural Resources Research, CAS, Beijing 100101, China
  • 2. University of Chinese Academy of Sciences, Beijing 100049, China

*Corresponding author: Li Guosheng, Professor, E-mail:

Author: Ren Huiru (1983-), PhD Candidate, specialized in coastal environment and modeling. E-mail:

Received date: 2014-04-20

  Accepted date: 2014-05-26

  Online published: 2015-01-15

Supported by

National Natural Science Foundation of China, No.41271026

Copyright

Journal of Geographical Sciences, All Rights Reserved

Abstract

This paper examines the changes in the time series of water discharge and sediment load of the Yellow River into the Bohai Sea. To determine the characteristics of abrupt changes and multi-scale periods of water discharge and sediment load, data from Lijin station were analyzed, and the resonance periods were then calculated. The Mann-Kendall test, order clustering, power-spectrum, and wavelet analysis were used to observe water discharge and sediment load into the sea over the last 62 years. The most significant abrupt change in water discharge into the sea occurred in 1985, and an abrupt change in sediment load happened in the same year. Significant decreases of 64.6% and 73.8% were observed in water discharge and sediment load, respectively, before 1985. More significant abrupt changes in water discharge and sediment load were observed in 1968 and 1996. The characteristics of water discharge and sediment load into the Bohai Sea show periodic oscillation at inter-annual and decadal scales. The main periods of water discharge are 9.14 years and 3.05 years, whereas the main periods of sediment load are 10.67 years, 4.27 years, and 2.78 years. The significant resonance periods between water discharge and sediment load are observed at the following temporal scales: 2.86 years, 4.44 years, and 13.33 years. Water discharge and sediment load started to decrease after 1970 and has decreased significantly since 1985 for several reasons. Firstly, the precipitation of the Yellow River drainage area has reduced since 1970. Secondly, large-scale human activities, such as the building of reservoirs and floodgates, have increased. Thirdly, water and soil conservation have taken effect since 1985.

Cite this article

REN Huiru , LI Guosheng , CUI Linlin , HE Lei . Multi-scale variability of water discharge and sediment load into the Bohai Sea from 1950 to 2011[J]. Journal of Geographical Sciences, 2015 , 25(1) : 85 -100 . DOI: 10.1007/s11442-015-1155-1

1 Introduction

The sediment deposited in estuaries and offshore affects coastal morphology and coastal ecosystem productivity (Bakker et al., 1968; Fanos, 1995; Semeniuk, 1996; Cacchione et al., 1999). Sediment and water discharge transport are the main factors that influence coastline evolution and also serve significant functions in the shallow environment; these factors even affect biogeochemical cycling, because sediment absorbs nutrients and contaminants (Alongi et al., 1998; Cipriani et al., 1999; Walling et al., 2003). The Yellow River, which re-shifted its trunk stream into the Bohai Sea in China since 1855, has the highest sediment concentration in the world (Qian et al., 1993; Wang et al., 1998). Thus, a large quantity of freshwater and sediment are transported to the coastal zone. The coastal evolution process of the Yellow River Delta, Bohai Bay, Laizhou Bay, and the nearby coastline has been influenced by water and sediment transport from the Yellow River (Pang et al., 1979; Wang et al., 1990; Yoshiki et al., 2001; Xu, 2002; Li et al., 2006; Xu et al., 2013). For 150 years, the Yellow River has poured approximately 566.5×10¹⁰ m3 of water into the Bohai Sea annually, with a diffusion area of approximately 14.2% of the whole sea (Cheng et al., 1984; Xu, 2005). A recorded amount of 1.34×10¹⁰ tons of sediment has flowed into the Bohai Sea annually, with most sediment deposits on the shoreline (Yang et al., 2004; Ren, 2006; Wang et al., 2006). However, water and sediment discharges of the Yellow River into the Bohai Sea have decreased since the 1950s.
Studies on the changes in water discharge and sediment load into oceans and the influencing factors of such changes have increased. Abrupt and periodic changes are two important research topics related to water discharge and sediment load. Water discharge and sediment load of the Yellow River into the Bohai Sea are characterized by multi-scale periodic oscillations and step-decreasing phases, which are closely related to the precipitation of the Yellow River drainage area and to human activities (Chen et al., 2002; Xu, 2003; Pan et al., 2003; Yang et al., 2004). The periodic oscillations of water discharge and sediment load into the Bohai Sea have been found at annual, inter-annual, and decadal scales over the past several years. The primary periods are found to be 3 to 4 years, 7 to 9 years, and 11 years based on the runoff series from 1951 to 1998 (Yang et al., 2004). The multi-scale changes in the sediment load into the Bohai Sea over the past 50 years have resulted in three significant periodicities: annual (0.53 years and 0.97 years), inter-annual (3.2 years), and decadal (10.1 years) (Liu et al., 2011). Precipitation in the Yellow River drainage area has controlled the changes in water and sediment discharge into the sea and has exhibited a decreasing trend over the past 50 years (Xu, 2003, 2004). The inter-annual oscillations of water discharge and sediment load have been affected by the quasi-biennial oscillation of precipitation, which is dominated by the quasi-biennial oscillation of the northwest Pacific subtropical high (Wang et al., 1997; Huang et al., 2009). A relationship exists between precipitation in the Yellow River drainage area into the Bohai Sea and the cycle of sunspot activity (Li et al., 2004, 2005). The correlation of oscillations among the 2-year, 4-year, and 12- to 14-year timescales are positive, with the 12-year to 14-year fluctuation showing the strongest energy (Sun et al., 2009; Li et al., 2005). The sunspot activity and the northwest Pacific subtropical high primarily contribute to the multi-scale oscillations of precipitation over the Yellow River drainage basin (Wei et al., 2002; Liu et al., 2008; Ma et al., 2003; Tang et al., 2006). The multi-scale oscillations of precipitation over the Yellow River drainage basin have controlled the periods of water discharge and sediment load into the Bohai Sea.
Step-decreasing phases have been divided by significant abrupt changes. Different significant abrupt changes have been detected by analyzing previous water discharge and sediment load into the Bohai Sea (Ren et al., 1986; Yang, 2004; Ding et al., 2007). Abrupt changes occurred at the same time as the building of three large reservoirs: Liujiaxia in 1968, Longyangxia in 1986, and Xiaolangdi in 1999 (Wang et al., 2007; Zhao et al., 2009). Changes in water discharge and sediment load into the Bohai Sea are affected not only by precipitation, but also by human activities. First, 3183 reservoirs have been built in the Yellow River drainage area, with a total storage capacity of 5.83×10¹⁰ m3 (Yang et al., 2008). The combined capacity of Longyangxia, Liujiaxia, and Xiaolangdi amounts to 4×10¹⁰ m3 and accounts for approximately 70% of the annual natural runoff of the Yellow River (Pan et al., 2003; Wang et al., 2006). The decreasing runoff in the upper and middle reaches has aggravated the current breaking of the Yellow River and has influenced water discharge into the Bohai Sea (Zhao et al., 1992; Zhou et al., 2002). Second, a large quantity of water from the Yellow River has been consumed. The amount of water for consumption annually has accounted for 47% of the natural runoff in 2000. The amount of water for agricultural irrigation from the Yellow River in the 1980s averages 274×108 m3, which is double the amount of water used in the 1950s (Zhou et al., 2002). Third, soil and water conservation has influenced the change in the sediment load of the Yellow River into the sea since the 1960s (Zhao et al., 1992; Chen et al., 2002). Step-decreasing phases of water discharge and sediment load of the Yellow River into the sea have been strongly influenced by the increase in the number of reservoirs, consumption of agricultural irrigation, and water and soil conservation since the 1980s.
Numerous studies have focused on the decrease in runoff or sediment into the sea. However, the resonance periods between water discharge and sediment load has not yet been extensively investigated. This study is primarily interested in the resonance periods between water discharge and sediment load into the sea because these factors synchronously affect the coastal evolution and shallow water environment. Studying the resonance periods of water discharge and sediment load into the sea provides a stronger base for coastal morphology and coastal ecosystem productivity. To elaborate on the relationship between the resonance periods of water discharge and sediment load, the characteristics of the abrupt changes and periodicity must first be analyzed. This study aims to illustrate abrupt changes in and periodicity of water discharge and sediment load based on an updated dataset, to calculate the resonance periods, and then to analyze the influencing factors.

2 Material and methods

2.1 Study area

The Yellow River originates from the Qinghai-Tibet Plateau and has an extremely large sediment load. The Yellow River runs through nine provinces in China and empties into the Bohai Sea, which is a semi-enclosed shallow shelf sea with an average depth of approximately 18 m (Wang, 1998; Qin et al., 1985; Yue et al., 2003). The main stream of the Yellow River has nine important hydrometric stations and can be divided into three segments: the upper, middle, and lower reaches. These segments are separated by the Toudaoguai and Huayuankou hydrometric stations. The 768-km-long lower Yellow River starts from Mengjin on the southeastern slope of the Loess Plateau before passing through the North China Plain and flowing into the Bohai Sea near Lijin station (Pan et al., 2003; Zhao et al., 2007; Ma et al., 2012). Lijin station is the hydrological controlling station for water discharge and sediment load delivered by the Yellow River into the Bohai Sea (Figure 1).
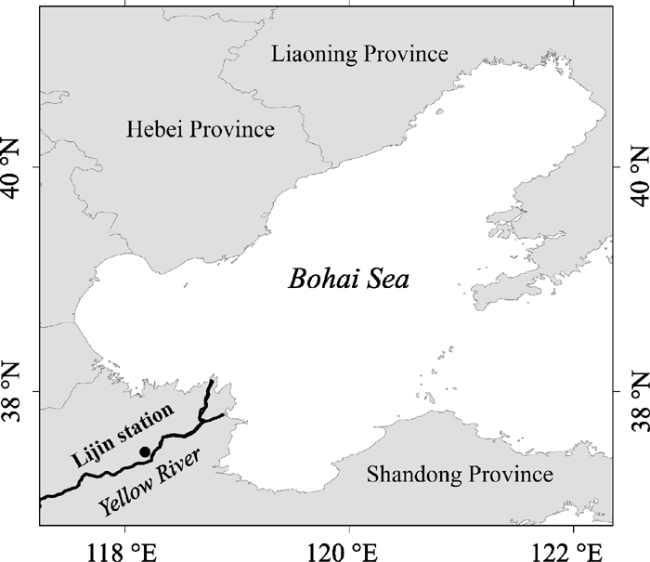
Figure 1 Sketch map of the Bohai Sea (Data are from National Fundamental Geographic Information System in 2003, NGCC.)
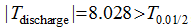
2.2 Data and methods

The dataset comprises the original observation from Lijin station, which is the nearest the Yellow River estuary. The dataset originally consisted of three parts: (1) the data on water discharge and sediment load at Lijin station between July 1950 and June 1985, supplied by the Yellow River Conservancy Commission; (2) the monthly data on water discharge and sediment load at Lijin station between January 2000 and December 2011, extracted from the Bulletins of Chinese River Sediment which is compiled by the Ministry of Water Resources (MWR); and (3) the data on water discharge and sediment load between January 1950 and July 1950 and between July 1985 and December 1999, obtained through hydrological data on the Yellow River. The average monthly data on precipitation from 1997 to 2011 were from the Bulletins of Chinese Water Resources published by the MWR, whereas the average monthly data on precipitation from 1950 to 1996 were from the National Climate Center of the China Meteorological Administration.
The two crucial characteristics of hydrological time series data are abrupt changes and periodicity (Yang et al., 2004; Wang et al., 2011). The Mann-Kendall test, which is widely used to detect the trend of hydrologic data, focuses on detecting the significant trend characteristics and determines whether the trend increases or decreases. The use of the Mann-Kendall test identifies abrupt changes while analyzing trends in hydrological time series data.
The Mann-Kendall test and the ordered cluster enable the analysis of abrupt changes in water discharge and sediment load, based on which phases are divided according to abrupt points. The abrupt points of water discharge and sediment load are calculated by using the ordered cluster analysis method though Eq. (1).
where n is the length of time series, τ is the split point, and xi is the time series.
Wavelet analysis has a number of advantages over fast Fourier transform (FFT) (Maheswaran et al., 2012; Wang, 2012) in terms of the analysis of non-stationary data series in which the amplitudes and phases of the harmonic constituents may be changing rapidly in time or space. Where an FFT of the non-stationary time series would smear out any detailed information on the changing processes, wavelet analysis attempts to track the evolution of the signal characteristics through the dataset. The applicability of wavelet analysis to geophysical data has been validated by extracting the fluctuation components of hydrological data. To extract more detailed information from the original dataset in the time-frequency fields, the multi-scale characteristics of water discharge and sediment load should be calculated through wavelet analysis.
Several “mother” wavelets have been applied to scientific research for all types of fields, and the “Morlet” wavelet has already been validated in geophysics (William et al., 2001). Thus, the “Morlet” wavelet method is adopted in this paper, as described in Eq. (2).
where x is the time series, j is the scale parameter, fb is the bandwidth parameters, and fc is the wavelet center frequency.
Almost all temporal scale analyses attempt to transform the time series into spectral sequences by using the FFT method. Consequently, the total energy of the time series is decomposed into the linear combinations of periodic or quasi-periodic components with different frequencies. We use the FFT components to implement power spectrum and cross-spectrum analyses. Furthermore, the cross-spectrum can be decomposed into a coincident spectral density function, which defines the degree of co-oscillation for the frequency constituents of the two time series that oscillate in-phase.

3 Results

3.1 Characteristics of abrupt changes

The Mann-Kendall test, order clustering, power-spectrum, and wavelet analysis were used to observe water discharge and sediment load into the sea from 1950 to 2011. The original data on water discharge and sediment load at Lijin station were normalized.
3.1.1 Analysis of abrupt changes
Water discharge and sediment load at Lijin station showed a downward trend from 1950 to 2011 with strong inter-annual fluctuation (Figure 2). The linear regression coefficient of water discharge at Lijin station is -7.542, whereas the linear regression coefficient of the sediment load is -2.225. The test values of water discharge and sediment load of the Yellow River into the sea have been analyzed using the T-test: 
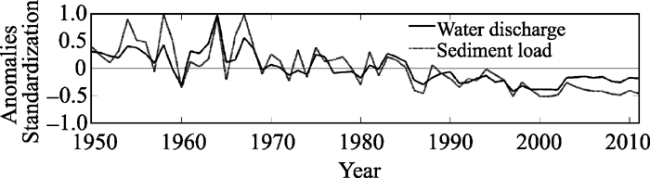
, (Confidence level α=0.05, T0.01/2=1.671). The annual water discharge and sediment load are strongly inter-related. A significant positive correlation exists between water discharge and sediment load, with a correlation coefficient of 0.857. The results prove that water discharge and sediment load of the Yellow River at Lijin station from 1950 to 2011 have a positive correlation coefficient and show a significant linear downward trend.
Abrupt changes in water discharge and sediment load in the estuary of the Yellow River were calculated using the Mann-Kendall test (Figure 3). The results show that water discharge and sediment load from the Yellow River into the Bohai Sea decreased from 1950 to 2011. An abrupt change in water discharge, which is the cross point of positive and negative sequences, appears between 1985 and 1986 and passes a 95% reliability T-test. An abrupt change in sediment load appears in 1996, but this change is not on the 95% reliability line. However, failure to pass the 95% reliability T-test does not denote that the point is not significant. The abrupt change was also tested using the Yamamoto test and was found to be significant. Water discharge and sediment load of the Yellow River at Lijin station were found to start to decrease significantly in the 1970s, and the abrupt change in water discharge and sediment load occurred in 1985 and 1996, respectively.
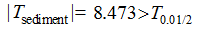
Figure 2 The temporal variation of annual mean for water discharge and sediment load
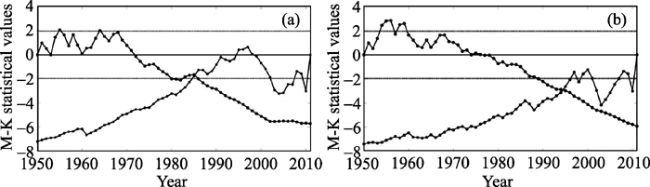
Figure 3 Mann-Kendall test for abrupt change of the Yellow River at Lijin station

(a. annual water discharge; b. annual sediment load)

3.1.2 Division into different phases
The data on water discharge and sediment load into the Bohai Sea were analyzed by using the order clustering method. The phases of water discharge and sediment load of the Yellow River are divided by abrupt changes (jumping points). The jumping points in Table 1 correspond to the abrupt changes. The jumping points of water discharge and sediment load in the estuary can be divided into three levels; the first-level jumping points have passed through 0.01 significance testing, whereas the second- and third-level jumping points have passed through 0.05 significance testing.
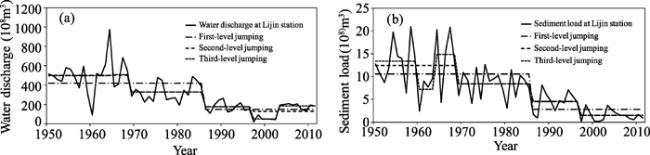
Table 1 Jumping points of water discharge and sediment load of the Yellow River into the Bohai Sea
Water discharge Sediment load
The first jumping points 1985 1985
The second jumping points 1968, 1985, 1996 1968, 1985, 1996
The third jumping points 1964, 1968, 1985, 1996, 2002 1959, 1963, 1968, 1985, 1996
Water discharge and sediment load into the sea decreased mainly in the form of stepwise jumping from 1950 to 2011 (Figure 4). The results show that the first step-decreasing phase of water discharge and sediment load into the sea occurred in 1985 and evidently decreased since then. Current water discharge and sediment load decreased to 64.6% and 73.8%, respectively, of the values before 1985. The second step-decreasing phases of water discharge and sediment load of the Yellow River all occurred in 1968 and 1996. Water discharge and sediment load from 1969 to 1985 declined to 34.9% and 32.5% of the values for 1950 to 1968. Water discharge and sediment load from 1986 to 2011 decreased to 25.7% and 67.9% of water discharge and sediment load from 1969 to 1985. The third step-decreasing phases of water discharge and sediment load occurred in different years; abrupt changes in water discharge occurred in 1959 and 1963, whereas abrupt changes in sediment load occurred in 1964 and 2002. Although some phases of water discharge slightly increased in the 1960s and 2000s, water discharge reduced in the form of step-decreasing phases over the past 62 years. Based on these abrupt changes, water discharge and sediment load into the sea can be divided into different phases. Water discharge of the Yellow River into the Bohai Sea is divided into six phases: 1950 to 1964, 1965 to 1968, 1969 to 1985, 1986 to 1996, 1997 to 2002, and 2003 to 2011. The phases of sediment load of the Yellow River into the Bohai Sea are also divided into six phases: 1950 to 1959, 1960 to 1963, 1964 to 1968, 1969 to 1985, 1986 to 1996, and 1997 to 2011.
Figure 4 The stepwise decrease of the water discharge and sediment load at Lijin station (a. water discharge; b. sediment load)

3.2 Characteristics of water discharge and sediment load

3.2.1 Dominant periods of water discharge and sediment load
The major fluctuation components of water discharge and sediment load were analyzed by using power-spectrum analysis (Figure 5). The peak values show that the same fluctuation periods exist in the two datasets that exhibit inter-annual and decadal cycles. Specifically, the major oscillation periods of water discharge recorded are 9.14 years and 3.05 years, whereas the major periods extracted from the sediment load are 10.67 years, 4.27 years and 2.78 years. The original series were detected based on the noise spectrum with sequence length n=62 and confidence level a=0.05. We thus calculated 
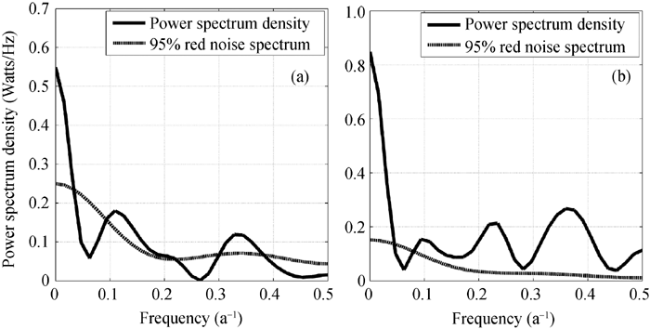
= 0.1957. If the first-order correlation coefficient of the original time series is in accordance with R(1) >Ra, the series is a “red” noise spectrum. The first-order correlation coefficient of water discharge is Rw (1) (Rw(1) = 0.2249>0.1957), whereas the first-order correlation coefficient of the sediment load is Rs(1) (Rs(1) = 0.2118>0.1957). The confidence limit of the “red” noise spectrum is 95%. The power spectrum peak values of water discharge and sediment load are above the line of the “red” noise spectrum test, indicating a greater than 95% confidence level. All period values pass the “red” noise test. The difference in the power spectra between water discharge and sediment load of the Yellow River into the Bohai Sea is that the maximum power spectral density of water discharge appears on a 9.14-year timescale, whereas that of the sediment load appears on a 2.78-year timescale.
Figure 5 The power-spectrum of water discharge of the Yellow River into the Bohai Sea (a); The power-spectrum of sediment load of the Yellow River into the Bohai Sea (b)
3.2.2 Characteristics of multi-scale-time water discharge
The wavelet coefficients of water discharge show various periods (Figure 6a). The oscillation at the 12.2-year to 21.3-year timescale, which occurred from 1950 to 1977 with a center in 1960, is most significant. The oscillation in the 7.5-year to 10.8-year timescale, which occurred from 1958 to 1970 with a center at 1965, is more significant. The oscillation at the 3.3-year to 5.4-year timescale, which occurred from 1960 to 1975 with a center in 1968, is obvious. The oscillations on the 1.2-year to 1.8-year timescale, which occurred from 1953 to 1969 and 1976 to 1985 with two centers in 1960 and 1980, respectively, are significant. Periodic variations at various timescales of water discharge were strong from 1950 to 1985, but not obvious after 1985. The annual oscillations were obvious and easily detected from 1953 to 1970 and from 1975 to 1983; the inter-annual oscillations fluctuated from 1950 to 1970; and the decadal cycles significantly changed before the 1970s. The multi-scale oscillations have changed intensively before 1985 but have been weakened rapidly thereafter.
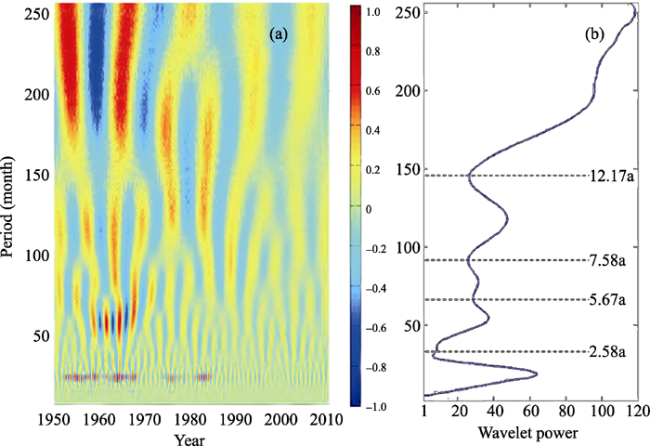
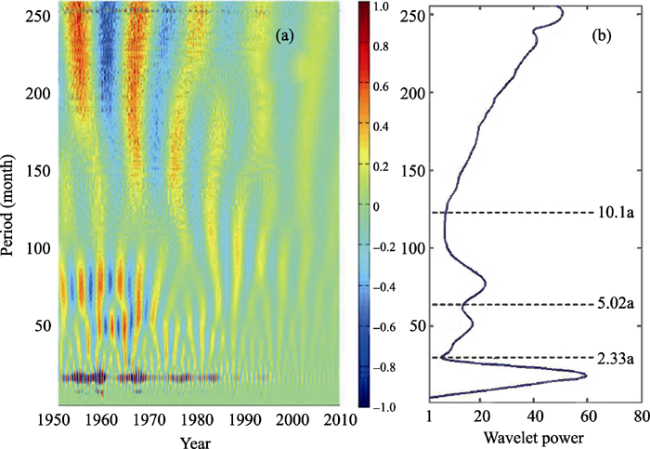
Figure 6 Morlet wavelet transform of month-averaged water discharge at Lijin station (a. wavelet coefficients as a function of period and time; b. the wavelet power spectrum with period)
The “Morlet” wavelet transforms of water discharge record yield an estimate of the wavelet coefficients as a function of period and time. This estimate depicts the temporal variation in the constituents with different periods, and indicates the intensity of each oscillation at a given time. The constituents with periods longer than 20 years are overlooked in this dataset because such constituents are limited by the record extent. The three types of scale time periods of water discharge of the Yellow River into the Bohai Sea between 1950 and 2011 are as follows: 0.5-2.58-year scale, 2.58-7.58-year scale, and 7.58-12.17-year scale (Figure 6b).
The constituents of the three temporal scales were reconstructed according to three types of scale time periods: reconstruction of the annual component by combining the elements with periods of 0.5-year to 2.58-year scale, the inter-annual component by combining the signals with the periods of 2.58-year to 7.58-year scale, and the decadal component by adding the elements with the periods of 7.58-year to 12.17-year scale (Figure 7). The wavelet function to extract the record tendency helps to reveal an overall decline in water discharge trend. The reconstructed components plotted in Figure 7 show that the inter-annual and decadal fluctuations were obvious before the 1970s, especially from 1956 to 1970. The oscillation of the various periods of water discharge from the Yellow River into the Bohai Sea has weakened since 1985.
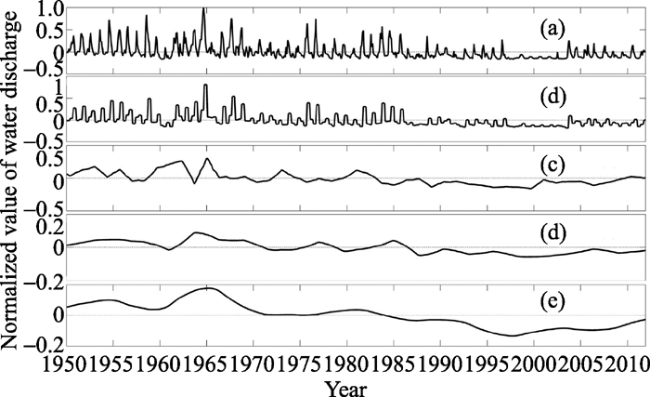
Figure 7 Time series of water discharge rate from 1950 to 2011 (a. original time series; b. the reconstruction of the Db6 wavelet in intra-annual scale; c. the reconstruction of the Db6 wavelet in annual scale; d. the reconstruction of the Db6 wavelet in decadal scale; e. component and tendency signal)
3.2.3 Characteristics of multi-scale-time sediment load
The estimate of the wavelet coefficients as a function of period and time using the “Morlet” wavelet transforms for the sediment load record is plotted in Figure 8a, which depicts the temporal variation of each fluctuation component, as well as the phase and amplitude of each oscillation constituent at a given time. A comparison of the sediment load record with water discharge record shows that the multi-scale fluctuations in the sediment load seem to be weaker. Three particular oscillations, which are on 1.17-year to 1.8-year, 4.2-year to 8-year, and 13.3-year to 20-year scales, were detected from the sediment load dataset, and the periods longer than 20-year were neglected. The oscillation on the 13.3-year to 20-year scale, which occurred from 1950 to 1970 with a center at 1960, is most significant. The oscillation on the 4.2-year to 8-year scale, which occurred from 1950 to 1970 with a center in 1960, is more significant. The oscillation at 1.17-year to 1.8-year scales, which occurred from 1950 to 1985 with a center in 1968, is obvious. The decadal fluctuation of the sediment load decreased gradually and is similar to the change of water discharge into the sea. The inter-annual oscillation on a 4.2-year to 8-year scale is obvious between 1950 and 1970, and the inter-annual variability mainly occurred in the periods of 1953 to 1961 and 1963 to 1968.
Figure 8 Morlet wavelet transform of month-averaged sediment at Lijin station (a. wavelet coefficients as a function of period and time; b. the wavelet power spectrum with period)
The values of the power spectrum of the “Morlet” wavelet transform for the sediment load record for all periods have shown the quantity of wavelet energy in different temporal scales (Figure 8b). The peak value of wavelet variance can be located on the annual period, indicating that the major fluctuation component of the sediment load is an annual constituent. The constituents of three temporal scales have been reconstructed according to Figure 8b using the same processes as those for the sediment load record: reconstruction of the annual component by combining the elements with periods of 0.5-year to 2.33-year scale, the inter-annual component by a combination of the signals with periods of 2.33-year to 5.02-year scale, and the decadal component by adding the elements with the periods of 5.02-year to 10.17-year scale (Figure 9). We can conclude that 1985 seems to be a threshold for the sediment load. The multi-scale oscillation is obvious before the 1970s, but weakens quickly from then on. By applying the wavelet functions to extract the record tendency of the dataset, we can deduce that the sediment load of the Yellow River into the Bohai Sea oscillated strongly before 1985.
Figure 9 Time series of the sediment rate from 1950 to 2011 (a. original time series; b. the reconstruction of the Db6 wavelet in intra-annual scale; c. the reconstruction of the Db6 wavelet in annual scale; d. the reconstruction of the Db6 wavelet in decadal scale; e. component and tendency signal)
As a result of the power-spectrum, the cross-spectrum, and the Morlet wavelet analyses, water discharge sediment and load are observed to have both oscillated on the decadal and inter-annual temporal scales in the Yellow River estuary over the past 62 years. The changes in water discharge and sediment load exhibited consistent trends, in which the reconstructed waveform and phases are similar at the inter-annual and decadal oscillations. Furthermore, the water discharge and sediment load of the Yellow River have synchronously declined into the Bohai Sea. All of the multi-scale constituents oscillated remarkably before 1985, but tended to weaken gradually from then on.

3.3 Resonance periods of water discharge and sediment load

We used the cross-spectral analyzing resonance periods of water discharge and sediment load of the Yellow River into the sea. To perform a cross-spectral analysis on water discharge and sediment load, the parameters used in the calculation are defined as follows: n=62, length of records; m=20 (m=n/10-n/3), the maximum lag length. The co-spectrum ,quadrature spectrum ,coherence spectra ,phase spectrum , and the length of the time lag spectrum are calculated and listed in Table 2. The peak values of the coherence spectrum with different frequencies show that the correlativity between the two datasets is high in three temporal scales. The corresponding periods are 2.86 years, 4.44 years, and 13.33 years. The test values of the co-spectrum or coherence spectra , which has a domain correlation structure in the frequency of two series, can provide the main information. The resonance periods are checked by analyzing the coherence spectra. The parameters are defined as follows: v=5.7(v=(2n-m/2)/m), degrees of freedom; α=0.05, confidence lever; and rc=0.69, critical value. If the value of the coherence spectra is greater than rc, then the coherence spectra have distinctive characteristics. The values of the coherence spectra, which correspond to the wave numbers (k) of 3, 9, and 14, are greater than rc, which makes the three oscillation periods significant. These values have passed the requirement of the confidence test. Therefore, the coherence of the relationships among the three resonance periods between water discharge and sediment load is reliable.
Table 2 Cross-spectrum density of water discharge and sediment load at Lijin station
k f T
0 0.000 0.216 0.000 0.975 0.000 0.000
1 0.157 40.000 0.265 0.025 0.927 0.093 0.593
2 0.314 20.000 0.046 0.019 0.621 0.399 1.270
3 0.471 13.333 0.048 0.022 0.997 0.435 0.924
4 0.628 10.000 0.034 0.022 0.783 0.579 0.921
5 0.785 8.000 0.018 0.007 0.501 0.361 0.460
6 0.942 6.667 0.008 0.000 0.226 -0.001 -0.001
7 1.100 5.714 0.007 0.000 0.180 0.003 0.003
8 1.257 5.000 0.017 -0.002 0.605 -0.099 -0.079
9 1.414 4.444 0.029 -0.005 0.850 -0.160 -0.113
10 1.571 4.000 0.020 -0.008 0.648 -0.395 -0.252
11 1.728 3.636 0.008 -0.009 0.425 -0.803 -0.465
12 1.885 3.333 0.015 -0.006 0.621 -0.380 -0.202
13 2.042 3.077 0.030 -0.002 0.925 -0.079 -0.039
14 2.199 2.857 0.037 0.001 0.959 0.021 0.009
15 2.356 2.667 0.024 0.002 0.954 0.063 0.027
16 2.513 2.500 0.013 -0.001 0.944 -0.053 -0.021
17 2.670 2.353 0.009 -0.001 0.874 -0.147 -0.055
18 2.827 2.222 0.008 0.002 0.772 0.203 0.072
19 2.985 2.105 0.010 0.003 0.899 0.246 0.083
20 3.142 2.000 0.005 0.000 0.949 0.000 0.000
The values of the phase spectrum and the lag time length spectrum in Table 2 indicate the phase difference and lag time length between water discharge and sediment load. The decadal fluctuation of water discharge starts 0.92 year earlier than the decadal fluctuation of the sediment load and approximately 0.01 year earlier on the inter-annual scale (2.86 years). However, the fluctuation of the sediment load is 0.11 year earlier than the fluctuation of water discharge by periods of 4.44 years. In other words, the lag time length between the sediment load and water discharge in the inter-annual oscillation can be neglected, but the decadal scale of water discharge is approximately 0.92 year earlier than the decadal period of the sediment load from 1950 to 2011.

4 Discussion

Climate change and human activities are the two major factors controlling the variations in water discharge and sediment load into the sea (Chen et al., 2002; Xu, 2003; Wang et al., 2013). The date of precipitation in the Yellow River drainage area was calculated based on six areas: the regions of Lanzhou Basin, Lanzhou station to Toudaoguai station, Toudaoguai Station to Longmen station, Longmen station to Sanmenxia station, Sanmenxia station to Huayuankou station, and Huayuankou station. Water discharge of the Yellow River into the Bohai Sea and the precipitation in the Yellow River drainage area from 1950 to 2011 synchronously show a downward trend (Figure 10). The fluctuations in the precipitation in the Yellow River drainage area show a strong similarity to water discharge into the sea before 1970 and weaken afterward. Water discharge was mainly controlled by precipitation before the 1970s and was unaffected by human activity. After 1985, water discharge largely decreased due to human activities. Water discharge became smaller in the main channel, such that the tiny stream was incapable of carrying particles to the estuary. Such a dramatic decrease in water discharge from the Yellow River to the Bohai Sea has also resulted in a significant decrease in the sediment load to the sea. A significant correlation coefficient between the precipitation and water discharge is 0.58, which indicates that the precipitation in the Yellow River drainage area affects water discharge of the Yellow River into the Bohai Sea. The precipitation is the main reason for the change in water discharge into the sea. Moreover, the reduction rate of water discharge is greater than the decline rate of precipitation. Thus, the decreasing water discharge into the Bohai Sea is affected not only by precipitation but also by other factors, such as human activity.
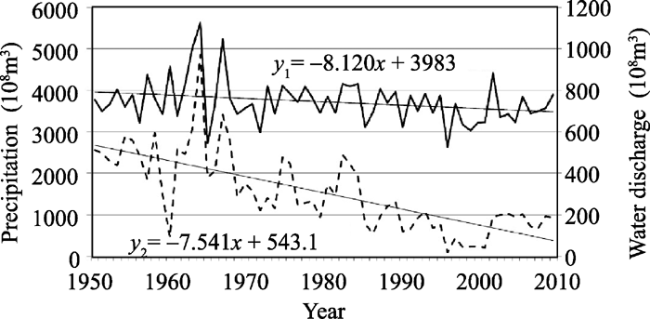
Figure 10 Annual precipitation of the Yellow River and water discharge at Lijin station from 1950 to 2011(water discharge at Lijin station in real line; annual precipitation of the Yellow River in dashed)
The dominant periods of water discharge and sediment load from the Yellow River into the Bohai Sea are on 9-year (9.14-year) and 11-year (10.67-year) scales, respectively, with a resonance period of 13 years (13.33 years). Water discharge and sediment load of the Yellow River into the sea over the past 62 years are divided into varied phases (Figure 11). The resonance period, decadal scale period, and step-decreasing phases are similar, with the step-decreasing phases having more fluctuations. Before the 1970s, water discharge and sediment load were mainly controlled by climate change and were unaffected by human activity. Since the 1970s, water consumption in the river basin has accelerated due to the increasing demand for water by a growing population and by extensive agricultural development. The rate at which human activities have disturbed the sediment load of the middle reaches of the Yellow River in the 1980s is more than 0.81% of the rate in the 1970s (Zhou et al., 2002; Yu et al., 2007). The increase in the number of reservoirs has increasingly affected the sediment load of the Yellow River.
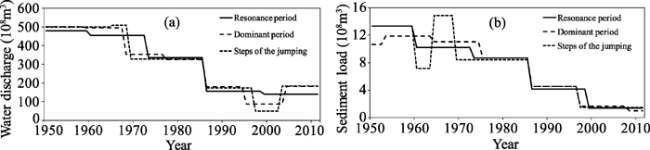
Figure 11 The jumping phases of the stepwise decline and periods of water discharge and sediment load

(a. water discharge; b. sediment load)

Some differences exist between the step-decreasing phases and the decadal periods due to some fluctuations that occurred in the two step-decreasing phases. One phase existed from 1960 to 1970, whereas the other one occurred from 1995 to 2005. The Sanmenxia Reservoirs have been used for flood detention, clear water storage, and muddy water discharge since 1960. Water discharge and sediment load from the Yellow River into the Bohai Sea obviously fluctuated between 1965 and 1970 because the Sanmenxia Reservoir was used to ameliorate the stream way, and water and soil conservation measures were implemented in the upper and middle reaches of the Yellow River. The step-decreasing phases and the decadal scale periods were not synchronized from 1995 to 2005, and the main reasons were that the water used for industry and agriculture from the upper and middle reaches of the Yellow River continued to increase rapidly, and the cut-off of the lower reaches resulted in water discharge reduction into the Bohai Sea. The water used for industry and agriculture increased to such an extent that water use from the main channel of the Yellow River accounts for approximately 52% of the natural water discharge since 2000 (Zhou et al., 2002; Yang et al., 2002; Yu et al., 2007). In addition, the areas of terraced fields, meadowland, and woodland of the Yellow River drainage area covered 0.8×10⁴ km2 before the 1960s, and this value increased to 12.25×10⁴ km2 in 1980. By the end of 1998, vegetation-covered areas covered approximately 17.13×10⁴ km2, 13 times larger than the area in 1960.

5 Conclusions

Some conclusions can be drawn as follows:
(1) In this preliminary study, the abrupt changes and multi-scale periods of water discharge and sediment load of the Yellow River at Lijin station between 1950 and 2011 were analyzed. Water discharge and sediment load significantly decreased over the past 62 years, and the most significant abrupt changes in water discharge and sediment load into the Bohai Sea occurred in 1985. The step-decreasing phases are divided by the abrupt changes (the jump points). The time series of water discharge and sediment load occurred in the first-decreasing phase in 1985, as well as in the second-decreasing phase in 1968 and in 1996. The time series of water discharge in the third-decreasing phase occurred in 1959 and 1963, whereas the time series of annual sediment load occurred in the third-decreasing phase in 1964 and 2002.
(2) The various periods were analyzed by wavelet spectral analysis. The results show that water discharge and sediment load both oscillated on decadal and inter-annual temporal scales. The fluctuation of water discharge is the strongest on the decadal scale, whereas the strongest fluctuation of the sediment load is on the inter-annual scale. The significant periods of water discharge of the Yellow River into the Bohai Sea are 9.14 years and 3.05 years between 1950 and 2011. The significant periods of the sediment load of the Yellow River into the Bohai Sea are 10.67 years, 4.27 years, and 2.78 years over the past 62 years. The multi-scale oscillations were obvious before the 1970s, but quickly weakened from then on.
(3) The cross-spectrum values between water discharge and sediment load are significant in periods of 2.86 years, 4.44 years, and 13.33 years, indicating a close relationship between the two variables on these temporal scales. The inter-annual scales between the sediment load and water discharge are similar, and the decadal scale of water discharge is approximately 0.92 year earlier than the decadal period of the sediment load. The precipitation in the region of the Yellow River has mainly affected the fluctuation of water discharge and sediment load into the Bohai Sea, especially before the 1970s. The main reason for the dramatic decrease in water discharge and sediment load is human activity, especially the increase in the number of reservoirs, with soil and water conservation starting to show influences after 1985.

The authors have declared that no competing interests exist.

1
Alongi D M, Pfitzner J, Trott L Aet al., 2005. Rapid sediment accumulation and microbial mineralization in forests of the mangrove, Kandelia candel in the Jiulongjiang Estuary, China.Estuarine, Coastal and Shelf Science, 63(4): 605-618.

2
Bakker W T, Breteler E H J K, Roos A, 1970. The dynamics of a coast with a groyne system.Coastal Engineering, 1(12): 1001-1013.

3
Cacchione D A, Wiberg P L, Lynch Jet al., 1999. Estimates of suspended-sediment flux and bedform activity on the inner portion of the Eel continental shelf.Marine Geology, 154(1): 83-97.

4
Chen Hao, Zhou Jingxing, Lu Zhongchen, 2002. Impact of environmental factors on runoff and sediment variations in middle reaches of the Yellow River.Geographical Research, 21(2): 179-187. (in Chinese)

5
Chen Xingfang, Song Wenling, 1997. QBO analysis of precipitation in China from 1986 to 1995.Quarterly Journal of Applied Meteorology, 8(4): 469-476. (in Chinese)

6
Cipriani L E, Stone G W, 2001. Net longshore sediment transport and textural changes in beach sediments along the southwest Alabama and Mississippi barrier islands, USA.Journal of Coastal Research, 17(2): 443-458.

7
Fanos A M, 1995. The impact of human activities on the erosion and accretion of the Nile delta coast.Journal of Coastal Research, 11(3): 821-833.

8
Huang Haijun, Li Fan, 2004. Conception model of land ocean interaction in the coast zone of the Yellow River delta.Advances in Earth Science, 19(5): 808-816. (in Chinese)

9
Huang Yi, Cai Jialiang, Yin Heet al., 2009. Correlation of precipitation to temperature variation in the Huang River (Yellow River) Basin during 1957-2006.Journal of Hydrology, 372(1): 1-8.

10
Li Chunhui, Yang Zhifeng, 2004. Relationship between sun activities and natural runoff in the Yellow River Basin based on Morlet wavelet.Journal of Water Resources and Water Engineering, 15(3): 1-4. (in Chinese)

11
Li Chunhui, Yang Zhifeng, 2005. Relationship between solar activities and precipitation in the Yellow River Basin.Meteorology Monthly, 2005, 31(11): 42-44. (in Chinese)

12
Li Guangxue, Wei Helong, Han Yeshenet al., 1998. Sedimentation in the Yellow River Delta (Part I): Flow and suspended sediment structure in the upper distributary and the estuary.Marine Geology, 149(1): 93-111.

13
Liu Cheng, Wang Zhaoyin, Sui Jueyi, 2008. Variation of flow and sediment of the Yellow River and their influential factors.Advances in Science and Technology of Water Resources, 28(3): 1-7. (in Chinese)

14
Liu Feng, Chen Shenliang, Peng Junet al., 2011. Temporal variability of water discharge and sediment load of the Yellow River into the sea during 1950-2008.Journal of Geographical Sciences, 21(6): 1047-1061.

15
Liu Qiang, Yang Zhifeng, Cui Baoshan, 2008. Spatial and temporal variability of annual precipitation during 1961-2006 in the Yellow River Basin, China.Journal of Hydrology, 361(3): 330-338.

16
Ma Yuanxu, Huang Heqing, Nanson G Cet al., 2012. Channel adjustments in response to the operation of large dams: The upper reach of the lower Yellow River.Geomorphology, 147(8): 35-48.

17
Ma Zhenfeng, Gao Wenliang, 2003. Relationship between interannual change over Qinghai-Xizang Plateau monsoon and climate change in upper reach of Changjiang River.Plateau Meteorology, 22(Suppl.): 8-16. (in Chinese)

18
Maheswaran R, Khosa Rakesh, 2012. Comparative study of different wavelets for hydrologic forecasting.Computers and Geosciences, 46(12): 284-295.

19
Milliman J D, Meade R H, 1983. World-wide delivery of river sediment to the oceans.The Journal of Geology, 91(1): 1-21.

20
Pan Honglei, Wang Qian, 2003. Negative impacts of reservoirs on water and sands problem of Yellow River.Bulletin of Soil and Water Conservation, 23(2): 73-76. (in Chinese)

21
Pang Jiazhen, Si Shuheng, 1979. The estuary changes of Huanghe River I. changes in modern time.Oceanologia et Limnologia Sinica, 10(2): 136-141. (in Chinese)

22
Qian Yiying, Ye Qingchao, Zhou Wenhao, 1993. Discharge and Sediment Variation of the Yellow River Mainstream and Riverbed Propagation. Beijing: China Building Materials Press, 160-202. (in Chinese)

23
Qin Yunshan, Zhao Yiyang, Zhao Songling, 1985. Geology of the Bohai Sea. Beijing: Science Press, 30-45. (in Chinese)

24
Ren Mei’e, 2006. Sediment discharge of the Yellow River, China: Past, present and future: A synthesis.Advances in Earth Science, 21(6): 551-563. (in Chinese)

25
Ren Mei’e, Shi Yunliang, 1986. Sediment discharge of the Yellow River (China) and its effect on the sedimentation of the Bohai and the Yellow Sea.Continental Shelf Research, 6(6): 785-810.

26
Semeniuk V, 1996. Coastal forms and quaternary processes along the arid Pilbara coast of northwestern Australia. Palaeogeography, Palaeoclimatology, Palaeoecology, 123(1): 49-84.

27
Sun Weiguo, Cheng Binyan, Li Rong, 2009. Multitime scale correlations between runoff and regional climate variations in the source region of the Yellow River.Acta Geographica Sinica, 64(1): 117-127. (in Chinese)

28
Tang Maocang, Bai Chongyuan, Feng Song, 1998. Climate plateau in recent century and its relation to astromical factors.Plateau Meteorology, 17(3): 250-257. (in Chinese)

29
Walling D E, Fang D, 2003. Recent trends in the suspended sediment loads of the world’s rivers.Global and Planetary Change, 39(1): 111-126.

30
Wang Hailong, Li Guosheng, 2006. Wavelet study on the multi-scale oscillation of discharge and suspended sediment from the Yellow River to the Bohai Sea.Progress in Natural Science, 16(12): 1639-1644. (in Chinese)

31
Wang Hongfa, 2012. Clustering of hydrological time series based on discrete wavelet transform.Physics Procedia, 25(1): 1966-1972.

32
Wang Houjie, Yang Zuosheng, Yoshiki Saitoet al., 2006. Interannual and seasonal variation of the Huanghe (Yellow River) water discharge over the past 50 years: Connections to impacts from ENSO events and dams.Global and Planetary Change, 50(3): 212-225.

33
Wang Houjie, Yang Zuosheng, Yoshiki Saitoet al., 2007. Stepwise decreases of the Huanghe (Yellow River) sediment load (1950-2005): Impacts of climate change and human activities.Global and Planetary Change, 57(3): 331-354.

34
Wang Suiling, Li Ling, Yan Ming, 2013. The contributions of climate change and human activities to the runoff yield changes in the middle Yellow River Basin.Geographical Research, 32(3): 395-402. (in Chinese)

35
Wang Xiaochun, Wu Guoxiong, 1997. The analysis of the relationship between the spatial modes of summer precipitation anomalies over china and the general circulation.Scientia Atmospherica Sinica, 21(2): 161-169. (in Chinese)

36
Wang Yin, Zhang Yongzhan, 1998. Human activities, break-off water discharge of the Yellow River and impacts on coastal environment.Journal of Nanjing University, 34(3): 257-271. (in Chinese)

37
Wang Yin, Zhu Dakui, 1990. Tidal flats of China.Quaternary Sciences, 10(4): 291-300. (in Chinese)

38
Wang Yucheng, Liu Zhe, Gao Huiwanget al., 2011. Response of salinity distribution around the Yellow River mouth to abrupt changes in river discharge.Continental Shelf Research, 31(6): 685-694.

39
Wei Zhigang, Huang Ronghui, Dong Wenjie, 2003. Interannual and interdecadal variations of air temperature and precipitation over the Tibetan plateau.Chinese Journal of Atmospheric Sciences, 27(2): 157-170. (in Chinese)

40
William J Emery, Richard E Thomson, 2001. Data Analysis Methods in Physical Oceanography. United Kingdom: Elsevier’s Department, 371-567.

41
Xu Jiongxin, 2002. A study of thresholds of runoff and sediment for the land accretion of the Yellow River Delta.Geographical Research, 21(2): 163-170. (in Chinese)

42
Xu Jiongxin, 2003. Sediment flux into the sea as influenced by the changing human activities and precipitation: Example of the Huanghe River, China.Acta Oceanologica Sinica, 25(5): 125-135. (in Chinese)

43
Xu M, Ye B S, Zhao Q Det al., 2013. Estimation of water balance in the source region of the Yellow River based on GRACE satellite data.Journal of Arid Land, 5(3): 384-395.

44
Yang Dawen, Li Chong, Hu Hepinget al., 2004. Analysis of water resources variability in the Yellow River of China during the last half century using historical data.Water Resources Research, 40(6): 1-12.

45
Yang Zhifeng, Li Chunhui, 2004. Abrupt and periodic changes of the annual natural runoff in the subregions of the Yellow River.Journal of Mountain Science, 22(2): 140-146. (in Chinese)

46
Yang Zuosheng, Ji Youjun, Bi Naishuanget al., 2011. Sediment transport off the Huanghe (Yellow River) delta and in the adjacent Bohai Sea in winter and seasonal comparison. Estuarine, Coastal and Shelf Science, 93(3): 173-181.

47
Yoshiki Saito, Yang Zuosheng, Hori Kazuaki, 2001. The Huanghe (Yellow River) and Changjiang (Yangtze River) deltas: A review on their characteristics, evolution and sediment discharge during the Holocene.Geomorphology, 41(2): 219-231.

48
Yu Tao, Deng Yixiang, Fu Guo, 2007. Analysis on characteristics and reasons of sediment discharge variation of the Yellow River in last 50 years.Yellow River, 29(12): 27-30. (in Chinese)

49
Yue Tianxiang, Liu Jiyuan, Jorgensen Sven Eriket al., 2003. Landscape change detection of the newly created wetland in Yellow River Delta.Ecological Modelling, 164(1): 21-31.

50
Zhao Fangfang, Xu Zongxue, Huang Junxiong, 2007. Long-term trend and abrupt change for major climate variables in the upper Yellow River Basin. Acta Meteorologica Sinica, 21(2): 204-214.

51
Zhao Ye’an, Pan Xiandi, Shen Guanqing, 1992. Basin situation of runoff and sediment of the Yellow River and its characteristic in the eighties.Yellow River, 80(4): 11-20. (in Chinese)

52
Zhou Xiaoxia, Yang Zuosheng, 2002. Variations in the Yellow River water discharge and sediment load into the sea in the last 48 years and their response to human activities in the river basin.Coastal Engineering, 21(1): 6-15. (in Chinese)

Outlines

/