
Journal of Geographical Sciences >
Assessment of meteorological disasters based on information diffusion theory in Xinjiang, Northwest China
*Corresponding author: Chen Yaning (1958-), Professor, E-mail:chenyn@ms.xjb.ac.cn
Author: Wu Meihua, PhD, specialized in risk assessment of natural disasters. E-mail:wumeihua1026@163.com; xcc0110@163.com
Received date: 2014-01-07
Accepted date: 2014-05-05
Online published: 2015-01-15
Supported by
National Natural Science Foundation of China, No.41305125
No.U1203281
National Basic Research Program of China (973 Program), No.2010CB951003
Copyright
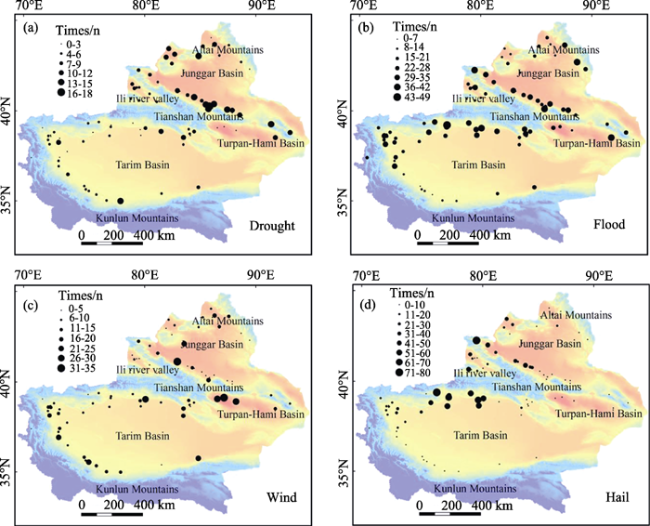
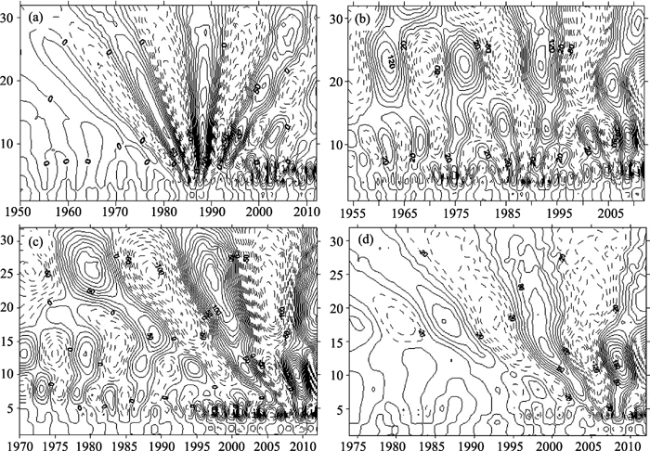
Data of flood, drought, hailstorms, and low temperature events in Xinjiang from 1949 to 2012 were analyzed with the diffusion method to assess the risk of the most common types of disasters in Xinjiang. It was proved that the frequency and intensity of meteorological disasters of the study area showed an increasing trend associated with global warming. Among the four types of disasters, surpass probability of drought was the largest, followed by hailstorm, low temperature and flood in turn. Moreover, the wavelet method analysis revealed that greater oscillations had occurred since 2000, which may be associated with the occurrence of extreme climatic changes. The spatial distribution of frequencies reveals that the northern slope of Tianshan Mountains is a multiple disaster area, the southern slope of Tianshan is the area where more floods and hailstorms occur, and the west of Turpan-Hami Basin is the area wind is prevalent. The relationships between disaster-affected areas and corresponding meteorological and socio-economic indexes were also analyzed. It indicated that there were significant positive correlations between the areas affected and the most meteorological and socio-economic indicators except the grain acreage.
Key words: risk assessment; meteorological disaster; information diffusion; Xinjiang
WU Meihua , CHEN Yaning , XU Changchun . Assessment of meteorological disasters based on information diffusion theory in Xinjiang, Northwest China[J]. Journal of Geographical Sciences, 2015 , 25(1) : 69 -84 . DOI: 10.1007/s11442-015-1154-2
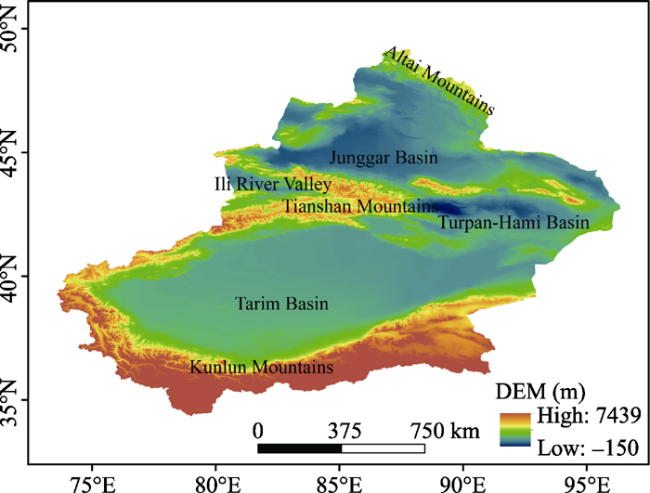
Figure 1 Map of the study area |
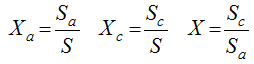
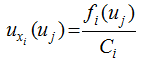
 can be called the normalized information distribution of sample xi.
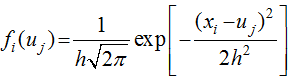
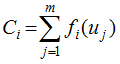
 . If we let x1, x2,..., xn be the n specified observation values, then the function can be called the information quantum diffused from the sample of X={x1, x2, ..., xn} to the observation point of μj. This can be represented as:
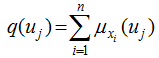
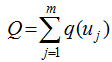
 .
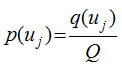
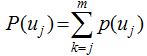
. , thereby satisfying:
 is regarded as a given energy limited signal, the Continuous Wavelet Transform (CWT) is:
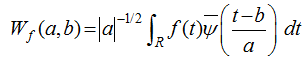
 is complex conjugate function of
  . Because most of the time series data observed in geography are a discrete set function f(kΔt), (k=1, 2, …, N; Δtas sample interval), then (11) discrete wavelet transform is as follows:
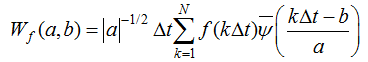
Table 1 Affected area and covered area by decadal meteorological disasters |
| Age | M. A. | |||||||
|---|---|---|---|---|---|---|---|---|
| A1 | A2 | B1 | B2 | C1 | C2 | D1 | D2 | |
| 1950s | 12.3 | 5.22 | 70.47 | 33.21 | 6.89 | |||
| 1960s | 13.99 | 4.83 | 205.41 | 143.95 | 25.07 | 12.27 | ||
| 1970s | 11.65 | 4.28 | 200.41 | 118.52 | 55.64 | 45.33 | 57.44 | 56.83 |
| 1980s | 95.02 | 28.45 | 243.73 | 166.03 | 74 | 36.67 | 36.87 | 17.33 |
| 1990s | 80.02 | 47.91 | 332.82 | 139.26 | 132.4 | 74.67 | 113.57 | 54.8 |
| 2000s | 73.8 | 39.57 | 455.79 | 312.78 | 228.05 | 121.33 | 176.89 | 102.91 |
*M.A. is mean area, A1 is affected area by flood, 1×10³ hm2, A2 is covered area by flood, 1×10³ hm2, B1 is affected area by drought, 1×10³ hm2, B2 is covered area by drought, 1×10³ hm2, C1 is affected area by hailstorms, 1×10³ hm2, C2 is covered area by hailstorms, 1×10³ hm2, D1 is affected area by low temperature, 1×10³ hm2, D2 is covered area by low temperature, 1×10³ hm2. **The data of Table 1 are obtained from Chinese Planting Information. |
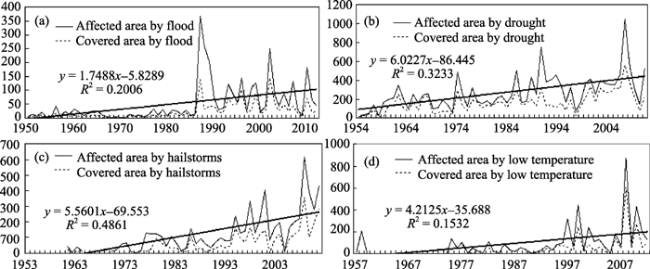
Figure 2 Affected and covered area by disasters in Xinjiang (a. Flood; b. Drought; c. Hailstorms; d. Low temperature) |
Figure 3 The spatial distribution of frequencies of disasters in Xinjiang from 1949 to 2000(a. Drought; b. Flood; c.Wind; d. Hailstorms) |
Table 2 Surpass probability of ratio affected by all kinds of disasters |
| Ratio affected | 0.01 | 0.02 | 0.03 | 0.04 | 0.05 | 0.06 | 0.07 | 0.08 | 0.09 | 0.10 | 0.11 | 0.12 | 0.13 | |
|---|---|---|---|---|---|---|---|---|---|---|---|---|---|---|
| 1 | S.P. | 0.75 | 0.52 | 0.37 | 0.24 | 0.16 | 0.14 | 0.11 | 0.08 | 0.05 | 0.04 | 0.04 | 0.03 | 0.01 |
| R.I. | 1.34 | 1.93 | 2.70 | 4.14 | 6.12 | 7.09 | 8.84 | 13.30 | 19.5 | 26.80 | 28.10 | 32.60 | 86.80 | |
| 2 | S.P. | 1 | 0.98 | 0.96 | 0.93 | 0.89 | 0.83 | 0.76 | 0.70 | 0.63 | 0.54 | 0.44 | 0.33 | 0.25 |
| R.I. | 1 | 1.02 | 1.04 | 1.08 | 1.13 | 1.21 | 1.31 | 1.43 | 1.60 | 1.85 | 2.28 | 3.01 | 4.00 | |
| 3 | S.P. | 0.97 | 0.85 | 0.69 | 0.55 | 0.40 | 0.28 | 0.22 | 0.18 | 0.12 | 0.09 | 0.07 | 0.05 | 0.03 |
| R.I. | 1.03 | 1.18 | 1.45 | 1.81 | 2.49 | 3.60 | 4.53 | 5.71 | 8.23 | 10.6 | 13.70 | 19.20 | 38.20 | |
| 4 | S.P. | 0.8 | 0.58 | 0.39 | 0.26 | 0.20 | 0.18 | 0.16 | 0.14 | 0.12 | 0.09 | 0.08 | 0.07 | 0.06 |
| R.I. | 1.25 | 1.72 | 2.55 | 3.78 | 4.99 | 5.67 | 6.2 | 6.97 | 8.25 | 10.6 | 13.00 | 14.80 | 17.90 | |
| Ratio affected | 0.14 | 0.15 | 0.16 | 0.17 | 0.18 | 0.19 | 0.2 | 0.21 | 0.22 | 0.23 | 0.24 | 0.25 | ||
| 2 | S.P. | 0.2 | 0.16 | 0.13 | 0.11 | 0.09 | 0.08 | 0.07 | 0.07 | 0.07 | 0.06 | 0.04 | 0.02 | |
| R.I. | 5.09 | 6.31 | 7.83 | 9.51 | 11.30 | 12.9 | 13.80 | 14.1 | 14.60 | 16.80 | 23.70 | 45.30 | ||
| 4 | S.P. | 0.04 | 0.04 | 0.04 | 0.04 | 0.03 | 0.02 | 0.01 | ||||||
| R.I. | 23.3 | 27.3 | 28.2 | 28.4 | 30.2 | 40.20 | 89.30 | |||||||
**1 is Flood, 2 is Drought, 3 is Hailstorms, 4 is Low temperature; *S.P. is Surpass probability of disaster risk, %; R.I. is Recurrence interval, year. |
Table 3 Surpass probability of ratio covered by all kinds of disasters |
| Ratio covered | 0.01 | 0.02 | 0.03 | 0.04 | 0.05 | 0.06 | 0.07 | |
|---|---|---|---|---|---|---|---|---|
| Flood | S.P. | 0.5 | 0.19 | 0.11 | 0.06 | 0.003 | ||
| R.I. | 1.99 | 5.4 | 9.48 | 15.4 | 292 | |||
| Drought | S.P. | 0.98 | 0.94 | 0.9 | 0.8 | 0.61 | 0.47 | 0.35 |
| R.I. | 1.02 | 1.07 | 1.11 | 1.25 | 1.64 | 2.14 | 2.82 | |
| Hailstorms | S.P. | 0.77 | 0.58 | 0.39 | 0.21 | 0.12 | 0.04 | 0.03 |
| R.I. | 1.29 | 1.73 | 2.55 | 4.76 | 8.5 | 23.4 | 28.7 | |
| Low temperature | S.P. | 0.56 | 0.29 | 0.16 | 0.12 | 0.1 | 0.08 | 0.06 |
| R.I. | 1.79 | 3.47 | 6.28 | 8.68 | 9.87 | 12.3 | 16.7 | |
| Ratio covered | 0.08 | 0.09 | 0.1 | 0.11 | 0.12 | 0.13 | 0.14 | |
| Drought | S.P. | 0.23 | 0.16 | 0.1 | 0.05 | 0.03 | 0.004 | |
| R.I. | 4.33 | 6.26 | 9.71 | 20.2 | 34.2 | 249 | ||
| Wind hailstorms | S.P. | 0.01 | ||||||
| R.I. | 93.3 | |||||||
| Low temperature | S.P. | 0.04 | 0.04 | 0.04 | 0.04 | 0.04 | 0.03 | 0.01 |
| R.I. | 24.4 | 27.8 | 28 | 28 | 28.6 | 38.1 | 135 |
**R.P. is Surpass probability of disaster risk, %; R.I. is Recurrence interval, year |
Table 4 Surpass probability of integrated disaster risk |
| 0.1 | 0.2 | 0.3 | 0.4 | 0.5 | 0.6 | 0.7 | 0.8 | ||
|---|---|---|---|---|---|---|---|---|---|
| A.I. | S.P. | 0.99 | 0.62 | 0.09 | 0.04 | 0.01 | |||
| R.I. | 1.01 | 1.61 | 11.5 | 28 | 164 | ||||
| C.I. | S.P. | 0.63 | 0.04 | 0.01 | |||||
| R.I. | 1.6 | 27.5 | 129 | ||||||
| I.I. | S.P. | 1 | 1 | 1 | 0.89 | 0.67 | 0.35 | 0.08 | 0.02 |
| R.I. | 1 | 1 | 1 | 1.13 | 1.5 | 2.85 | 12.7 | 60.5 | |
**A.I. is Ratio affected by integrated disaster, C.I. is Ratio covered by integrated disaster, I.I. is Intensity of integrated disaster; *S.P. is Surpass probability of disaster risk, %; R.I. is Recurrence interval, year. |
Figure 4 Wavelet coefficient of area affected by disasters(a. Flood; b. Drought; c. Hailstorms; d. Low temperature) |
Table 5 Correlation coefficient of index and area affected by meteorological disasters in Xinjiang from 1961 to 2012 |
| Area affected | 1 | 2 | 3 | 4 | 5 | 6 | 7 | 8 |
|---|---|---|---|---|---|---|---|---|
| Flood | 0.571** | 0.273 | 0.406** | 0.116 | 0.397** | 0.498** | 0.235 | 0.276 |
| Drought | -0.05 | 0.416** | 0.424** | 0.365** | 0.501** | 0.451** | 0.507** | 0.472** |
| Wind hailstorms | 0.382** | 0.567** | 0.605** | 0.514** | 0.658** | 0.528** | 0.693** | 0.710** |
| Low temperature | 0.049 | 0.409* | 0.414* | 0.416* | 0.480** | 0.409* | 0.572** | 0.557** |
| Area affected | 9 | 10 | ||||||
| 11 | 12 | 13 | 14 | 12 | 13 | 14 | ||
| Flood | 0.197 | -0.453** | 0.301* | 0.409** | 0.454** | 0.264 | 0.477** | |
| Drought | 0.492** | -0.421** | 0.531** | 0.310* | 0.462** | 0.548** | 0.510** | |
| Wind hailstorms | 0.697** | -0.326** | 0.647** | 0.227 | 0.681** | 0.652** | 0.612** | |
| Low temperature | 0.563** | -0.192 | 0.532** | 0.114 | 0.434** | 0.556** | 0.414* | |
* Correlation is significant at the 0.01 level (2-tailed);* * Correlation is significant at the 0.05 level (2-tailed). ***1 is Precipitation, 2 is Mean annual temperature, 3 is Annual mean minimum temperature, 4 is Annual mean maximum temperature, 5 is Total population, 6 is Urban population, 7 is GDP, 8 is Gross output value of agriculture, 9 is Cultivated area, 10 is Yield, 11 is Crop, 12 is Food, 13 is Cotton, 14 is Oil plants. |
The authors have declared that no competing interests exist.
| 1 |
|
| 2 |
|
| 3 |
|
| 4 |
|
| 5 |
|
| 6 |
|
| 7 |
|
| 8 |
|
| 9 |
|
| 10 |
|
| 11 |
|
| 12 |
|
| 13 |
|
| 14 |
|
| 15 |
|
| 16 |
|
| 17 |
|
| 18 |
|
| 19 |
|
| 20 |
|
| 21 |
|
| 22 |
|
| 23 |
|
| 24 |
|
| 25 |
|
| 26 |
|
| 27 |
|
| 28 |
|
| 29 |
|
| 30 |
|
| 31 |
|
| 32 |
|
| 33 |
|
| 34 |
|
| 35 |
|
| 36 |
|
| 37 |
|
| 38 |
|
/
| 〈 |
|
〉 |