
Journal of Geographical Sciences >
Changes in daily extreme precipitation events in South China from 1961 to 2011
*Corresponding author: Zhang Mingjun, Professor, E-mail:mjzhang2004@163.com
Author: Ren Zhengguo (1989-), MS Candidate, specialized in global change and sustainable development. E-mail:Georen@126.com
Received date: 2014-05-20
Accepted date: 2014-06-15
Online published: 2015-01-15
Supported by
National Basic Research Program of China (973Program), No.2013CBA01801
National Natural Science Foundation of China, No.41161012
Copyright
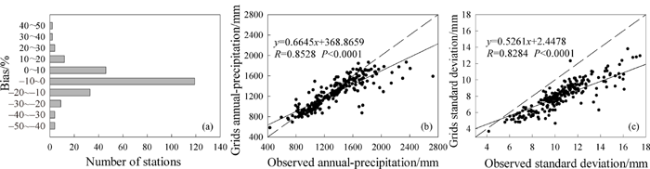
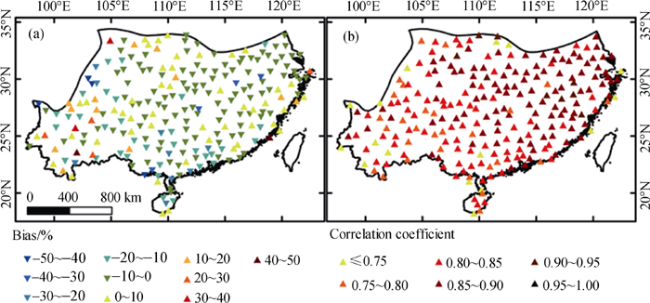
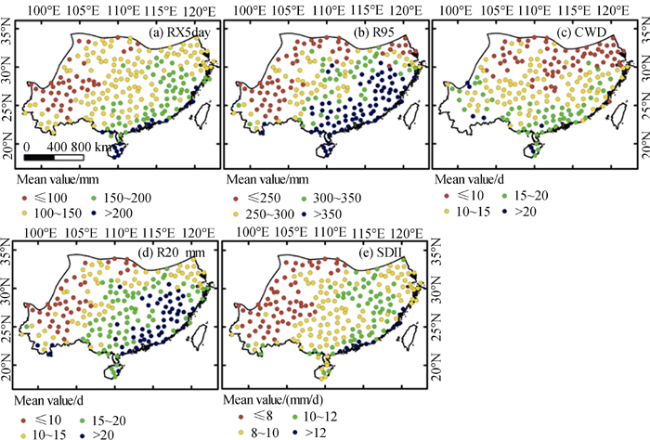
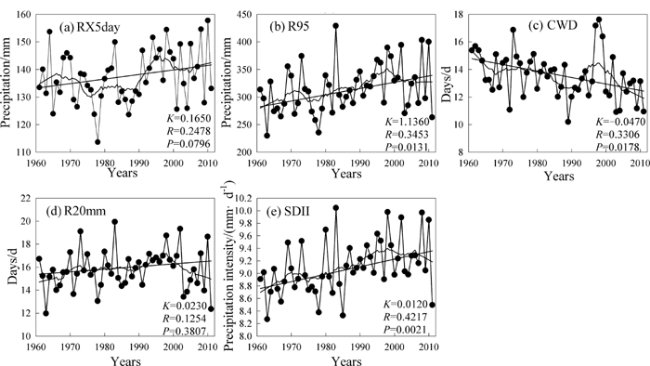
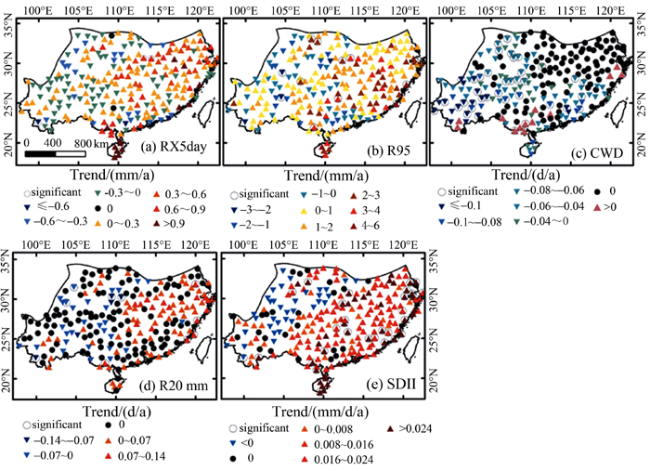
Based on the daily precipitation from a 0.5°×0.5° gridded dataset and meteorological stations during 1961-2011 released by National Meteorological Information Center, the reliability of this gridded precipitation dataset in South China was evaluated. Five precipitation indices recommended by the World Meteorological Organization (WMO) were selected to investigate the changes in precipitation extremes of South China. The results indicated that the bias between gridded data interpolated to given stations and the corresponding observed data is limited, and the proportion of the number of stations with bias between -10% and 0 is 50.64%. The correlation coefficients between gridded data and observed data are generally above 0.80 in most parts. The average of precipitation indices shows a significant spatial difference with drier northwest section and wetter southeast section. The trend magnitudes of the maximum 5-day precipitation (RX5day), very wet day precipitation (R95), very heavy precipitation days (R20mm) and simple daily intensity index (SDII) are 0.17 mm·a-1, 1.14 mm·a-1, 0.02 d·a-1 and 0.01 mm·d-1·a-1, respectively, while consecutive wet days (CWD) decrease by -0.05 d·a-1 during 1961-2011. There is spatial disparity in trend magnitudes of precipitation indices, and approximate 60.85%, 75.32% and 75.74% of the grid boxes show increasing trends for RX5day, SDII and R95, respectively. There are high correlations between precipitation indices and total precipitation, which is statistically significant at the 0.01 level.
Key words: precipitation extremes; gridded data; South China
REN Zhengguo , ZHANG Mingjun , WANG Shengjie , QIANG Fang , ZHU Xiaofan , DONG Lei . Changes in daily extreme precipitation events in South China from 1961 to 2011[J]. Journal of Geographical Sciences, 2015 , 25(1) : 58 -68 . DOI: 10.1007/s11442-015-1153-3
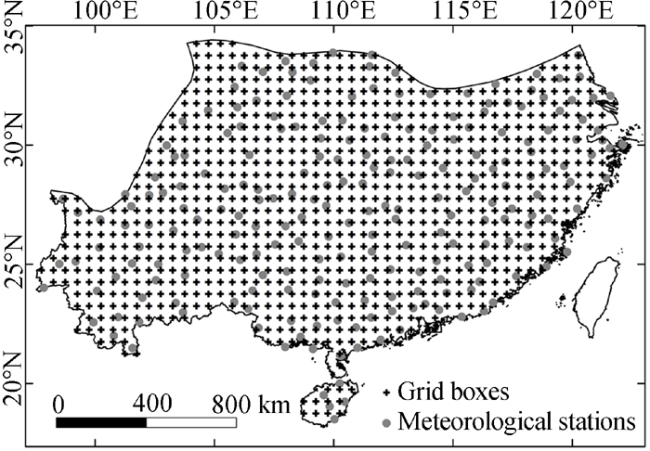
Figure 1 Map showing the distribution of observation stations and grid boxes in South China |
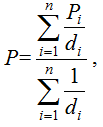
Table 1 Definition of precipitation indices in this study |
| Index | Descriptive name | Definition | Units |
|---|---|---|---|
| RX5day | Maximum 5-day precipitation | Annual maximum consecutive 5-day precipitation | mm |
| R95 | Very wet day precipitation | Annual total precipitation when RR>95th percentile of 1961-2011 daily rainfall | mm |
| SDII | Simple daily intensity index | Average precipitation on wet days | mm·d-1 |
| CWD | Consecutive wet days | Maximum number of consecutive wet days | d |
| R20mm | Very heavy precipitation days | Annual count of days when RR≥20 mm | d |
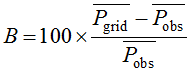
 and
and  are the mean value of interpolated grids and observed stations, respectively.
Figure 2 Number distribution of interpolated grids for different bias ranges (a), and relationship of annual average precipitation (b) and standard deviation on daily basis (c) between observation stations and interpolated grids in South China during 1961-2011 |
Figure 3 Spatial distribution of biases of interpolated gridded precipitation (a) and correlation coefficient of annual precipitation between interpolated grids and observation stations (b) in South China during 1961-2011 |
Figure 4 Spatial distribution of annual mean precipitation indices in South China during 1961-2011 |
Figure 5 Interannual variation of precipitation indices in South China during 1961-2011 |
Figure 6 Spatial distribution of trend magnitude of precipitation indices in South China during 1961-2011 |
Table 2 Factor loadings and explained variances in precipitation indices in South China during 1961-2011 |
| Factor | Annual precipitation | RX5day | R95 | CWD | R20mm | SDII | Variance (%) |
|---|---|---|---|---|---|---|---|
| 1 | 0.875 | 0.737 | 0.942 | 0.330 | 0.940 | 0.851 | 65.209 |
| 2 | 0.248 | -0.020 | -0.241 | 0.907 | 0.046 | -0.371 | 18.046 |
Table 3 Correlation coefficients of precipitation indices in South China during 1961-2011 |
| Annual precipitation | RX5day | R95 | CWD | R20mm | SDII | |
|---|---|---|---|---|---|---|
| Annual precipitation | 1 | |||||
| RX5day | 0.492** | 1 | ||||
| R95 | 0.731** | 0.709** | 1 | |||
| CWD | 0.412** | 0.261 | 0.115 | 1 | ||
| R20mm | 0.937** | 0.508** | 0.839** | 0.299* | 1 | |
| SDII | 0.565** | 0.570** | 0.887** | 0.021 | 0.769** | 1 |
Note: * Statistical significance at the 0.05 level. ** Statistical significance at the 0.05 level. |
The authors have declared that no competing interests exist.
| 1 |
|
| 2 |
|
| 3 |
|
| 4 |
|
| 5 |
|
| 6 |
|
| 7 |
|
| 8 |
|
| 9 |
|
| 10 |
|
| 11 |
|
| 12 |
|
| 13 |
|
| 14 |
|
| 15 |
|
| 16 |
|
| 17 |
|
| 18 |
|
| 19 |
|
| 20 |
|
| 21 |
|
| 22 |
|
| 23 |
|
| 24 |
|
| 25 |
|
| 26 |
|
| 27 |
|
| 28 |
|
| 29 |
|
| 30 |
|
| 31 |
|
| 32 |
|
| 33 |
|
| 34 |
|
| 35 |
|
| 36 |
|
| 37 |
|
| 38 |
|
/
| 〈 |
|
〉 |