
Journal of Geographical Sciences >
Spatial characteristics of development efficiency for urban tourism in eastern China: A case study of six coastal urban agglomerations
*Corresponding author: Wu Dianting (1958-), Professor, E-mail: wudianting@bnu.edu.cn
www.geogsci.com www.springerlink.com/content/1009-637x
Author: Li Rui (1984-), PhD, specialized in urban and regional tourism, ethnical village tourism. E-mail: liruigznu2008@163.com
Received date: 2013-08-30
Accepted date: 2014-01-20
Online published: 2014-06-20
Supported by
National Natural Science Foundation of China, No.41401158.No.41140007.No.41261035
Copyright
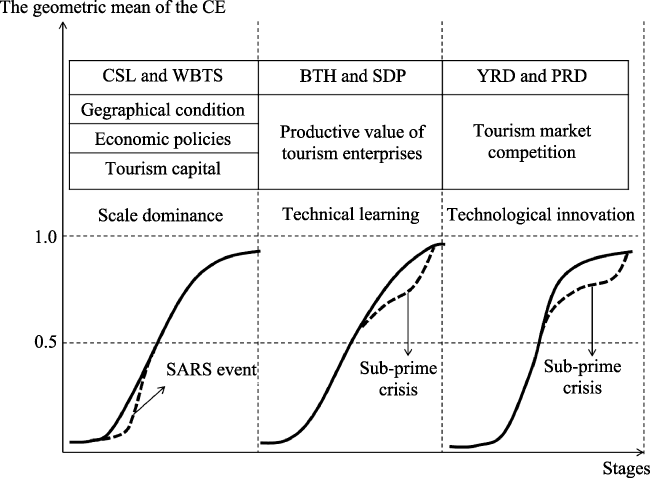
The traditional data envelopment analysis (DEA), bootstrap-DEA and Malmquist models are employed to measure different tourism efficiencies and their spatial characteristics of 61 cities in six coastal urban agglomerations in eastern China. The following conclusions are drawn. (1) The comprehensive efficiency (CE) of urban tourism using the bootstrap-DEA model is lower than the CE level using the DEA-CRS model, which confirms the significant tendency of the DEA-CRS model to overestimate results. (2) The geometric CE averages of urban tourism in the Yangtze River Delta (YRD) and the Pearl River Delta (PRD) have changed from ineffective to effective since 2000, the averages in the Beijing-Tianjin- Hebei (BTH) and the Shandong Peninsula (SDP) have changed from ineffective to moderately effective since 2000, and those in the Central and Southern Liaoning (CSL) and the West Bank of Taiwan Strait (WBTS) have been ineffective since 2000. (3) The CE values of urban tourism in the PRD, the YRD, the BTH and the SDP have been slightly affected by the pure technical efficiency (PTE), whereas the CE values in the CSL and the WBTS have been slightly affected by the scale efficiency (SE) since 2000. (4) Spatially, the range of geometric averages of the total factor productivity (TFP) for the PRD, the YRD, the BTH, the SDP, the WBTS and the CSL has decreased sequentially, while the one for most cities in six urban agglomerations has exhibited a downward trend since 2000. (5) Collectively, the natural conditions, the economic policies and the tourism capital drive the SE change of urban tourism of the CSL and the WBTS. The tourism enterprises for increasing returns to scale and imitating innovative technology have an effect on the CE change of urban tourism in the BTH and the SDP. The tourism market competition drives the PTE change of urban tourism in the PRD and the YRD. Although the PTE and the SE of urban tourism in six coastal urban agglomerations suffer from uncertain events, the CE maintained overall sound momentum since
LI Rui , GUO Qian , WU Dianting , YIN Hongmei , ZHANG Hua , ZHU Taoxing . Spatial characteristics of development efficiency for urban tourism in eastern China: A case study of six coastal urban agglomerations[J]. Journal of Geographical Sciences, 2014 , 24(6) : 1175 -1197 . DOI: 10.1007/s11442-014-1146-7
Table 1 Measurement indices of input-output efficiency of urban tourism |
| Evaluation contents | Types | First grade indices | Second grade indices | Index sources |
|---|---|---|---|---|
| Development efficiency of urban tourism | Input indices | Labour inputs | Number of employees in urban tourism | Barros, Ma Xiaolong, Cao Fnagdong |
| Capital inputs | Number of 3A, 4A and 5A scenic spots | Tsaur, Barros, Liang Mingshu, Cao Fangdong | ||
| Number of 3-star, 4-star and 5-star hotels | ||||
| Number of international travel agencies | ||||
| Number of domestic travel agencies | ||||
| Output indices | Efficiency outputs | Total number of tourists | Anderson, Ma Xiaolong, Cao Fnagdong | |
| Total quantity of tourism incomes |
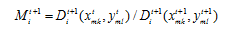
 is introduced in Formula
 such that
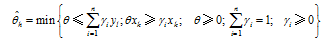
 is obtained by solving equation (7) such that
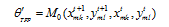
 and
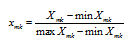
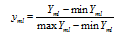
and  are the standardised values in the units of k or l (factors) and
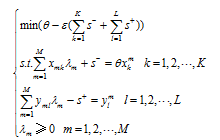
 is introduced by Fare’s reciprocal of technology efficiency (Fare, 1994), which is expressed as follows:
 is compressed to a perfect input value. Therefore, the total factor productivity (TFP) of urban tourism can be represented by the Malmquist index (Caves, 1982).
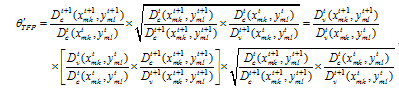
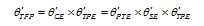
 is the total factor productivity,
  is the comprehensive efficiency,
  is the technical progress efficiency,
  is the pure technical efficiency and
  is the scale efficiency from t to t+1. Generally, these efficiencies will increase if their indices exceed one. If the indices are equivalent to or less than one, these efficiencies will be unchanged or reduced.
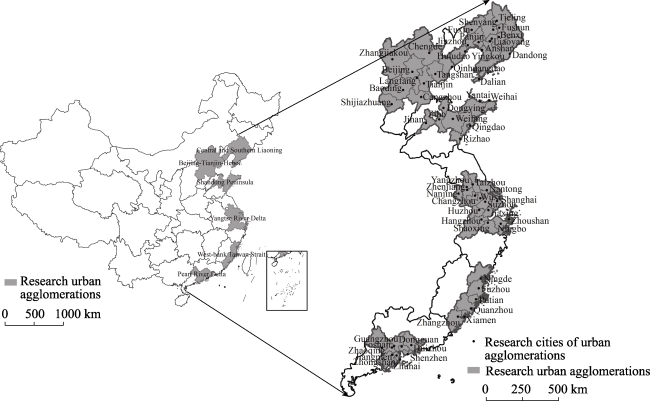
Figure 1 Spatial diagram of six coastal urban agglomerations in China, including their 61 cities |
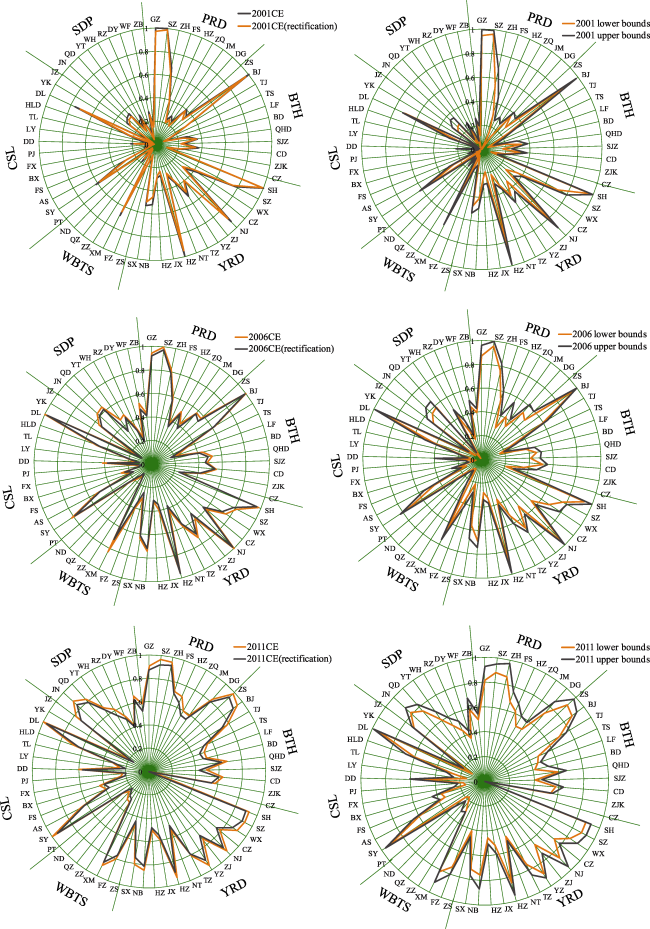
Figure 2 Radar charts of rectification values and the interval bound values of the CE of urban tourism in six urban agglomerations since 20001 |
Table 2 Geometric means of the CE and the PTE and the SE of urban tourism in six coastal urban agglomerations in eastern China |
| Name | 2001CE | 2006CE | 2011CE | 2001PTE | 2006PTE | 2011PTE | 2001SE | 2006SE | 2011SE |
|---|---|---|---|---|---|---|---|---|---|
| YRD | 0.485 | 0.627 | 0.743 | 0.659 | 0.777 | 0.878 | 0.740 | 0.821 | 0.879 |
| BTH | 0.295 | 0.463 | 0.530 | 0.514 | 0.646 | 0.725 | 0.561 | 0.722 | 0.745 |
| PRD | 0.478 | 0.619 | 0.766 | 0.657 | 0.767 | 0.864 | 0.737 | 0.820 | 0.923 |
| SDP | 0.202 | 0.428 | 0.606 | 0.461 | 0.645 | 0.750 | 0.478 | 0.721 | 0.848 |
| WBTS | 0.188 | 0.278 | 0.374 | 0.350 | 0.502 | 0.599 | 0.457 | 0.568 | 0.693 |
| CSL | 0.195 | 0.356 | 0.484 | 0.401 | 0.559 | 0.655 | 0.467 | 0.620 | 0.752 |
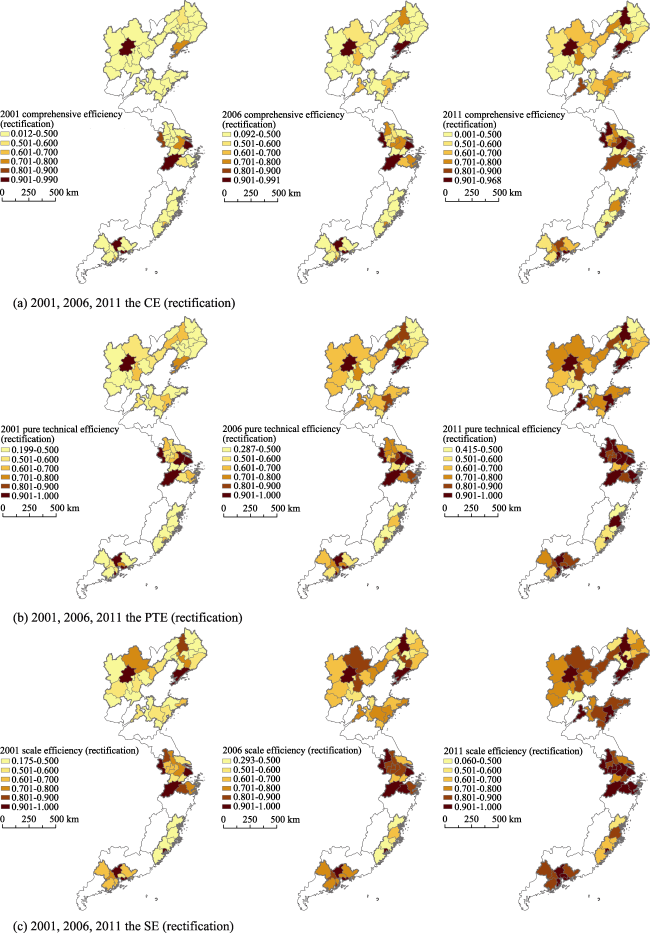
Figure 3 Spatial patterns of the CE and the PTE and the SE of urban tourism in the coastal urban agglomerations |
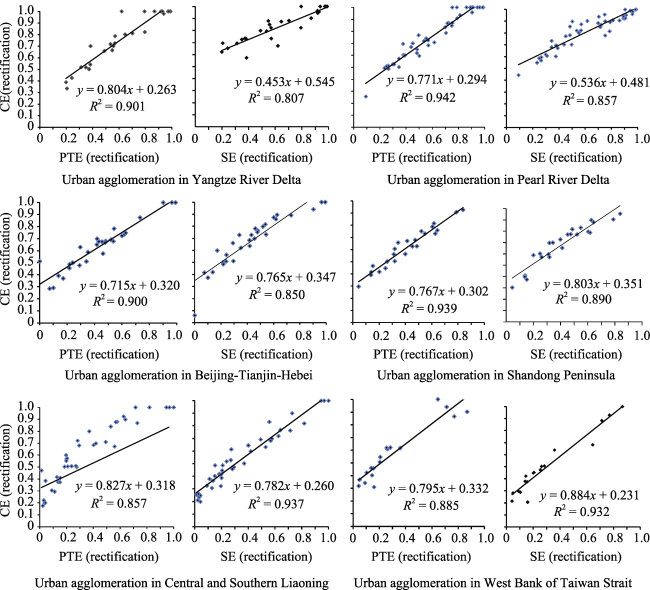
Figure 4 Scatter plots of the contribution of decomposing efficiencies to the CE of urban tourism in six coastal urban agglomerations in eastern China (2001-2011) |
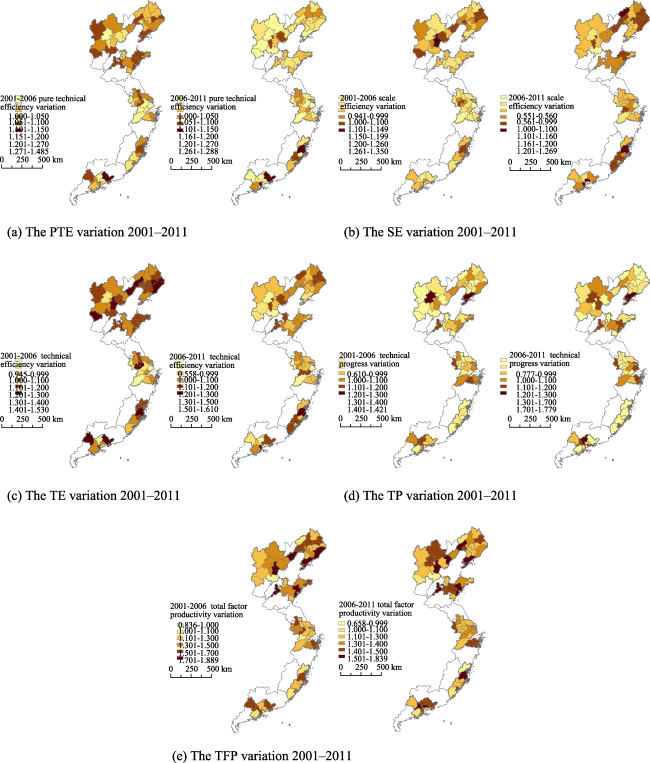
Table 3 Geometric means of the variations of the PTE, the SE, the TE, the TP and the TFP of urban tourism in six coastal urban agglomerations in eastern China (2001-2011) |
| Name | 2001 -2006 PTE | 2006 -2011 PTE | 2001 -2006 SE | 2006 -2011 SE | 2001 -2006 TE | 2006 -2011 TE | 2001 -2006 TP | 2006 -2011 TP | 2001 -2006 TFP | 2006 -2011 TFP |
|---|---|---|---|---|---|---|---|---|---|---|
| YRD | 1.184 | 1.105 | 1.078 | 1.004 | 1.226 | 1.277 | 1.174 | 1.134 | 1.441 | 1.333 |
| BTH | 1.158 | 1.096 | 1.108 | 1.059 | 1.309 | 1.164 | 1.104 | 1.109 | 1.440 | 1.313 |
| PRD | 1.150 | 1.138 | 1.083 | 1.096 | 1.274 | 1.244 | 1.114 | 1.157 | 1.456 | 1.380 |
| SDP | 1.135 | 1.092 | 1.105 | 1.099 | 1.333 | 1.238 | 1.082 | 1.061 | 1.327 | 1.281 |
| WBTS | 1.130 | 1.076 | 1.151 | 1.127 | 1.308 | 1.081 | 1.012 | 1.009 | 1.306 | 1.225 |
| CSL | 1.114 | 1.076 | 1.158 | 1.121 | 1.202 | 1.195 | 1.001 | 1.011 | 1.240 | 1.204 |
Figure 5 Spatial patterns of the variations in the PTE, the SE, the TE, the TP and the TFP of urban tourism in six coastal urban agglomerations in eastern China (2001-2011) |
Table 4 Influencing factors of the PTE, the SE, and the CE for urban tourism in six coastal urban agglomerations in eastern China (2001-2011) |
| Influencing factors | Attractions number | Tourists number | Tourism documents number | Tourism input capital | Competitive tourism products number | Star-level tourism enterprises number | ||
|---|---|---|---|---|---|---|---|---|
| PTE | 0.458 | 0.522 | 0.542 | 0.855*** | 0.905* | 0.876*** | ||
| SE | 0.853* | 0.916** | 0.836*** | 0.692 | 0.587 | 0.491 | ||
| CE | PRD and YRD | 0.415 | 0.493 | 0.521 | 0.917* | 0.816* | 0.942** | |
| BTH and SDP | 0.527 | 0.618 | 0.721*** | 0.623 | 0.583 | 0.893** | ||
| CSL and WBST | 0.819*** | 0.922** | 0.932* | 0.482 | 0.502 | 0.489 | ||
Note: the value (***) is significant at the 10% level; the value (**) is significant at the 5% level; the value (*) is significant at the 1% level. |
Figure 6 Trend lines of different stages of urban tourism in six urban agglomerations and driving mechanisms |
The authors have declared that no competing interests exist.
| 1 |
|
| 2 |
|
| 3 |
|
| 4 |
|
| 5 |
|
| 6 |
|
| 7 |
|
| 8 |
|
| 9 |
|
| 10 |
|
| 11 |
|
| 12 |
|
| 13 |
|
| 14 |
|
| 15 |
|
| 16 |
|
| 17 |
|
| 18 |
|
| 19 |
|
| 20 |
|
| 21 |
|
| 22 |
|
| 23 |
|
| 24 |
|
| 25 |
|
| 26 |
|
| 27 |
|
| 28 |
|
| 29 |
|
| 30 |
|
| 31 |
|
/
| 〈 |
|
〉 |