Research Articles

Process and cause of urban-rural development transformation in the Bohai Rim Region, China

  • LIU Yansui , 1, 3 ,
  • HU Zhichao 1, 2 ,
  • LI Yuheng , 1, *
Expand
  • 1. Institute of Geographic Sciences and Natural Resources, CAS, Beijing 100101, China
  • 2. University of Chinese Academy of Sciences, Beijing 100049, China
  • 3. College of Resources Science and Technology, Beijing Normal University, Beijing 100875, China

*Corresponding author: Li Yuheng, PhD, E-mail:

Author: Liu Yansui, PhD and Professor, specialized in land use science and urban-rural development transformation. E-mail:

Received date: 2014-02-28

  Accepted date: 2014-08-20

  Online published: 2014-06-20

Supported by

National Natural Science Foundation of China, No.41130748.No.41471143

Copyright

Journal of Geographical Sciences, All Rights Reserved

Abstract

China’s reform and opening-up policy has brought the country a great development opportunity. The high-speed growth of the economy not only led China to a period of industrialization, urbanization, informatization and agricultural modernization, but also exacerbated the situation of the urban-rural dual structure. Based on the review of current studies, we first used the analytic hierarchy process (AHP) method to evaluate the urban-rural development and transformation level by population transformation index, land transformation index, industrial transformation index and social transformation index between 1996 and 2012 around the Bohai Rim Region. Then, based on the results of each index, we used the exploratory spatial data analysis (ESDA) method to investigate the spatial autocorrelation of the change in the urban-rural development transformation index during the 16-year period using Global Moran’s I index and Local Moran’s I index. Finally, we investigated the mechanism of change of the urban-rural development transformation index at county level, summarizing five main factors: (1) the radiation from the surrounding big cities, (2) the acceleration of the urbanization process, (3) the upgrading of the industrial structure, (4) the publishing and implementation of a macro development strategy and regional policy, and (5) natural factors such as topology.

Cite this article

LIU Yansui , HU Zhichao , LI Yuheng . Process and cause of urban-rural development transformation in the Bohai Rim Region, China[J]. Journal of Geographical Sciences, 2014 , 24(6) : 1147 -1160 . DOI: 10.1007/s11442-014-1144-9

1 Introduction

Following the implementation of reform and opening-up, for over 30 years China has experienced dramatic, high-speed economic growth. This economic miracle has been accompanied by rapid urbanization, which saw the urbanization level increase from 17.9% in 1978 to 52.6% in 2012 (Bai et al., 2014). If the current trend holds, China’s urban population could reach 1 billion, and China's migrant workers are estimated at top 350 million in the next two decades. In recognition of the profound impact of urbanization on social development, the Chinese government has paid attention to its urbanization development since the mid-1990s. The country entered a period of rapid urbanization in 1996, which was the beginning of the 9th Five-Year Plan Period; the increase in the urbanization rate was 1.44%. In the 10th Five-Year Plan Period in 2000, the government for the first time implemented an urbanization strategy. In the 11th and 12th Five-Year Plan Periods, the government continued to pay close attention to urbanization development. Socio-economic development in various fields also entered a critical period of transformation and development. In order to adjust the urbanization mode and control the speed of urbanization so as to ease the emerging social problems, the Chinese government promulgated the “National New Urbanization Plan (2014-2020)”, introducing for the first time a specialized plan for urbanization at national level.
As the third pillar of growth in China, together with the Yangtze River Delta and Pearl River Delta, the Bohai Rim Region also experienced rapid urbanization development. The 2012 data showed that the urbanization rate of the Bohai Rim Region was 57.6%, about five percentage points higher than the national level. In order to find ways to achieve the transformation and upgrading of the development model around the Bohai Rim Region, it was necessary to research the process of transferring of human factors, conversion of driving mechanisms, strategic transformation and relationship-changing progress in the study area. The research on urban and rural development transformation was specifically about the transferring of population, land, and industrial factors, conversion mechanisms and strategic transformation in the urban and rural regional system. Based on pattern recognition, mechanism testing and strategy investigation, we were able to discover the characteristics of social and economic development transformation, through which we could provide reference for the transformation and upgrading of the regional development model.
The current study is mainly focused on five issues: the rural-urban migration structure and process (Smith and Higley, 2012; Victor and Hope, 2011; Tacoli and Mabala, 2010), the evolution of the urban-rural spatial structure and urban-rural relationship (Henderson and Wang, 2005; Liu et al., 2011; Li, 2012), the industrial transformation and structural upgrading in urban and rural areas (Sullivan and Lovell, 2006; McGee, 2008), the innovation of the rural development model and urban-rural transformation (Esparcia, 2014), and urban-rural ecological and environmental evolution (Eaton et al., 2007; Beardsley et al., 2009; Gong et al., 2012; Liu et al., 2014). In contrast, Chinese scholars have paid more attention to the relationship and development change between urban and rural areas. For example, some researchers summarized the history and current state of China’s urban-rural relationship and predicted future trends (Zhao, 2009), resulting in an explanation of the meaning and influence of the urban-rural relationship on achieving rapid social and economic development (Xue and Huo, 2010; Long, 2009). Others have explored the different phases of evolution of the urban-rural relationship in different countries and regions (Liu et al., 2013).
The second section of this paper introduces the socio-economic characteristics of the Bohai Rim Region, research method and data sources. The third analyzes the research results and investigates the dynamic patterns of the index change during the research period. The fourth analyzes the mechanisms of the urban-rural development and transformation process, and the final section discusses the research results.

2 Study area, method and data

2.1 Study area

The Bohai Rim Region is located in Eastern China, and includes the Bohai coastal economic belt, Liaoning Peninsula and Shandong Peninsula. It accounts for about 22.2% of the total Chinese population and 13.3% of the total land area, covering the entire areas of Beijing, Tianjin, Hebei, Liaoning and Shandong. In 2012, the GDP of Bohai Rim was 13,207.6 billion yuan, accounting for nearly one quarter of the country’s GDP.
Relying on its unique location advantages, abundant resources and extensive opening-up pattern, the Bohai Rim Region formed an integral economic development pattern consisting of the Capital Economic Circle, the urban agglomeration of Shandong Peninsula, and the central and southern parts of Liaoning. The current development of the Bohai Rim Region has relied mainly on the heavy chemical industry and machinery manufacturing industry. Such a situation is not conducive to cultivating innovative and competitive high-level industry, and also slowed down the transformation and upgrading process from an export-oriented to an open and innovative economic model. The study of the urban-rural development transformation process in this typical region is important for promoting regional economic integration. It should also provide experiences and evidence for the coordination of regional development and new urbanization pattern according to “Sansheng Kongjian” (production, life and ecology space) organization instead of administrative divisions.

2.2 Methodology

(1) Analytic hierarchy process (AHP) method
As a decision-making method that integrates qualitative and quantitative approaches, AHP can model and quantify the decision-making process of a complex and sophisticated system (Saaty, 1990). In this study, the AHP method was used to analyze the county-level data in two periods. It then allowed construction of a county-level integrated urban-rural development transformation evaluation system, which included a population transformation index, a land transformation index, an industrial transformation index, and a social transformation index. The specific evaluation index system is shown in Table 1. In addition, according to the calculation results, the schematic diagrams and figures were depicted on the basis of the classification of each index using the natural breaks method in ArcGIS.
(2) Exploratory spatial data analysis method (ESDA)
ESDA is a series of methods and techniques for spatial data analysis. Its purpose is to reveal the spatial distribution of the research objects, discover the mode of spatial association, and find the differences between different spatial systems, and their instability (Anselin, 1999). With the help of ArcGIS, we used ESDA to research the spatial agglomeration and dispersion of the changes in the urban-rural transformation index (UDTI), the population transformation index (PTI), the land transformation index (LTI), the industrial transformation index (ITI) and the social transformation index (STI) during the period 1996-2012 around the Bohai Rim Region. In the first step, we used the Global Moran’s I index I and standard test value Z to investigate the overall region’s spatial autocorrelation (Goodchild, 1986). The computational formula is as follows:
Table 1 Urban-rural development transformation evaluation system
Target layer Criterion layer Calculation formula Weight Direction
Population Transformation Index
(PTI)
Urbanization Urban permanent resident population / regional total population 0.26 +
Proportion of labor force Population between age 15-64 / total regional population 0.25 +
Average education level (Total educated years of specific age groups / total population of these specific age groups) *100% 0.25 +
Degree of population aging Population above age 65 / total regional population 0.24 -
Land
Transformation Index
(LTI)
Proportion of construction land Construction land area / total regional area 0.42 +
Proportion of cultivated land Cultivated area / regional total area 0.39 -
Proportion of rural
construction land
Countryside homestead area / construction land area 0.19 -
Industrial Transformation Index
(ITI)
Structure of non-agricultural output Added values of secondary and tertiary industry/ Regional GDP 0.40 +
Structure of non- agricultural employment Employed population in secondary and tertiary industry / total employed population 0.36 +
Level of agricultural mechanization Total power of agricultural machinery / total cultivated area 0.24 +
Social
Transformation Index
(STI)
Regional GDP per capita Regional GDP / total regional population 0.24 +
Living consumption level Total retail sales of consumer goods / total regional population 0.18 +
Income level of rural residents (INCOR) Net income per capita of rural residents 0.16 +
Medical and health
condition of residents
Number of beds in health institutions per 10,000 persons 0.14 +
Social security conditions Number of beds in social welfare institutions per 10,000 persons 0.12 +
Income gap between urban and rural residents Average wages of employed population in urban institutions / net income per capita of rural residents 0.16 -
The value of Moran’s I index is between -1 and 1. Below 0 means a negative correlation, and the lower the index, the greater the spatial disparity; equal to 0 means no correlation; above 0 means a positive correlation, and the higher the index, the smaller the spatial disparity. The Global Moran’s I index can only reflect the average level of differences. In order to illustrate the local spatial correlation of UDTI, PTI, LTI, ITI and STI, we made further efforts, using the Local Moran’s I index to analyze the significance level of local indicators on spatial association, and drawing the Local Indicators of Spatial Association (LISA) cluster map based on the calculation results to investigate the spatial distribution rule of each index. The computational formula of the Local Moran’s I index is as follows:
In the formula:
The standard test value Z is the same as the global index:

2.3 Data

With regard to the county-level statistical data, the industrial and social data came mainly from the China County Statistical Yearbooks 1996 and 2012, China Statistical Yearbooks for Regional Economy, and the Statistical Yearbooks of Beijing, Tianjin, Hebei, Liaoning and Shandong, as well as those of some prefecture-level cities. The land-use data used in this study included detailed information acquired from the land-use remote-sensing interpretation data of the Bohai Rim Region and the National Land Use Change Survey. In view of the difficulties in obtaining land-use and population data, the article selected the data from the fifth and sixth national censuses to replace population data for 1996 and 2012, using land-interpretation data for 2008 to replace data for 2012, and using data on number of beds in social welfare institutions and the ratio of revenue between citizens and farmers for 2000 instead of 1996.

3 Results and analysis

Based on the collected data, we first used the AHP method to evaluate UDTI, PTI, LTI, STI and ITI in 1996 and 2012, and the changes in the indexes during the 16 years around the Bohai Rim Region. On the basis of the calculation from the AHP method, we then used the ESDA method to calculate the global Moran’s I index and Local Moran’s I index to investigate each indexes’ spatial agglomerate rules and characteristics, and to draw LISA cluster maps for each index to study the significance level of spatial agglomeration between one regional unit and the other.

3.1 Results of the AHP method

Based on the urban-rural development transformation evaluation system that had previously been constructed, we calculated the PTI, LTI, ITI and STI for 1996 and 2012, and the change in the indexes during the 16-year period.
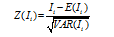
3.1.1 The spatial-temporal pattern of PTI
PTI shows the urbanization trend, the proportion of the labor force, the average level of education, and the level of aging in urban and rural regions. As shown in Table 2, the average PTI around the Bohai Rim Region increased by 0.11, with the PTI for Beijing increasing the fastest, from 0.48 to 0.70, and the PTI for Liaoning increasing the slowest, from 0.34 to 0.47. Using the natural break classification method in ArcGIS we divided the PTI results into five ranges: low value, relatively low value, medium value, relatively high value, and high value. In 1996 the counties were mainly in the relatively low value and low value ranges, which accounted for 36.0% and 27.4% of the total number of counties respectively. The numbers of counties in the relatively high value and high value ranges were comparatively low, at 31 (9.5%) and 26 (7.9%) respectively. In 2012 the classification results had changed greatly. Although the relatively low value range still contained the most counties, the number had dropped from 118 to 107, with the percentage points decreasing from 36.0% to 32.6%. The range with the second highest number changed from the low value to the medium value: the number of counties in the medium value range increased from 68 to 95, while the number in the low value range fell from 90 to 46. The high value and low value ranges became the two smallest ranges, accounting for 9.8% and 14% of the counties respectively.
In order to investigate the extent of PTI change, we used ArcGIS to plot the results on a map. The calculation showed that from 1996 to 2012, the fastest population evolution areas were located mainly in the municipalities of Beijing, Tianjin, and in some of the counties in Langfang, Shijiazhuang, Handan and Chaoyang cities; the areas evolving relatively rapidly included counties in Beijing and Tianjin, southern and central-eastern parts of Hebei, eastern and southern parts of Shandong such as Qingdao, Yantai, and the central part of Liaoning. The medium range areas were located mainly in the southeastern and northern parts of Hebei, western and central parts of Liaoning, and southern and central parts of Shandong such as Linqu. The relatively slow areas included the northwestern part of Hebei, the eastern part of Shandong, and most cities in Liaoning. The slow range areas were located mainly in the northwestern part of Liaoning (Figure 1).
Figure 1 PTI change from 1996 to 2012
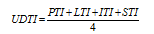
3.1.2 The spatial-temporal pattern of LTI
LTI, which reflects the overall trends of the proportion of urban and rural construction land, the proportion of arable land, and the proportion of countryside homestead, can be used to evaluate the land-use structure and land occupancy that includes housing constructions for urban and rural residents.
According to our calculations, the average LTI increased from 0.32 to 0.34 between 1996 and 2012. Tianjin experienced the fastest increase, from 0.37 to 0.47; Liaoning increased relatively slowly, from 0.41 to 0.43; Hebei increased the slowest, from 0.30 to 0.31, a rise of only one percentage point during the 16-year period.
The LTI result was also divided into five ranges (low value, relatively low value, medium value, relatively high value, and high value). In 1996, the relatively low value range contained the most counties, at 29.9%; the range with the second highest number was the medium value range, containing 82 counties, at 25.1%; the high value and relatively high value ranges were the two smallest classifications, accounting for only 7.3% and 17.1% of all the counties respectively. By 2012 the number of counties in the medium value range had increased rapidly, from 82 to 108. The range with the second highest number was the relatively low value range, which had decreased by 2.5 percentage points during the 16 years.
The low value and relatively high value ranges also experienced a rapid decrease. Taking the relatively high value range as an example, during the 16-year period the number of counties in this range decreased from 56 to 46. The high value range still contained the fewest counties, increasing by only one county.
We used ArcGIS to plot the LTI change results on a map. The municipalities of Beijing and Tianjin and the cities of Jinan, Zibo and Qingdao experienced rapid increases during the 16-year period. The relatively fast evolution areas were located mainly in counties of Beijing and Tianjin, eastern parts of Hebei such as Tangshan, central and northern parts of Shandong such as Binzhou, and central and southern parts of Liaoning such as Dalian. The medium and relatively slow evolution areas covered most parts of the three provinces. The slow evolution areas were located mainly in the southern part of Hebei and the northern part of Liaoning (Figure 2). ITI is an integrated measurement of the level of regional non-agricultural industrial development and agricultural mechanization.
Figure 2 LTI change from 1996 to 2012
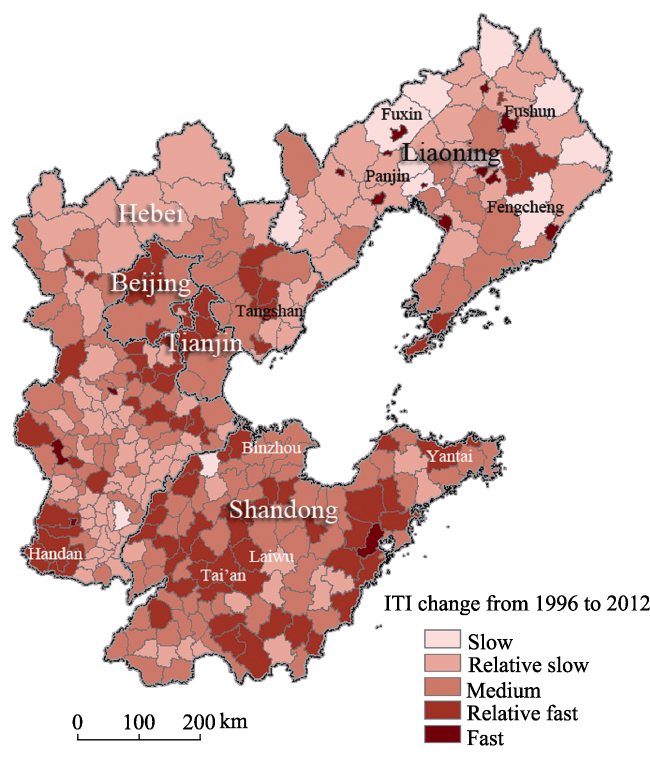
3.1.3 The spatial-temporal pattern of ITI
The average ITI increased rapidly, from 0.10 to 0.48 during the 16-year period. In the five provincial administrative units, Shandong increased the fastest, from 0.09 to 0.49, and Hebei increased relatively fast, from 0.09 to 0.45.
Based on the classification of ITI, we realized that a great change had taken place during the 16-year period. In 1996, the low value range contained the most counties of all, 103, including the southern part of Hebei and the western part of Shandong. The relatively low value contained the second highest number of counties, 97, accounting for 29.6% of the total. The relatively high value range contained the fewest, with 8.5%. In 2012, the number of counties in the low value and relatively low value ranges had decreased, especially the low value range, where the number decreased from 103 to 48, while the counties in the medium value, relatively high value and high value ranges increased, especially the relatively high value range, where the number rose from 28 to 75.
Figure 3 ITI change from 1996 to 2012
The results on the map (Figure 3) show that the areas of rapid evolution were located mainly in administered districts of Liaoning such as Fushun and Panjin cities. The relatively fast areas were in the counties of Beijing and Tianjin, eastern and southern parts of Hebei such as Tangshan and Handan cities, and central and eastern parts of Shandong such as Tai’an, Laiwu and Yantai cities. The medium and relatively slow evolution areas covered most of the three provinces and some of the districts in Beijing and Tianjin municipalities. The slow evolution areas were located mainly in Liaoning, such as Fuxin and Fengcheng cities.
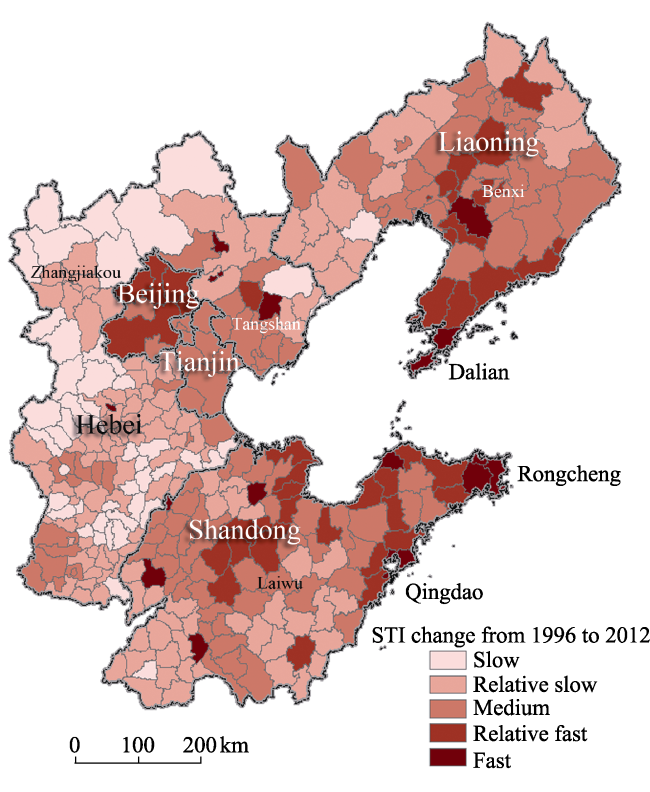
3.1.4 The spatial-temporal pattern of STI
The STI shows the regional socio-economic development, the income of urban and rural residents, the public service and social security conditions, as well as the maturity and quality of local residents’ social environment and the gap in the living standards between urban residents and rural residents.
According to the evaluation, the average STI in the Bohai Rim Region had risen from 0.14 to 0.24 during the 16-year period. Shandong increased the fastest among the STIs for the five provincial administrative units, from 0.14 to 0.27. Beijing and Liaoning increased relatively fast, increasing by 15 and 12 percentage points respectively. The STI of Tianjin increased relatively slowly, from 0.18 to 0.29. Hebei’s STI increased the slowest, from 0.13 to 0.20.
With regard to the classification of STI, in 1996 the medium value range contained the most counties of all, 130, accounting for 39.6%; the relatively high value range contained fewer, 96, followed by the relatively low value range, 64 counties, the low value range, 23 counties, and the high value range, which contained the fewest counties, 20, accounting for only 6.1% of the total. In 2012, the relatively low value range became the classification with the most counties, 117, accounting for 35.7% of the total; the range with the second highest number was the medium value range, containing 94 counties; the relatively high value range decreased the fastest, from 96 to 59 counties; the low value range experienced an increase, from 23 to 42 counties, with the percentage rising from 7.0% to 12.8%; the high value range still contained the fewest counties, at only 21.
The map shows that Beijing and the cities in the eastern part of Shandong province such as Qingdao, together with the southern part of Liaoning province, namely Dalian and Rongcheng experienced a rapid increase in social evolution. The eastern part of Hebei, the northern part of Shandong and the central part of Liaoning increased relatively quickly. The areas of slowest evolution were located mainly in the northern and western parts of Hebei, such as Zhangjiakou City (Figure 4).
Figure 4 STI change from 1996 to 2012
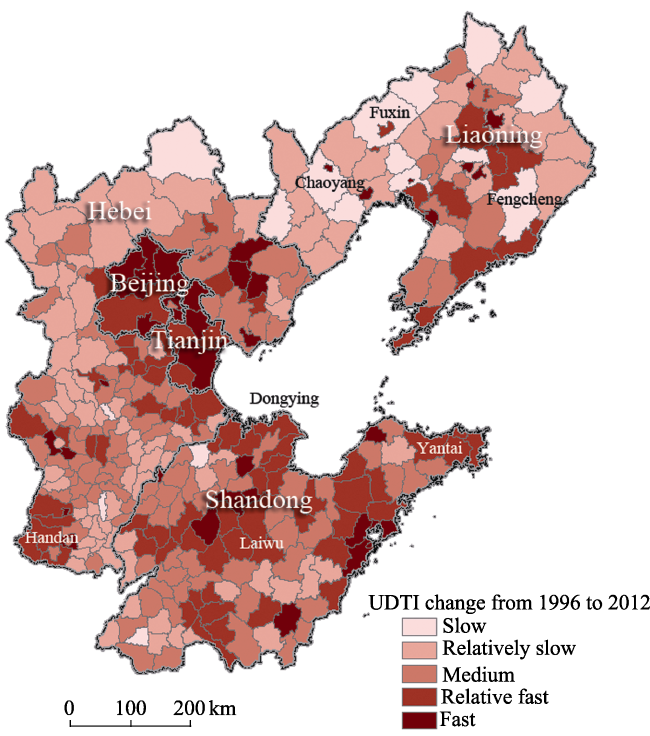
3.1.5 The spatial-temporal pattern of UDTI
UDTI makes an assessment of the overall pattern of urban-rural development transformation in the Bohai Rim Region. It can be calculated using the following formula:
The average UDTI of the Bohai Rim Region increased from 0.23 to 0.38 during the 16-year period. Among the five provincial administrative units, the UDTI of Tianjin increased the fastest, from 0.27 to 0.47; the index increased relatively fast in Shandong and Hebei, rising by 16 and 15 percentage points respectively; Liaoning’s UDTI increased the slowest, from 0.29 to 0.42.
We also classified the calculation results into five ranges. In 1996, the highest number of counties was in the relatively low value range, with 114 counties, accounting for 54.7%; the range with the second highest number was the low value range, followed by the medium range and relatively high value range; the high value range contained the fewest counties, 16 counties, accounting for only 4.9% of the total. In 2012 the number of counties in the medium value and high value ranges increased, while the others decreased. The high value range increased the fastest, from 16 to 32 counties; the relatively low value range decreased the fastest, from 114 to 100 counties.
The results of the classification of the change in UDTI during the 16-year period showed that the areas of fastest evolution were in Beijing, Tianjin, and big cities from the three provinces. The relatively fast evolution areas were mainly in districts of Beijing, Tianjin, the southern part of Hebei, such as Handan City, and central and eastern parts of Shandong, such as Laiwu City, Dongying City and Yantai City. The medium and relatively slow areas of evolution were in most parts of Hebei and Liaoning, and western and southern parts of Shandong. The slowest evolution areas were located mainly in Liaoning, such as Fuxin City and Chaoyang City (Figure 5).
Figure 5 UDTI change from 1996 to 2012

3.2 Results of the ESDA method

The evaluation of the UDTI, PTI, LTI, ITI and STI using the AHP method around the Bohai Rim Region in 1996 and 2012 enabled us to ascertain the urban and rural development and transformation process around the region. In this section, we use the ESDA method to detect the spatial distribution of index change during the 16-year period.
3.2.1 Global Moran’s I index for each index
We found that all of the indexes except the ITI presented positive spatial autocorrelation under the 0.05 significance level test. The STI change presented the highest Moran’s I index, 0.33, which meant that social transformation had the most significant spatial autocorrelation level; the ITI change had the lowest Moran’s I index, with the Z value test below 1.96, showing no significant spatial autocorrelation characteristics. The Global Moran’s I index of UDTI change was 0.13, which is relatively low compared with other indexes, implying a weak positive correlation in spatial terms (Table 2).
Table 2 Global Moran’s I index of the five indexes around Bohai Rim
Index UDTI change PTI change LTI change ITI change STI change
Global Moran’s I 0.13 0.31 0.27 0.04 0.33
Z value 5.20 12.27 10.88 1.59 13.10
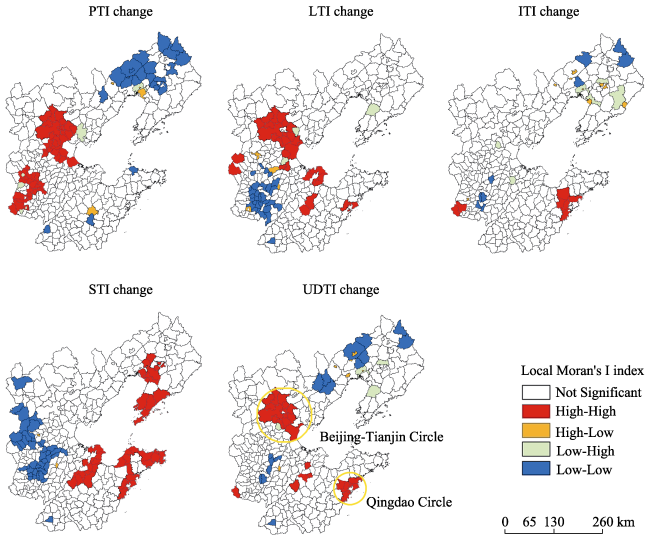
3.2.2 Local Moran’s I index for each index
The Global Moran’s I index reflected the integral spatial distribution of each index. We used the Local Moran’s I index to detect specific clustered districts of high values and low values at the local level, in order to identify the location of spatial heterogeneity.
Figure 6 shows the calculation results for the Local Moran’s I index of PTI, LTI, ITI, STI and UDTI change under the 0.05 significance level test. The PTI change reflected the fact that the spatial distributions of most indexes were in the High-High (H-H) and Low-Low (L-L) clusters. The H-H clusters were concentrated mainly in Beijing, Tianjin, and the southern part of Hebei, such as Shijiazhuang City; the L-L clusters were concentrated in the northern part of Liaoning, such as Fushun City. The LTI change reflected the fact that the H-H clusters were concentrated mainly in Beijing, Tianjin, and the districts of Dongying and Qingdao cities in Shandong, while the L-L clusters were concentrated mainly in Handan, Xingtai and Hengshui cities in the southern part of Hebei. The spatial distribution of ITI change was not significant around the Bohai Rim. However, the relatively high value cluster was in Qingdao City. The H-H clusters for STI change were located mostly in Shandong, such as Dongying, Zibo, Qingdao and Yantai cities, and the southern part of Liaoning, such as Dalian and Anshan cities. The L-L clusters were located in southern and western parts of Hebei.
Figure 6 The calculation of Local Moran's I index for UDTI and four indexes
The spatial distribution of UDTI change had features in common with other indexes. Beijing, Tianjin municipality and Qingdao City remained in H-H clusters, which meant that they had experienced a rapid urban and rural development and transformation process during the 16-year period. The L-L clusters were mainly in areas such as Fuxin and Chaoyang cities in Liaoning, and Hengshui City in Hebei, representing a low speed of evolution for urban and rural development and transformation. Using the index maps we identified two zones that consistently showed a high speed of development and transformation, namely the Beijing-Tianjin circle and the Qingdao circle. The reason for the formation of these two circles will be discussed in the following section.

4 Cause for UDTI change

On the basis of our calculations and analyses, in this section we investigate the cause for the UDTI change at county level.
(1) The influence of radiation from the surrounding big cities
The results from the AHP and ESDA methods indicate that some districts and counties around Beijing and Tianjin, and in Hebei, such as Qian’an, Zunhua and Caofeidian, grew relatively quickly during the 16-year period showing H-H clusters in UDTI, PTI and LTI change. The main factor was the increasing significance of the influence of radiation from Beijing and Tianjin to the surrounding areas, which benefited the Beijing-Tianjin-Hebei Region in the rapid development of regional urban-rural development transformation. For example, in 2005 the government decided to relocate the Shougang Group from Beijing to Caofeidian, and in the same year started to increase the scale of investment: nearly one trillion yuan was put into this area, speeding up the process of upgrading the heavy chemical production and industrial structure in Caofeidian. This led to the increase of ITI and UDTI between 1996 and 2012. This could be one of the main reasons for the formation of the Beijing-Tianjin circle.
(2) The acceleration of the urbanization process
The change in PTI represents the urbanization level of each county. The areas around Beijing, Tianjin and the southern part of Hebei experienced rapid increase in both PTI and level of urbanization. With the acceleration of the urbanization process, new village-town construction, social and industrial systems in these areas also developed quickly. During the 16-year period, Beijing and Tianjin experienced substantial industrial restructuring and land-use change, representing a rapid growth of the overall UDTI. Furthermore, the construction of new large-scale development zones has exacerbated the process of land-use change and industrial structure upgrading, which has resulted in rapid increases in the LTI and UDTI. On the whole, the acceleration of the urbanization process has not only enhanced the speed of population transformation, but also led to a faster overall development and transformation of society and economy, increasing the speed of land, industrial and social transformation.
(3) The increase in the level of industrialization and upgrading of the industrial structure
The speeds of change of UDTI and ITI in districts and counties of Qingdao were the highest among the counties in Shandong, also, Qingdao was in the H-H cluster for STI change. The main cause of such high-speed evolution was the development and upgrading of the industrial system. For example, Qingdao’s industrial development strongly boosted the evolution of the local economy and society. Between 1996 and 2012 the electronics, transportation, food-processing and mechanism-producing industries developed greatly, bringing forth a large number of brand names such as Haier, Hisense and AUCMA. This caused rapid evolution not only of industry but also of the overall economy and society. The rapid development and upgrading might be the main reason for the appearance of the Qingdao circle.
The areas with the fastest increase of UDTI in Liaoning were in districts of big cities such as Fushun and Yingkou. For example, the high speed of change of UDTI in Yingkou was closely related to the building and development of Yingkou port. Over a period of 150 years, the port was developed by the textile industry as the dominant industrial system. On the basis of the economic development and industrial transition of Yingkou port, the DTI and UDTI of Yingkou increased rapidly.
In contrast to the situation in Yingkou City, the development and transformation processes of Fushun City and Panjin City were more related to their transition as resource-based cities. For example, Fushun City was rich in metals, non-metals and coal. However, because of the rapid decrease of such resources in recent years, a large number of mines have gradually been closed. Environmental problems caused by the excavating industry became more and more serious, which has led to the urgent need for the transformation of the urban-rural development mode.
(4) The publication and implementation of macro strategy and regional policy
From the PTI and UDTI change of Shijiazhuang and its administered districts, Luquan and Luancheng, we found that the development strategy and regional policy published by local governments also affects the process of urban-rural development and transformation. For example, following the publication of the “reducing the second and increasing the third” policy in recent years, the pace of industrial upgrading in Shijiazhuang has accelerated and the proportion of tertiary industry has continued to increase year by year, and this has led to the rapid growth of the local economy and social benefits.
Taking Luquan as an example, in recent years the development in the local leisure-service industry, light industry, food industry, and electronic information industry has led to the rapid growth of the social economy. Another policy that greatly affected the development of Shijiazhuang was “renovating the village in city”, through which the infrastructure within the city improved, the percentage of construction land increased, and the urban population capacity grew. As a result, the UDTI increased rapidly during the 16-year period. The main reason for the dramatic increases in other areas was the multiple effects of the urbanization process, dominant industry development and change in the land-use structure.
(5) Natural factors
The spatial pattern of the Beijing-Tianjin circle indicates that the northern and western boundary of the circle was basically aligned with the mountain-plain border zone, with the areas on the plain showing a faster evolution than those in the mountains. This is also the case in the western part of Liaoning and southern part of Shandong. Such a phenomenon reflects the effects of topography on the change in UDTI. The effects of other natural factors on the index change could be the subject of future research.

5 Conclusions

(1) In the period 1996-2012, the fastest areas of urban-rural development and transformation in the Bohai Rim Region were in Beijing and Tianjin, southern parts of Hebei, such as Handan, northern and eastern parts of Shandong, such as Qingdao, and the southern part of Liaoning. Among those areas, the transformation of the southern part of Hebei relied mainly on the population evolution process; the transformation of the northern part of Shandong and the southern part of Liaoning relied mainly on social evolution; in the eastern part of Shandong, the transformation was based on industrial evolution; Beijing and Tianjin derived their transformation from multiple factors, including the processes of land evolution, social evolution and population evolution.
(2) The change in the UDTI around the Bohai Rim Region during the 16-year period reflected positive spatial autocorrelation, as did the PTI, LTI and STI. The H-H clusters of UDTI were located mainly in Beijing, Tianjin municipality, and Qingdao, Jinan city; the L-L clusters of UDTI were located mainly in the northwestern part of Liaoning.
(3) The cause for UDTI change in the Bohai Rim Region can be summarized as five main factors. The rapid urbanization accelerated the process of rural-urban migration, improving the social welfare system, which enhanced the PTI, DTI and UDTI. The increase in the level of industrialization led to the transformation and upgrading of the industrial structure, enhancing the ITI and UDTI. The publication of new government policy resulted in changes in the industrial structure, migration from rural to urban areas and changes in land-use structure. Natural factors such as topography could also affect the UDTI process.

The authors have declared that no competing interests exist.

1
Anselin L, 1999. Interactive techniques and exploratory spatial data analysis. In: Longley P, Goodchild M, Maguire D et al. Geographical Information Systems: Principles, Techniques, Management and Applications. New York: Wiley, 251-264.

2
Bai X M, Shi P J, Liu Y S, 2014. Realizing China’s urban dream.Nature, 509(1799): 158-160.

3
Beardsley K, Thorne J H, Roth N Eet al., 2009. Assessing the influence of rapid urban growth and regional policies on biological resources.Landscape and Urban Planning, 93(3): 172-183.

4
Eaton R L, Hammond G P, Laurie J, 2007. Footprints on the landscape: An environmental appraisal of urban and rural living in the developed world.Landscape and Urban Planning, 83(1): 13-28.

5
Esparcia J, 2014. Innovation and networks in rural areas. An analysis from European innovative projects.Journal of Rural Studies, 34: 1-14.

6
Gong J Z, Liu Y S, Chen W L, 2012. Optimal land use allocation of urban fringe in Guangzhou.Journal of Geographical Sciences, 22(1): 179-191.

7
Goodchild M F, 1986. Spatial autocorrelation concepts and techniques in modern geography. Norwich, UK: Geo books: 3-6.

8
Henderson J V, Wang H G, 2005. Aspects of the rural-urban transformation of countries.Journal of Economic Geography, 5(1): 23-42.

9
Li Y H, 2012. Urban-rural interaction patterns and dynamic land use: Implications for urban-rural integration in China.Regional Environmental Change, 12: 803-812.

10
Liu Y S, Chen Y F, Long H L, 2011. Regional diversity of peasant household response to new countryside construction based on field survey in eastern coastal China.Journal of Geographical Sciences, 21(5): 869-881.

11
Liu Y S, Fang F, Li Y H, 2014. Key issues of land use in China and implications for policy making.Land Use Policy, 40: 6-12.

12
Liu Y S, Lu S S, Chen Y F, 2013. Spatio-temporal change of urban-rural equalized development patterns in China and its driving factors.Journal of Rural Studies, 32: 320-330.

13
Long H L, 2009. Differentiation of rural development driven by industrialization and urbanization in eastern coastal China.Habitat International, 33(4): 454-462.

14
McGee T G, 2008. Managing the rural-urban transformation in East Asia in the 21st century.Sustainability Science, 3(1): 155-167.

15
Saaty T L, 1990. How to make a decision: The analytic hierarchy process.European Journal of Operational Research, 48(1): 9-26.

16
Smith D P, Higley R, 2012. Circuits of education, rural gentrification, and family migration from the global city.Journal of Rural Studies, 28(1): 49-55.

17
Sullivan W C, Lovell S T, 2006. Improving the visual quality of commercial development at the rural-urban fringe.Landscape and Urban Planning, 77(1): 152-166.

18
Tacoli C, Mabala R, 2010. Exploring mobility and migration in the context of rural-urban linkages: Why gender and generation matter.Environment and Urbanization, 22(2): 389-395.

19
Victor O U, Hope E N, 2011. Rural-urban ‘Symbiosis’ community self-help, and the new planning mandate: Evidence from Southeast Nigeria.Habitat International, 35(2): 350-360.

20
Xue Q, Huo Y G, 2010. The origin and evolution path survey of the urban and rural integration.Economic Geography, 30(11): 1779-1809. (in Chinese)

21
Zhao Q Y, 2009. Strategic transformation of urban-rural relation in China and a discussion on urban-rural integration planning.Urban Planning Forum, (6): 47-52. (in Chinese)

Outlines

/