Research Articles

The sustainable development of innovative cities in China: Comprehensive assessment and future configuration

  • FANG Chuanglin ,
  • MA Haitao , * ,
  • WANG Zhenbo ,
  • LI Guangdong
Expand
  • Institute of Geographic Sciences and Natural Resources Research, CAS, Beijing 100101, China

*Corresponding author: Ma Haitao (1979-), PhD and Assistant Professor, specialized in urban geography and innovation. E-mail:

Author: Fang Chuanglin (1966-), Professor, specialized in land use and resources & urban geography. E-mail:

Received date: 2013-10-05

  Accepted date: 2014-06-06

  Online published: 2014-06-20

Supported by

Major project of the National Social Science Foundation of China, No.13&ZD027.National Natural Science Foundation of China, No.41371177, 41201128

Copyright

Journal of Geographical Sciences, All Rights Reserved

Abstract

Innovative cities not only constitute an important basis for innovation activities, but also play a strategically critical role in constructing an innovative country, producing new forms of urban development, and fostering urban sustainable development. Currently, China is marching toward the goal of establishing an innovative country by 2020, but in the start-up phase of this process of innovative city construction, the fundamental transition from factor-driven development to innovation-driven development is not being realized. As a result, a wide gap currently exists between China’s innovative cities and the advanced innovative cities in developed countries. This paper argues that this necessary transition is being constrained by a series of bottlenecks in investment, income, techniques, contributions, and talents. The article takes 287 prefecture-level cities as its object of comprehensive assessment, developing a comprehensive assessment system for innovative cities and devising innovative monitoring system software in order to evaluate the current situation in China’s innovative city construction. The analysis addresses four key aspects - namely, independent innovation, industrial innovation, living environmental innovation, and institutional innovation - as well as the spatial heterogeneity of the innovative city construction process. The results demonstrate that the level of innovation in Chinese cities is low, and the paper warns that building an innovation-oriented country will, as a consequence, be difficult. Some 87.8% of the cities studied maintained comprehensive levels of innovation that were lower than the national average. The level of comprehensive innovation in a city was found to have close and positive correlation with economic development. The level of the eastern region of China was, in particular, found to be significantly higher than that of the central and western regions. The levels of urban independent innovation, industrial innovation, environmental innovation, and institutional innovation showed consistent spatial heterogeneity, as did the comprehensive level of innovation in cities. In the future, the authors suggest, China should speed up the construction process in accordance with the basic principles of “independent innovation, breakthroughs in key fields, market-oriented, regional interaction, talent-supported,” with the purpose of building up Beijing, Shenzhen, Shanghai, and Guangzhou as global innovation centers; and Nanjing, Suzhou, Xiamen, Hangzhou, Wuxi, Xi’an, Wuhan, Shenyang, Dalian, Tianjin, Changsha, Qingdao, Chengdu, Changchun, Hefei, and Chongqing as national innovation centers, by 2020. Through this process, China will finally build a national urban innovation network that includes 4 global innovative cities, 16 national innovative cities, 30 regional innovative cities, 55 local innovative cities, and 182 innovation-driven development cities, thereby contributing to the establishment of an innovative country by 2020.

Cite this article

FANG Chuanglin , MA Haitao , WANG Zhenbo , LI Guangdong . The sustainable development of innovative cities in China: Comprehensive assessment and future configuration[J]. Journal of Geographical Sciences, 2014 , 24(6) : 1095 -1114 . DOI: 10.1007/s11442-014-1141-z

1 Introduction

Innovation is certainly a popular keyword today in fields like planning and economic geography, where it is deployed as driver of both policies and interventions in urban space (Vanolo, 2013). “The innovative city” envisages a city driven by science and technology, dominated by independent innovation, and based on innovation culture, which relies on innovation elements such as technology, knowledge, human intelligence, culture, and systems to develop (Hall, 1998; Marceau, 2008). Innovative cities contain six primary elements: city innovative resources (Isaksen and Aslesen, 2001), innovation platforms (Leslie and Rantisi, 2011), innovation spaces (Iskander, 2010; Campbell, 2006), innovation environments (Fitjar and Rodriguez-Pose, 2011; Ache, 2000), innovation services (Johnston, 2011), and innovation channels (Lin, 2014; Wei, 2011). The construction of an innovative city can be conceptualized in four stages, necessitating a transition from the resource-based city to the capital-based city, to the innovation-based city, and ultimately to the intelligence-based city (Fang, 2013) (Figure 1). The key link in the process of pressing ahead with the building of a national innovation system (Chen and Karwan, 2008), the innovative city forms an important base upon which national innovative activity might be undertaken and an innovative country constructed (Johnson, 2008). The core engine of speeding up the economic transformation (Lee and Drever, 2013), innovative cities advance both urbanization and rural development processes at a national level. Innovative city research is urgently needed in order to explore new modes of urban development and to propel urban sustainable development (Liu et al., 2014; Evans and Jones, 2008).
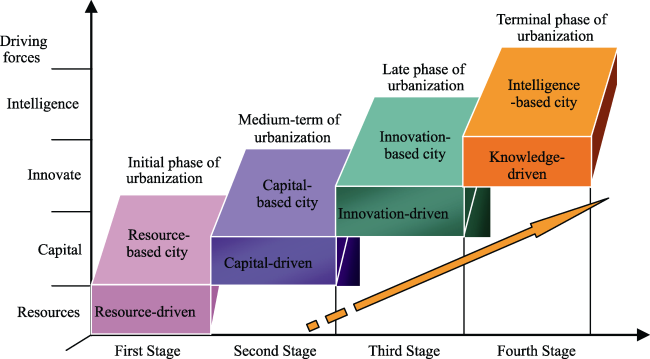
Figure 1 The strategic phases of the development of the innovative city
The development of innovative cities has particular strategic importance in relation to China’s economic and social development (Dente and Coletti, 2011). In fact, the construction of “the innovative city” has been proposed both through a series of administrative documents produced by the Ministry of Science and Technology of China. Further, the latest revised Party Constitution of the Communist Party of China (CPC) and the Report to the Eighteenth National Congress of CPC both put forward the strategy of constructing “the innovative country,” thereby implementing innovation-driven development at a national scale (Hu, 2012). Given that China has now entered a crucial stage in its goal to complete the building of an innovation-oriented country by 2020, it is critically important that the basic connotations and standards behind the innovative city model are judged scientifically (Cohendet, 2010). Further, the status quo and existing problems affecting China’s project to construct the “innovative city” must also be rationally evaluated, both with reference to international experiences and through the use of scientific methods. Moreover, the spatial distribution properties and patterns of the innovative city also require further analysis. We advocate that the performance of these tasks of evaluation and analysis has the realistic potential to speed up the construction of an innovative China, thereby strengthening China’s independent innovation ability and its international competitiveness.

2 Literature Review

2.1 Definition and construction conditions of innovative cities

The American economist Joseph Alois Schumpeter first put forward the term “economic innovation” in his book The Theory of Economic Development in 1934. The well-known British economist C. Freeman subsequently advanced the concept of a “national innovation system” in the 1970s, advocating that innovation could improve human productivity. Addressing the spatial implications of these concepts, Peter Hall later defined “the innovative city” as a city that has a new social form, which results from the integration of many new things, the experience of social and economic change, and the presence of innovation (Hall, 1998). Charles Landry, the founder of COMEDIA (an authoritative institution in innovative city research in Britain), provides an alternate list of factors, nominating seven elements which make up an innovative city, including: innovative people, will and leadership, diversity of people, wisdom-obtained, an open organizational culture, a strong positive sense of local identity, urban space and infrastructure, and internet access (Landry, 2000).
The core concepts mentioned above have been illustrated and deepened through a number of case study analyses of successful innovative cities. For instance, whilst analyzing the “spirit of innovation” that pervaded the development of Silicon Valley, Professor Henry Rowen from Stanford University points out that innovative city construction must overcome the worship of GDP - rather, according to Rowen, such strategies must regard the value of a World Top 500 enterprise as being equal to that produced by a returned student who starts his/her business in their mother land (Qian, 2011). Further, as the book Innovative Cities (an empirical study of Stuttgart, Milan, Amsterdam, Paris, and London conducted by James Simmie of Oxford University and supported by the European Economic and Social Committee) demonstrates, city innovation can be seen to result from internal scale effects, a localized economy, innovation and urbanization economics, and globalization effects (Simmie, 2011). In a similar vein, the Report on Southeast Asian Innovative Cities published by the World Bank also considers the antecedent conditions of innovative cities through a study of seven cities (Ren et al., 2009).

2.2 Evaluation indexes and methods for the study of innovative cities

At present, a number of representative evaluation indexes exist in relation to the study of innovative cities. These include: (1) the European Innovation Scoreboard (IUS), which was proposed by the European Committee in 2000 and consists of three first-level indicators (input, corporate activity, and output), eight second-level indicators (human resources, the research system, capital and support, corporate investment, contact and entrepreneurship, intelligence assets, innovators, and economic effects), and 24 third-level indicators (European Commission, 2011); (2) the National Innovative Capacity Index proposed by Porter and Stern in 2000, which contains four first-level indicators (the ratio of scientists and engineers, innovation policy, the innovation environment of industry agglomerations, and communication quality), and nine second-level indicators (Porter and Stern, 2000); (3) the Creative Index (or, the “3T” creative index) put forward by American scholar Richard Florida in 2006, covering talent, technology, and tolerance (Florida, 2002); (4) the Innovation Capacity Index proposed by Augusto López-Claros in 2010, which includes five first-level indicators (the institutional environment, human capital training and social inclusion, supervision and legal framework, research and development, and information and telecommunication acquisition and use), 12 second-level indicators and 52 third-level indicators (López-Claros, 2011); (5) the Global Innovation Index developed by Boston Consulting Group and American National Manufacture Association in 2011, which includes five input indicators (system, human capital, infrastructure, maturity of market, and maturity of commerce) and two output indicators (science output and innovation output) (Dutta and Benavente, 2011); (6) the Global Innovation City Evaluation Index constructed by Australian innovation study institution 2thinknow in 2011, which covers four aspects (cultural assets, human capital, market network, and patent grant) through 162 indicators (2thinknow, 2011). Meanwhile, the Robert Hakins Association, a well-known British think tank, generated the city competitiveness assessment model - or, the World Knowledge Competitiveness Index (WKCI) model - which focuses on the knowledge economy, relying on the human capital theory and an endogenous model of economic growth (Cetindamar and Gunsel, 2012).
Beyond these international examples, the representative evaluation indexes developed within the Chinese context include: the Innovative City Construction Monitoring Evaluation Index System, developed by the Ministry of Science and Technology (CSTDSRG, 2011); the China Regional Innovation Capacity Evaluation Index, developed by the Innovation Development Research Center of the Chinese Academy of Sciences (2009); the National Innovation Evaluation Index from Renmin University (Ji and Zhao, 2008); the China Innovative City Evaluation Index from the Innovative City Evaluation Research Group (2009); the innovative city evaluation index from the research group behind the Innovative Country Construction Report (NISSRG, 2011); the innovative city evaluation index from the Strategic Research Group for the National Innovation System Construction (Zhan and Xiong, 2010); the Zhongguancun innovation index (NISSRG, 2008); the Shenzhen innovation index (Zhou, 2007); and the Zhangjiang innovation index (Chen, 2007).
Pursuant to an analysis of these international and Chinese indexes, China’s “innovative city construction criteria” can be identified as constituting the following ten items: (1) that the GDP per capita exceeds US $10,000; (2) that the ratio of R&D investment to GDP is more than 5%; (3) that the ratio of R&D investment to total sale revenue is more than 5%; (4) that the ratio of public education expenditure to GDP is more than 5%; (5) that the ratio of new product sales to total sales is over 60%; (6) that the contribution of scientific development to economic growth is more than 60%; (7) that high-tech industry added-value to the industrial added-value is over 60%; (8) that domestic dependency on technology is more than 70%; (9) that the proportion of invention patent applications to the total patent applications is over 70%; and (10) that the proportion of corporate patent applications to total social patent applications is over 70%. This study argues that cities that fulfill these criteria can be regarded as “innovative cities.” Such cities are also an important symbol of urban sustainable development (Liu et al., 2014; Evans and Jones, 2008).

2.3 General appraisal of existing research

A number of comparative studies (Athey et al., 2008) and case analyses of widely recognized global innovative cities have found that innovative cities around the globe tend to be densely distributed in developed areas which possess convenient traffic conditions, close economic contacts with the external world, and extensive global markets. Further, the literature also indicates that those innovative cities which feature developed science and technology service agents and capacity are able to gather a high amount of diversified high-level creative talent. As a result, such cities are subsequently able to attract research institutions and organizations of excellence, and establish world-famous innovative platforms and spatial carriers with cultures typical of openness and inclusiveness. During the process of constructing such global innovative cities, urban governments play an irreplaceable facilitation role, by setting up special leading institutions (Hospers, 2008), developing multi-level innovation coordination, drawing up complete innovation promotion policy, making use of national-level laws and regulations, and supporting civil innovation organization development (Ma et al., 2013).
An analysis of typical innovative city evaluation indexes from both domestic and international contexts reveals that international-level innovative city evaluation indexes tend to be based on the national level and display obvious political tendencies. At the same time, the content of such indexes are based on creative capacity, and the indicators mainly address social items. Further, the results of such indexes are often more beneficial for developed countries. In comparison, innovative city evaluation in China is more targeted at province-level and prefecture-level cities and generally neglects assessment at a national level. Domestic indicators also generally appear to lack scientificity, authority, universality, effectiveness, operability, and monitoring. It can be seen that a comprehensive assessment system is still a weak link in the research addressing urban sustainable innovation around the world. As such, we advocate that it is necessary to establish a universal scientific evaluation index system, and develop a comprehensive Chinese innovative city evaluation and dynamic monitoring system, which uses GIS methods in order to assess innovative city construction from a scientific perspective.

3 Materials and method

3.1 Evaluation objects and data sources

The evaluation objects in this study of the innovative city in China comprised 287 prefecture-level cities. The data sources used were the national, provincial, and urban Statistical Yearbooks of 2009, 2010, and 2011; on-the-spot investigations; the urban government website; telephone interviews; and relevant computed data. In this paper, 60%-65% of the data came from the China Statistical Yearbooks, the China Statistical Yearbook on Science and Technology, the China Industrial Economy Statistical Yearbook, the China Urban Construction Statistical Yearbook, the China City Statistical Yearbook, the China Statistical Yearbook for Regional Economy, the China Energy Statistical Yearbook, and the provincial statistical yearbooks and statistical yearbooks on science and technology, as well as urban statistical yearbooks and government announcements. Between 10% and 15% of the data came from basic comprehensive assessment during on-the-spot investigation in more than 40 cities (including Beijing, Shanghai, Tianjin, Guangzhou, Shenzhen, Hangzhou, Suzhou, Ningbo, Chongqing, Nanjing, Guiyang, Xi’an, Wuhan, Kunming, and Zhengzhou). Between 20% and 25% of the data came from the city government website, and between 3% and 5% from telephone interviews. In total, this study took into account 114,000 items of basic data, 65,700 items of indicator data, 66,570 items of standardized data, 85,590 items of weight coefficient data (supported by entropy technology), and 85,590 items of fuzzy membership function evaluation index data (which reached an accuracy of 95%, thus ensuring a scientific, objective and authoritative evaluation result).

3.2 The evaluation system

In addressing the construction of innovative cities in China, this research had the following aims: to perform a scientific evaluation, to maintain a focus on independent innovation models, to clarify the role of corporate entities, to emphasize the transformation of economic structures, to present an innovative growth model, and to stress the importance of institutional innovation. The study developed a comprehensive evaluation index system with four second-level indicators (city technology innovation, city industrial innovation, city living environment innovation, and city institutional innovation), ten third-level indicators (innovation platform construction, innovation factor input, innovation achievement transfer, corporate innovation, structural innovation, technology benefiting index, energy-saving and emission-reduction, living environment improvement, innovation service and culture construction, and policy innovation), and 55 fourth-level indicators (Table 1).
Table 1 Constitution of comprehensive assessment system of innovative cities in China
Primary
index
Secondary index Third-level index Fourth-level index
Comprehensive Innovation Assessment Index of a
City A

City Technology
Innovation Index B1
Innovation Platform Construction Index C1 Where D1 is the number of higher education institutions per million people; D2 is the number of national key laboratories per million people; D3 is the number of national engineering research centers per million people; D4 is the number of national high-level technology development zones per million people; D5 is the number of national innovative technology zones per million people; D6 is the number of innovative corporations per million people; D7 is the number of national innovation incubators per million people; D8 is the number of post-doctoral affiliations per million people; and D9 is the number of post-doctoral research work stations per million people.
Innovation Factors Input Index C2 Where D10 is the proportion of social R&D investment to GDP; D11 is the proportion of education funding expenditure to local government expenditure; D12 is the proportion of technology expenditures to local government expenditure: D13 is the proportion of R&D employees to total social employees: D14 is the number of students in college per 10,000 people; D15 is the number of internet users per 100 people; and D16 is the number of mobile phones per 100 people.
Innovation Achievement Transfer Index C3 Where D17 is the number of innovation patents per million people; D18 is the contractual turnover volume in technology market per capita; D19 is the number of effective trademark registrations per million people; D20 is the number of famous Chinese trademarks per million people: D21 is the number of geographic indication products per million people; D22 is the number of independent innovation products at provincial level or above per million people; and D23 is the number of national key new products per million people.
City Industrial Innovation Index B2 Corporate Innovation Index C4 Where D24 is the proportion of Top 500 corporations in the city to the total number of Top 500 corporations; D25 is the number of high-tech corporations at the provincial or above per million people; D26 is the proportion of the number of R&D institutions to total corporations with considerable scale; D27 is the proportion of R&D input to total primary business income of corporations with considerable scale.
Structural Innovation Index C5 Where D28 is the proportion of high-tech industrial output to total industrial output; D29 is the proportion of added value of the service industry to GDP; D30 is the proportion of high-tech product exports in the total exports of all products; D31 is the proportion of output of high-tech industry development zones to GDP; and D32 is the proportion of new product sales to total primary business income with considerable scale
Technology Benefit Index C6 Where D33 is per capita GDP; D34 is total productivity; D35 is the disposable income of urban residents per capita; and D36 is the urban registered unemployment ratio.
City Living Environment Innovation Index B3 Energy-saving and Emission-reduction Index C7 D37 is the comprehensive energy consumption per unit of industrial added value; D38 is the decrease rate of energy intensity per unit GDP; D39 is carbon emissions per 10,000Yuan GDP; D40 is the urban water-saving ratio; and D41 is the comprehensive utilization productivity of “the three wastes”
Living Environment Improvement Index C8 Where D42 is the urban air quality index; D43 is the urban sewage treatment rate; D44 is the urban living garbage harmless disposal rate; D45 is the comprehensive utilization ratio of urban industrial solid wastes; and D46 is the green coverage ratio of urban built-up area.
City Institutional Innovation Index B4 Innovation Service and Culture Construction Index C9 Where D47 is the number of talent intermediary service institutions per million people; D48 is the number of national technology associations per million people; D49 is the number of public library collections per 10,000 people; and D50 is the number of opera houses and movie theaters per 10,000 people.
Policy Innovation Index C10 Where D51 refers to a listing on the “National innovative city pilot” undertaken by the National Development and Reform Commission (NDRC); D52 refers to classification as a “national innovative pilot city” by the Ministry of Science and Technology; D53 refers to classification as a “national sustainable development experimental zone” by the Ministry of Science and Technology; D54 refers to listing as a “national intellectual property pilot city” ; and D55 denotes a rating as a “national outstanding city in technical progress.”
Total 4 10 55

3.3 Comprehensive evaluation analysis model

Based on the model and basic data detailed above, this study adopted an Analytic Hierarchy Process (AHP) model, supported by entropy technology, to assign the weight coefficient according to the importance of indicators at different levels. We used a fuzzy membership function method to establish an innovative city evaluation model (ICEM) value, and to calculate comprehensive innovation index of each innovative city. We also developed new software, named the China Innovative City Comprehensive Assessment and Dynamic Monitoring System V1.0 (National Computer Software Copyright Registration Certificate No.2011SR082055) (Fang and Xiong, 2011), based on GIS technology. The standardized data, weight coefficients, and fuzzy membership function values of these indicators were computed and ranking results obtained through commissioning and trial operation of this software.
Table 2 Strategic spatial configuration planning of national innovative cities
Level Global innovative city National innovative city Regional innovative city Local innovative city Innovation-driven city
Evaluation criteria (Comprehensive innovation index ≥0.75 0.5-0.75 0.25-0.5 0.1-0.25 <0.10
Senior innovative city Senior and middle-level innovative city Middle-level Innovative City Low-level innovative city Primary innovative city (Potential innovative city)
Number of cities 4 16 30 55 182
Innovative status Global Innovation Center National Innovation Center Regional innovation center Local innovation center Innovation center
Basic function World city
International Metropolis National Central City
National central city
Regional central city
Local central city
Local central city Local sub-central city
Regional radiation function Core city of world-class metropolis Core city of national urban agglomeration Core city of regional urban agglomeration Core city of local urban agglomeration Core city of regional city group and circle
Representative cities Beijing
Shenzhen
Shanghai
Guangzhou
Nanjing, Suzhou, Xiamen, Hangzhou, Wuxi, Shenyang, Xi’an, Wuhan, Dalian, Tianjin, Changsha, Qingdao, Changchun, Chengdu, Chongqing, Hefei Zhuhai, Fuzhou, Changzhou, Jinan, Ningbo, Harbin, Taiyuan, Nanchang, Zhenjiang, Yantai, Haikou, Zhengzhou, Shaoxing, Lanzhou, Kunming, Dongguan, Yinchuan, Foshan, Hohhot, Wenzhou, Yangzhou, Huizhou, Taizhou, Mianyang, Guiyang, Shijiazhuang, Urumqi, Shantou, Tangshan, Nanning Weihai, Jinhua, Wuhu, Dongying, Xiangtan, Baotou, Zhoushan, Zhongshan, Zibo, Karamay, Tongling, Jiaxing, Huzhou, Sanya, Nantong, Baoji, Taizhou, Weifang, Jingdezhen, Jiangmen, Laiwu, Quanzhou, Daqing, Zhuzhou, Langfang, Lianyungang, Erdos Jiayuguan, Ma’anshan, Anshan, Jinchang, Benxi,, Changzhi, Xining, Yancheng, Zhangzhou, Yueyang, Huainan, Bengbu, Putian, Lhasa, Tai’an, Jilin, Xinyu, Xuzhou, Qinhuangdao, Ezhou, Luoyang, Guilin, Deyang, Rizhao, Yichang, Liuzhou, Baoding, Dezhou Longyan, Jincheng, Sanming, Lishui, Xuchang, Jining, Zhaoqing, Anyang, Xiangyang, Xingtai, Chengde, Wuhai, Pingdingshan, Quzhou, Binzhou, Zhangjiakou, Linyi, Xinxiang, Chaozhou, Panjin, Shaoguan, Huaian, Liaocheng, Zaozhuang, Tongliao, Mount Huangshan, Yingtan, Xianyang, Yingkou, Yuncheng, Luohe, Huaibei, Zigong, Changde, Yangquan, Shizuishan, Datong, Qingyang, Liaoyuan, Hengshui, Tongchuan, Beihai, Suqian, Yulin, Meizhou, Yanan, Yunfu, Jiaozuo, Yuxi, Cangzhou, Zhangjiajie, Dandong, Handan, Fushun, Yulin
(1) The first level of ICEM. This model focuses on the specific evaluation indicator Uij to build a Uij→Ui evaluation model. Assuming that the evaluation area includes p regional units (p=287, if all the prefecture-level cities are evaluated), the true value (statistical or investigating data) in S regional unit of the jth indicator Uij in the evaluation index set Ui is Uijs (s=1, 2, …, p).
The largest value of the jth indicator in each specific city is the theoretically maximum value; the smallest value of the jth indicator is the theoretically minimum value. That is,
If Uij is a positive indicator (the bigger, the better), the half ascending trapezoidal fuzzy membership function model is chosen; if Uij is a negative indicator (the smaller, the better), the half descending trapezoidal fuzzy membership function model is chosen (Fang et al., 2011).
The comprehensive assessment indicators of the innovative city based on ICEM are all positive ones. aijs is the degree of membership of the sth city unit, which is subordinated from innovation degree of the innovative city, generating the following degree of membership matrix:
In the evaluation index set Ui, if the evaluation indicator’s weight coefficient is Wi=(Wi1, Wi2, , Win), the first-level evaluation result can be obtained by the following formula:
where the Vis (s=1, 2, …, p) is the degree of membership of the sth city unit, which is subordinated from the innovation degree of the innovative city.
(2) The second level of ICEM. This model focused on the evaluation index set Ui that was built up on the evaluation index set U (Ui→U). Based on the first-level evaluation model, let
In the set U, if the weight of each evaluation index set is W=(W1, W2, , Win), the second level evaluation (that is the comprehensive evaluation result) is as follows:
where Vis (s=1, 2, …, p) is the degree of membership of the sth city unit, which is subordinated from the innovation degree of the innovative city. Then, the priority order can be generated by ranking the Vis (s=1, 2, , p) in a descending order.

3.4 Comprehensive innovation index assessment model

This model is mainly used to calculate the comprehensive innovation index U. The city comprehensive innovation index consists of the city technology innovation index U1, city industrial innovation index U2, city living environment innovation index U3, and city institutional innovation index U4. The equation is as follows:
where α1, α2, α3 and α4 represent the contribution coefficients of technology innovation index, industrial innovation index, living environment index, and institutional innovation index respectively to the city comprehensive innovation index i=4; β1, β2 and β3 refer to the contribution coefficients of the innovation platform construction index, the innovation factors input index, and the innovation transfer index respectively to the city technological innovation index, i=4, j=3; γ1, γ2 and γ3 are the contribution coefficients of the corporate innovation index, the structural innovation index, and the technical benefiting index to the city industrial innovation index, i=4, j=3; δ1 and δ2 represent the contribution coefficients of energy-saving and emission-reduction index, and living environment improvement index to the city living environment index, i=4, j=2; ρ1 and ρ2 refer to the contribution coefficients of the innovation service and cultural construction index and the policy innovation index to the city institutional system innovation index, i=4, j=2.
The city can be defined as an advanced innovative city if U≥0.75; the city is regarded as a senior innovative city when U=0.50-0.75. If the innovation index U is between 0.25 and 0.50, the city can be deemed to constitute a middle-level innovative city; and when the index U is less than 0.25, the city is defined as a primary innovative city.

4 Results and discussion

By operating the China Innovative City Comprehensive Assessment and Dynamic Monitoring System V1.0, all the 287 prefecture-level cities’ comprehensive innovation levels could be calculated. The following conclusions can be drawn from the results of that analysis.

4.1 Overall level and development stage

The comprehensive innovation index of each city was found to range between 0.1145-0.6037, 0.1171-0.6022, and 0.1328-0.6233 in 2009, 2010, and 2011 respectively. In fact, only Beijing and Shanghai’s innovative indexes were higher than the average level of 0.5 (although they did not reach 0.75). Based on these results, it can be concluded that with the exception of Beijing and Shanghai it will be difficult for Chinese cities to complete their task to become innovative cities by 2020. Greater efforts are therefore required in order to achieve this goal. Compared with innovative cities in developed countries, all of the 287 prefecture-level cities in China showed a low degree of innovation capacity. Although most cities have prepared an innovative city construction plan, only 60% of the cities studied have proposed an innovative city development strategy and conducted related pilot programs. Whilst these policy developments have improved the coordinated innovative environment and led to some extraordinary achievements, results demonstrate that China’s innovative city construction still occupies the primary stage in the schema outlined in Figure 1 of this paper, and the country has not yet finished the strategic transfer from factor-driven to innovation-driven development. Further, both the single indicator and the comprehensive innovation index indicate a wide gap between China’s innovative city development and to date and real innovative city development. Results reveal that only four cities (Beijing, Shenzhen, Shanghai and Guangzhou) are in the senior stage of innovative city construction. Only 25% of all Chinese cities in China are at the middle stage of innovative city construction, with the rest still occupying the primary stage (Fang, 2013).
By comparing each city’s innovation level and the national average level, it can be seen that 35 cities, accounting for 12.2% of the total prefecture-level cities in China, evidenced comprehensive innovation levels that were above the national average level (0.3144). These cities included Beijing, Shenzhen, Shanghai, Guangzhou, Nanjing, Suzhou, Xiamen, Hangzhou, Wuxi, Wuhan, Xi’an, Shenyang, Changzhou, Zhuhai, Qingdao, Tianjin, Chengdu, Dalian, Hefei, Ningbo, Changsha, Jinan, Zhongshan, Taiyuan, Dongguan, Foshan, Changchun, Fuzhou, Nanchang, Harbin, Dongying, Jiaxing, Zhengzhou, Zhenjiang, and Yantai. Another way of expressing this is to point out that 252 prefecture-level cities (87.8% of the total number of cities studied) had comprehensive innovation levels that were below the national average level.
Among the total 287 cities studied, the top 50 cities - that is, those which displayed an average higher comprehensive innovation index - between 2009 and 2011 were: Beijing, Shenzhen, Shanghai, Guangzhou, Nanjing, Suzhou, Xiamen, Hangzhou, Wuxi, Wuhan, Xi’an, Shenyang, Changzhou, Zhuhai, Qingdao, Tianjin, Chengdu, Dalian, Hefei, Ningbo, Changsha, Jinan, Zhongshan, Taiyuan, Dongguan, Foshan, Changchun, Fuzhou, Nanchang, Harbin, Dongying, Jiaxing, Zhengzhou, Zhenjiang, Yantai, Jinhua, Weihai, Lanzhou, Kunming, Kelamayi, Haikou, Chongqing, Shaoxing, Zibo, Wuhu, Yinchuan, Xiangtan, Huzhou, Hohhot, and Wenzhou.

4.2 Restricted factors and bottlenecks

The findings of the study indicate that innovative city construction in China faces seven low-ratio problems. Firstly, the proportion of city and corporate R&D investment to GDP is relatively low. Secondly, the proportion of new product sales revenue to the total product sales revenue is also low. The third problem lies in the low proportion of high-tech industrial outputs in relation to the total industrial output. Fourthly, cities’ internal dependence on technology is not high. Fifth, the number of invention patent applications to the total patent applications is low. The sixth problem is that the contribution of city technology to economic growth is not high enough. The final, seventh, problem lies in the low proportion of public education funding to GDP in Chinese cities. Results revealed that 98.85% of the cities studied maintained proportions of R&D investment to GDP that were lower than the innovative city construction standard (5%). In about 98% of the cities studied, the proportion of corporate R&D input in relation to the total sales revenue was less than the standard (5%). Further, 99% of the cities studied maintained a proportion of new product sales revenue to the total product sales revenue that was less than the standard (60%) and in 97.6% of the cities studied, high-tech industrial output was less than 60% of the total industrial output. The proportion of most cities’ internal dependence on technology and invention patent applications to total patent applications was less than 70%. In 93.7% of the cities, the contribution of technological development to economic growth was lower than the standard, and in 132 cities, their technical contribution to economic growth was found to be below the national average level (46.5%). Finally, 91.96% of the cities studied evidenced a proportion of public education funding to GDP that was less than the standard (5%). Accordingly, it can be concluded that innovative city construction in China has to face up to bottlenecks in investment, income, technology, contribution and human resources (Fang, 2013).

4.3 Relationship between comprehensive innovation level and economic development

Developed cities tend to have higher comprehensive innovation indexes; correspondingly, the comprehensive index in less developed cities tends to be low. The results of this study reinforce these tendencies. The cities found to have the 10 highest comprehensive innovation indexes - that is, Beijing, Shenzhen, Shanghai, Guangzhou, Xiamen, Suzhou, Nanjing, Hangzhou, Wuxi, and Wuhan - are all well-developed economically. This is also true of the top 10 cities in terms of industrial innovation indexes- namely, Beijing, Shenzhen, Shanghai, Suzhou, Guangzhou, Wuxi, Zhuhai, Xiamen, Dongguan, and Nanjing. The cities which had the 10 highest independent innovation indexes-Beijing, Shanghai, Shenzhen, Guangzhou, Nanjing, Hangzhou, Xiamen, Changsha, Wuhan-are, furthermore, also all located in the developed eastern region. The top 10 institutional innovative cities are also developed cities - Beijing, Guangzhou, Shenyang, Chengdu, Shanghai, Qingdao, Shenzhen, Tianjin, Hefei, and Ningbo. Accordingly, the economic development level is positively related to the comprehensive innovation level. This supports the assertion that innovation is the major driving force in promoting economic growth.

4.4 Spatial heterogeneity and the comprehensive innovation level

Results reveal that some innovation levels (such as the technology innovation level, the industrial innovation level, the living environment innovation level, and the institutional innovation level) were clearly much higher in cities located within the eastern region of China than in those in central and western China. A gradient distribution pattern of the overall comprehensive innovation index therefore illustrates a shift from being the highest in the eastern region to being the lowest in the western region (Figure 2).
Computation revealed that 32 of the top 50 cities with the highest comprehensive innovation indexes from 2009-2011 were located in the eastern region. Further, 9 out of the top 10 cities were located in the eastern coastal region. These included Beijing, Shenzhen, Shanghai, Xiamen, Guangzhou, Nanjing, Suzhou, Hangzhou, and Wuxi. Among the top 10 cities with the highest independent innovation index, 7-namely, Beijing, Shanghai, Shenzhen, Guangzhou, Nanjing, Hangzhou, and Xiamen-were located in the eastern coastal region. All of the top 10 cities with the highest industrial innovation indexes-that is, Beijing, Shenzhen, Shanghai, Suzhou, Guangzhou, Wuxi, Zhuhai, Xiamen, Dongguan, and Nanjing-were located in the eastern coastal region. Further, the eastern coastal cities of Beijing, Guangzhou, Shenyang, Shanghai, Qingdao, Shenzhen, Tianjin, and Ningbo (8 in total) were among the top 10 cities with the highest institutional innovation index. These spatial differences in the comprehensive innovation level in China cannot, we believe, change in the short term.
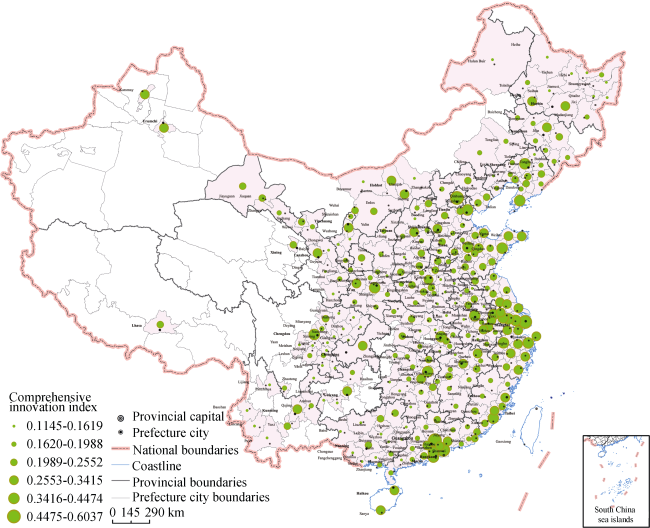
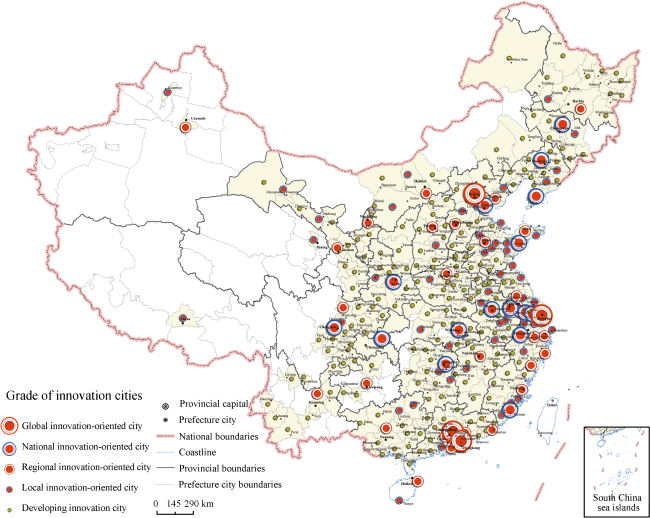
Figure 2 Spatial heterogeneity of the comprehensive innovative level of prefecture-level cities in China
As such, in the next 20 years, the eastern coastal cities will likely be the key places that facilitate China’s comprehensive innovation capacity and strengthen the country’s strategic status on the international stage. These developments will provide important support for China’s goal to construct an innovative country by the year 2020. As such, central and western China holds the key to the continuing production of innovation in the future. Establishing infrastructures and atmospheres of innovation will be fundamental for the leapfrog development of innovation in China.

4.5 Spatial heterogeneity and innovation improvement speed

Turning to the issue of improvements in the comprehensive innovation levels of the cities studied, it is noted that 36 out of the top 50 cities (72%) with the highest growth rates were located in central and western China (26 cities in western China and 10 cities in central China). Further, 26 out of the top 50 cities (of 52%) with the slowest growth rate were located in central and western China (14 western cities and 12 central cities).
A great gap exists between China’s cities in terms of their speeds of development, and this is reflected in the results of this study. For example, the fastest growing city was found to be Wuzhong, with a growth rate of 13.83%; Luzhou was found to take second place, with a rate of 11.29%. However, in contrast, the comprehensive innovation level in 20 cities - including Xiangyang, Quanzhou, Baicheng, Lanzhou, Zhengzhou, Daqing, Yuxi, Qingyang, Baotou, Qingdao, Hefei, Datong, Kunming, Dalian, Jixi, Yingtan, Ma’anshan, Chongqing, Wuhu, and Jiuquan-dropped markedly; among these, the rate of decrease in Jiuquan and Chongqing was 3.66% and 2.93%, respectively.
The growth rate of 241 prefecture-level cities was found to exceed the average national comprehensive innovation development speed of 1.01%, with only 46 cities developing at a lower than the average speeds. This indicates that potential exists for improvement and that prospects are bright for Chinese cities’ comprehensive innovation level in the future.

4.6 Consistency in the spatial pattern

When compared with other innovative cities in developed countries, the 287 Chinese cities studied in fact had relatively low independent innovation levels. The independent innovation indexes of each city in 2009, 2010, and 2011 were found to be between 0.0194-0.5263, 0.018-0.5183, and 0.0235-0.5469 respectively. Only Beijing exceeded the average level (0.5), but was still less than 0.75. Only 77 cities (26.8% of the total studied) were found to maintain a higher independent innovation level than national average level of 0.1288: correspondingly, 73.2% of the total cities were found to be below the average value. A great gap was revealed to exist between cities in terms of their independent innovation level. Developed cities, such as Beijing, Shanghai, Shenzhen, Guangzhou, Nanjing, and Xiamen, tended to have higher independent innovation index. Cities in eastern region performed better than cities in central and western China in terms of their independent innovation and innovation platform construction levels, their completion of innovation facilities, their innovation input and innovation achievement transfer levels. This results in a gradient distribution pattern of the independent innovation level from the highest in the eastern region to the lowest in the western region (Figure 3).
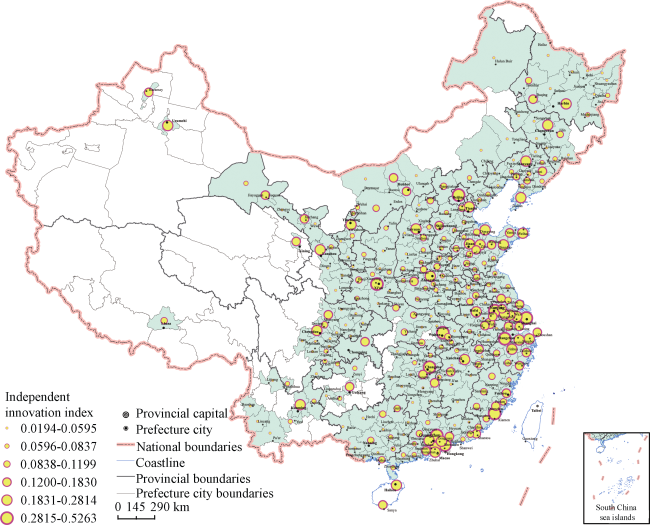
Figure 3 Spatial heterogeneity of the level of independent innovation in Chinese cities
The industrial innovation indexes were found to be between 0.0613-0.6147, 0.0659- 0.6116, and 0.0677-0.6339 in the years 2009, 2010, and 2011 respectively. Only Beijing, Shenzhen, Shanghai, Suzhou, Guangzhou, Wuxi, and Zhuhai had higher industrial innovation levels than the average level of 0.5, but all maintained a level less than 0.75. Compared with innovative cities in developed countries, the industrial innovation level of all of the 287 cities was relatively low - in fact, 83% of the cities studied were below the national average value. Huge regional differences were shown to exist in terms of industrial innovation levels in China. Cities with well-developed economies, such as Beijing, Shenzhen, Shanghai, Suzhou, Guangzhou, Wuxi, and Zhuhai, tended to have higher industrial innovation indexes. Cities in eastern region performed better than cities in central and western China in terms of their industrial innovation and innovation platform construction levels, their completion of innovation facilities, and their innovation input and innovation achievement transfer levels, giving rise to a gradient distribution pattern of the independent innovation level being highest in the eastern region to lowest in the western region (Figure 4).
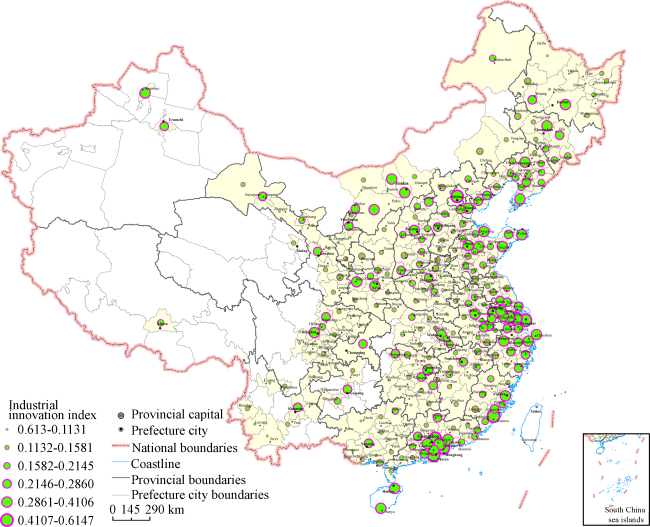
Figure 4 Spatial heterogeneity of the level of city industrial innovation in China
The city living environment innovation indexes were between 0.4624-0.7843, 0.5195-0.8123, and 0.5086-0.8364 in 2009, 2010, and 2011 respectively. The level of city living environment innovation was found to be relatively high, with 80% of all the cities studied exhibiting a living environment innovation level that was higher than the national average. Great differences were still shown to exist between regions, but developed cities did not enjoy a higher living environment innovation level, indicating that no close positive relation exists between living environment innovation level and urban economic development level. For instance, cities like Huangshan, Lianyungang, Dongying, Yingtan, Dalian, Haikou, Zhuhai, and Sanya tended to have higher living environment innovation levels, despite the fact that they are not particularly well developed economically. In contrast, most resource-based cities and mining cities like such as Yangquan, Anshan, Hegang, Weinan, Wuzhong, Jiayuguan, Lanzhou, Chifeng, Jixi, Shuangyashan, Panzhihua, Liupanshui, and Baiyin were found to maintain lower living environment innovation indexes. In general, eastern cities had markedly higher living environment innovation levels and energy-saving and emission-reduction levels than central and western cities. Given these patterns, the living environment innovation index shows a gradient distribution pattern of the independent innovation level that is the highest in the eastern region and the lowest in the western region (Figure 5).
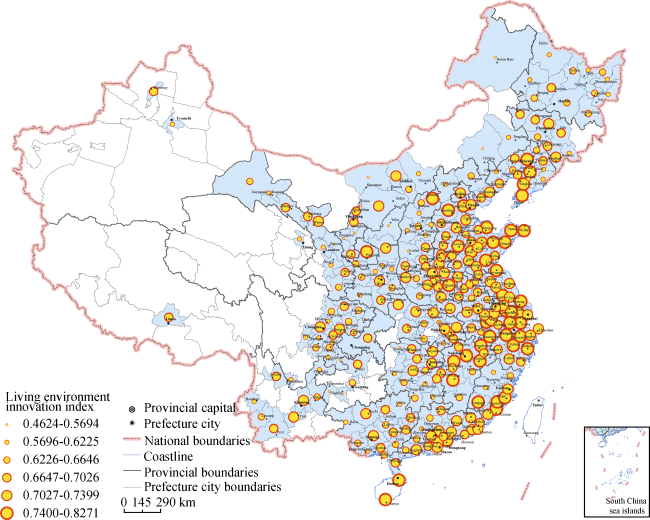
Figure 5 Spatial heterogeneity of the level of living environment innovation in China
The institutional innovation index of each city was found to be between 0.0028-0.7123, 0.0032-0.7222, and 0.0030-0.7264 in 2009, 2010, and 2011, respectively. Only Beijing, Guangzhou, Shenyang, Chengdu, Shanghai, Qingdao, Shenzhen evidenced institutional innovation indexes that were above the average level (0.5). These were still less than 0.75. Compared with innovative cities in developed countries, the institutional innovation level of all the 287 cities studied was revealed to be relatively low, suggesting that Chinese cities may face innovation difficulties in relation to institutional factors in the future. Only four cities (accounting for just 1.39% of the total number of cities) showed institutional innovation levels that exceeded the national average value (0.5796) - namely, Beijing, Guangzhou, Shenyang, and Chengdu. In other words, 98% of cities studied were found to be below the average level. There were, again, huge regional differences at play in the distribution of institutional innovation level. Specifically, developed cities like Beijing, Guangzhou, Shenyang, Chengdu, Shanghai, Qingdao and Shenzhen, tended to have higher institutional innovation levels, and less developed cities were more likely to see lower institutional innovation levels. Generally, cities in the eastern region performed better than cities in central and western China in terms of their urban innovation services, cultural construction levels, and innovation policy levels. Therefore, a gradient distribution pattern of the institutional innovation level was the highest in the eastern region and the lowest in the western region (Figure 6).
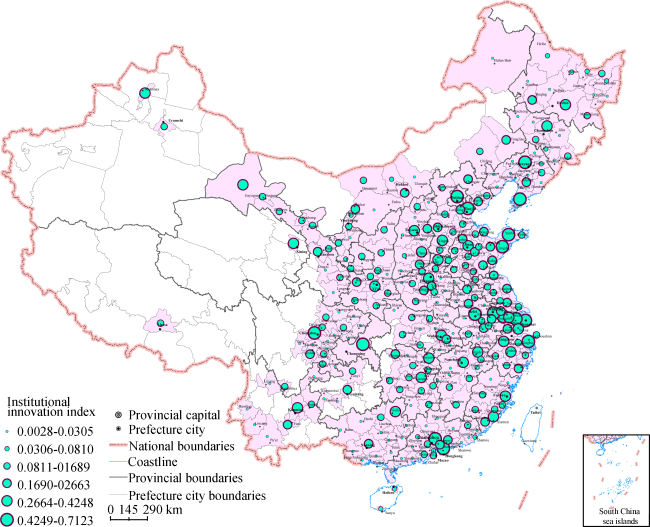
Figure 6 Spatial heterogeneity of the level of institutional innovation in China

5 Conclusions and prospects

study are considered to enrich the theory of sustainable development and innovation in China, thereby greatly facilitating the development of China’s urban geography. Finding can be summarized as follows.
(1) The evaluation model established in this paper in order to address the innovative city in China is more comprehensive than the models advanced in preceding studies. Innovation is a comprehensive concept; as such, this study reflected a number of different aspects of innovative ability in building the model, integrating aspects like a city’s technological innovation ability, city industrial innovation ability, living environment innovation ability, and institutional innovation ability. Through the 55 indicators developed, the study was able to address not only economic, social, and human elements, but also natural, institutional, and technological elements. Moreover, we developed a new piece of software - the China Innovative City Comprehensive Assessment and Dynamic Monitoring System V1.0 - which provides an advanced technical method for the current and future assessment of China innovative city sustainable development.
Figure 7 Strategic spatial configuration planning of national innovative cities
(2) The 287 prefecture-level cities in China considered in this study evidenced a spatially heterogeneous character not only in terms of their levels of comprehensive innovation, but also in terms of their innovation improvement speeds. Further, in the process of constructing an innovative country, comprehensive innovation levels in the eastern region were generally found to be markedly higher than those observed in central and western China. This disparity resulted in a gradient distribution pattern of the overall comprehensive innovation index that showed the highest levels in the eastern region and the lowest in the western region. The innovation improvement speed of the 287 prefecture-level cities studies was found to reflect the same character - cities with the highest improvement speeds were located in central China, and cities with the lowest improvement speeds were located in western China. The innovative ability of cities in China was also found to be spatially heterogeneous in character, a finding which is consistent with current understandings of Chinese socioeconomic space.
(3) Ultimately, this paper proposes that good prospects exist for the development of the innovative space of Chinese cities. Given the findings detailed here, we suggest that the guiding principle for the next step of constructing innovative cities should be “independent innovation, breakthroughs in key fields, market-oriented, regional interaction, and talent-supported,” and the core thread should be the improvement of the various aspects which compose Chinese cities’ independent innovation ability. Meanwhile, the four key directions of innovative city construction in China are: independent innovation, industrial innovation, living environment innovation, and institutional innovation. Through the pursuit of these directions, China should be able to realize its goal to construct a number of innovative cities with significant radiating and leading influence in each of the country’s regions, and even around the world. Based on the classifications resulting from this comprehensive assessment, it can be suggested that by the year 2020, Beijing, Shenzhen, Shanghai, and Guangzhou will have developed into four global innovation centers; and that Nanjing, Suzhou, Xiamen, Hangzhou, Wuxi, Shenyang, Xi’an, Wuhan, Dalian, Tianjin, Changsha, Qingdao, Changchun, Chengdu, Chongqing, and Hefei will form 16 national innovation centers. Ultimately, we see the new spatial pattern of China’s innovative city network as containing four international innovative cities, 16 national innovative cities, 30 regional innovative cities, 55 local innovative cities, and 182 innovation-driven cities, which indeed would contribute to the completion of the construction of an “innovative country” (Table 2 and Figure 7).

The authors have declared that no competing interests exist.

1
2Thinknow, 2012. Innovation Cities Top 100 Index 2011

2
Athey G, Nathan M, Webber Cet al., 2008. Innovation and the city.Innovation: Management Policy & Practice, 10(2/3): 156-169.

3
Campbell M O, 2006. Urban parks as shared spaces? The utility of alert distances as indicators of avian tolerance of humans in Stirling, Scotland.Area, 38(3): 301-311.

4
Cetindamar D, Gunsel A, 2012. Measuring the creativity of a city: A proposal and an application.European Planning Studies, 20(8): 1301-1318.

5
Chen S, Karwan K, 2008. Innovative cities in China: Lessons from Pudong New District, Zhangjiang High-tech Park and SMIC Village.Innovation: Management Policy & Practice, 10(2/3): 247-256.

6
Chen Yongming, 2007. How far does Shanghai away from innovative city: Comment on statistical indicator system for Shanghai City construction.Party & Government Forum, (1): 37-39. (in Chinese)

7
Chinese Science and Technology Development Strategy Research Group (CSTDSRG), 2011. Annual Report of Regional Innovation Capability of China 2010: A Study of Pearl Delta Regional Innovation System. Beijing: Science Press, 33-36. (in Chinese)

8
Cohendet P, Grandadam D, Simon L, 2010. The anatomy of the creative city.Industry and Innovation, 17(1): 91-111.

9
Dente B, Coletti P, 2011. Measuring governance in urban innovation.Local Government Studies, 37(1): 43-56.

10
Dutta S, Benavente D, 2011. The Global Innovation Index 2011.

11
European Commission, 2010. Innovation Union Scoreboard 2010.

12
Evaluation of China Innovation Cities Research Group, 2009. Report on evaluation of China innovation cities.Statistical Research, 26(8): 3-9. (in Chinese)

13
Evans J, Jones P, 2008. Rethinking sustainable urban regeneration: Ambiguity, creativity, and the shared territory.Environment and Planning A, 40(6): 1416-1434.

14
Fang Chuanglin, 2013. The construction status quo evaluation and bottleneck analysis of Chinese innovative cities.Urban Development Studies, 20(5): 90-98. (in Chinese)

15
Fang Chuanglin, Liu Yi, Lin Yueran, 2013. Report on Development of Innovative Cities in China. Beijing: Science Press, 2-3. (in Chinese)

16
Fang Chuanglin, Xiong Shu, 2014. A Software for Comprehensive Evaluation and Dynamic Monitoring for Chinese Innovative Cities (V1.0), National Computer Software Certificate Registration No.2011SR082055. (in Chinese)

17
Fang Chuanglin, Zhang Xiaolei, Shi Yulong et al., 2011. Analysis and Decision Support Systems for China’s Town Industry Distribution. Beijing: Science Press, 78-85. (in Chinese)

18
Fitjar R D, Rodriguez-Pose A, 2011. When local interaction does not suffice: Sources of firm innovation in urban Norway.Environment and Planning A, 43(6): 1248-1267.

19
Florida R, 2002. The Rise of the Creative Class. New York: Basic Books, 2-7.

20
Hall P G, 1998. Cities in Civilization. London: Weidenfeld and Nicolson, 22-23.

21
Hospers G J, 2008. Governance in innovative cities and the importance of branding.Innovation: Management Policy & Practice, 10(2/3): 224-234.

22
Hu Jintao, 2012. Unswervingly Advance along the Road of Socialism with Chinese Characteristics, Struggle for Building a Moderately Prosperous Society. Beijing: People’s Publishing House, 20-21. (in Chinese)

23
Isaksen A, Aslesen H W, 2001. Oslo: In what way an innovative city? European Planning Studies, 9(7): 871-887.

24
Iskander N, Lowe N, Riordan C, 2010. The rise and fall of a micro-learning region: Mexican immigrants and construction in center-south Philadelphia. Environment and Planning A, 42(7): 1595-1612.

25
Ji Baocheng, Zhao Yanyun, 2008. China towards an Innovation Country: China’s Innovation Index. Beijing: China Renmin University Press, 123-127. (in Chinese)

26
Johnson B, 2008. Cities, systems of innovation and economic development.Innovation: Management Policy & Practice, 10(2/3): 146-155.

27
Johnston A, 2011. The Economic Performance of UK Cities, 1995-2005: Driven by knowledge-based sectors or consumption-based sectors?European Planning Studies, 19(12): 2095-2108.

28
Landry C, 2000. The Creative City: A Toolkit for Urban Innovators. London: Earthscan Publications Ltd., 67-87.

29
Lee N, Drever E, 2013. The creative industries, creative occupations and innovation in London.European Planning Studies, 21(12): 1977-1997.

30
Leslie D, Rantisi N M, 2011. Creativity and place in the evolution of a cultural industry: The case of Cirque du Soleil.Urban Studies, 48(9): 1771-1787.

31
Lin C Y, 2014. The evolution of Taipei’s music industry: Cluster and network dynamics in the innovation practices of the music industry. Urban Studies, 51(2): 335-354.

32
Liu H L, Zhou G H, Wennersten Ret al., 2014. Analysis of sustainable urban development approaches in China.Habitat International, 41: 24-32.

33
López-Claros A, Mata Y N,2011. The Innovation for Development Report 2010-2011.

34

35
Ma Haitao, Fang Chuanglin, Wang Shaojian, 2013. Basic characteristics of global innovation cities and its implications for China.Urban Planning Forum, (1): 67-77. (in Chinese)

36
Marceau J, 2008. Innovation in the city and innovative cities. Innovation: Management Policy & Practice, 10(2/3):

37
Ministry of Housing and Urban-Rural Development of the People’s Republic of China, 2012. China Urban Construction Statistical Yearbook-2011. Beijing: China Statistics Press, 33-187. (in Chinese)

38
National Bureau of Statistics, 2012. China City Statistical Yearbook-2011. Beijing: China Statistics Press, 8-238. (in Chinese)

39
National Bureau of Statistics, 2012. China Industry Economy Statistical Yearbook-2011. Beijing: China Statistics Press, 12-38. (in Chinese)

40
National Bureau of Statistics, 2012. China Statistical Yearbook for Regional Economy-2011. Beijing: China Statistics Press, 24-65. (in Chinese)

41
National Bureau of Statistics, 2012. China Statistical Yearbook on Science and Technology-2011. Beijing: China Statistics Press, 22-132. (in Chinese)

42
National Bureau of Statistics, 2012. China Statistical Yearbook-2011. Beijing: China Statistics Press, 14-355. (in Chinese)

43
National Innovation System Strategy Research Group (NISSRG), 2008. Annual Report on Development of National Innovation System: Research on National Innovation System. Beijing: Intellectual Property Publishing House, 75-79. (in Chinese)

44
National Innovation System Strategy Research Group (NISSRG), 2011. Annual Report on Development of National Innovation System Construction of Innovative Cities. Beijing: Science Press, 28-59. (in Chinese)

45
Porter M E, Stren S,

46
Qian Wei, 2011. Development path of innovative cities: Transformation experience and inspiration of typical cities of USA.Reform & Opening, (4): 16-19. (in Chinese)

47
Ren Yong, Yang Daoyun, Chen Hong, 2009. Building and empirical analysis of evaluation index system on city innovation ability.Science & Technology Progress and Policy, 26(17): 141-144.

48
Research team on independent innovation of economic daily, 2011. Independent Innovation Annual Report 2011. Beijing: Economic Daily Press, 2-28.

49
Schumpeter J A, 1991. The Theory of Economic Development. Beijing: The Commercial Press, 13-25. (in Chinese)

50
Simmie J, 2001. Innovative Cities. London/New York: Spon Press, 44-49.

51
The Center for Innovation and Development of CAS, 2009. The Report on Innovation and Development in China 2009. Beijing: Science Press, 72-76. (in Chinese)

52
Vanolo A, 2013. Alternative Capitalism and creative economy: The case of Christiania. International Journal of Urban and Regional Research, 37(5): 1785-1798.

53
Wei Y H D, Liefner I, Miao C H, 2011. Network configurations and R&D activities of the ICT industry in Suzhou municipality, China.Geoforum, 42(4): 484-495.

54
Zhan Zhengmao, Xiong Simin, 2010. Annual Report on Building an Innovation-oriented Country (2010). Beijing: Social Sciences Academic Press, 82-87. (in Chinese)

55
Zhou Yuan, 2007. Research on the Regional Indigenous Innovation of China (2006-2007): Theory and Practice of Regional Indigenous Innovation. Beijing: China Water Power Press, 115-119. (in Chinese)

Outlines

/