Research Articles

Atmospheric correction of HJ-1 A/B CCD over land: Land surface reflectance calculation for geographical information product

  • FU Qiaoyan 1, 2 ,
  • MIN Xiangjun 2 ,
  • SUN Lin 1 ,
  • MA Shengfang 1
Expand
  • 1. Institute of Remote Sensing and Digital Earth, CAS, Beijing 100101, China
  • 2. China Center for Resources Satellite Data and Application, Beijing 100094, China

Author: Fu Qiaoyan (1970-), Professor, specialized in vicarious calibration and quantitative application studies of satellites. E-mail:

Received date: 2013-03-12

  Accepted date: 2014-01-20

  Online published: 2014-06-20

Supported by

National High Technology Research and Development Program of China, No.2012AA12A302

Copyright

Journal of Geographical Sciences, All Rights Reserved

Abstract

This paper proposed a method to retrieve the land surface reflectance from the HJ-1A/B CCD data. The aerosol optical depth (AOD), the most important factor affecting the atmospheric correction of CCD images at all bands, is proposed to retrieve from the CCD imagery by the approach of dense dark vegetation (DDV) method. A look-up table in terms of the transmittances, the path radiances and the atmospheric spherical albedo as functions of the AOD was established for a variety of sun-sensor geometry and aerosol loadings. The atmospheric correction is then achieved with the look-up table and the MODIS surface reflectance output (MOD09) as the priori datasets. Based on the retrieved AOD and the look-up table of atmospheric correction coefficients, the land surface reflectance was retrieved for the HJ-1A/B data according to the atmospheric radiative transfer equation. Some in-situ measurement Data for Yanzhou of Shandong province in East China and MODIS land surface reflectance products MOD09 are used to preliminarily validate the proposed method. The results show that the proposed method can remove effectively the atmospheric contributions, and the overall accuracy of the retrieval land surface reflectance can be improved substantially.

Cite this article

FU Qiaoyan , MIN Xiangjun , SUN Lin , MA Shengfang . Atmospheric correction of HJ-1 A/B CCD over land: Land surface reflectance calculation for geographical information product[J]. Journal of Geographical Sciences, 2014 , 24(6) : 1083 -1094 . DOI: 10.1007/s11442-014-1140-0

1 Introduction

Atmospheric influence is one of the main factors that cause errors for land surface parameters estimation from spaceborne data. Thus, atmospheric correction, which aims to remove the atmospheric perturbation introduced in the signal registered by remote sensing sensors, is one of the most important processes to obtain accurate geographical and biophysical products for earth observation purposes.
Many methods of atmospheric correction have been developed and improved in recent years for different applications. Three of them are very popular and widely used. One is called the invariant object regression method, which was developed by Richter et al. (1996). In this method, the atmosphere distribution in the whole image is considered to be uniform, and a group of pixels whose reflectances do not change significantly under different geometric conditions, are selected. Based on the reflectance values of these pixels, a regression equation between surface reflectance and apparent reflectance is established. The second is the histogram matching method, which assumes that the reflectance histograms should be almost the same in different images for the same scene. Therefore, the histogram of a clear image can be used to estimate the histogram of a hazy image, and then obtain the reflectance of the hazy image. Both of these two methods are based on the assumption that the atmosphere is uniform in the whole image. They do not work well for the images which cover a big area, where the atmosphere is heterogeneous. Therefore, the uniform assumption of the atmosphere can cause a large error on estimating the reflectance using the above atmospheric correction methods. The atmospheric correction methods based on radiative transfer models were also developed (Liang, 2001) to estimate the reflectance. In this method, the atmosphere is considered to be inhomogeneous, and the optical parameters of the atmosphere are calculated pixel by pixel through the images. This method has been widely used in quantitative remote sensing of land surface.
HJ-1 A/B satellites are the Chinese spaceborne constellation designed for monitoring and forecast of environment and disaster. HJ-1A/B satellites were launched on September 6, 2008, designed for environmental and disaster monitoring. There are two charge-coupled devices (CCD) and one hyper spectral instrument (HSI) onboard the HJ-1A satellite, while two CCDs and one infrared scanner (IRS) onboard HJ-1B satellite. The combination of two CCD cameras can acquire a swath width of 700 km with the revisit period of 48 hours. The CCD cameras have four bands named band 1 (0.43-0.52 µm), band 2 (0.52-0.60 µm), band 3 (0.63-0.69 µm), and band 4 (0.76-0.90 µm). The ground spatial resolution of CCD cameras is 30 m. (Table 1). Thanks to the high spatial resolution and short period revisit time, the cameras can acquire land-cover and atmospheric parameters with high frequency. However, the accurate atmospheric correction of HJ-1 A/B CCD image is still a challenge, which limits the applications of CCD data in various fields such as agriculture, forestry, water conservancy and environmental protection.
Note that the scattering of atmospheric molecules and aerosols and the absorption of ozone and other gases such as water vapor can weaken the signals received by sensors. For the four bands of HJ-1CCD sensor, the main factor that affects the images of these bands is the scattering and absorption of aerosol. Retrieval of aerosol optical depth (AOD) thus becomes a key process before atmospheric correction for HJ-1CCD data. Aerosol retrieval is based on the comparison of the radiation received by an instrument at the top of atmosphere (TOA) with that calculated using a radiative transfer model for the same geometry and atmospheric conditions, for a variety of aerosol models. The approaches of aerosol remote sensing mainly include the following techniques: i) dark object method (Teillet and Fedosejevs 1995; Tulloch and Li 2004; Hadjimitsis and Clayton 2006); ii) contrast-reduction method (Tanré et al., 1988; Holben et al., 1992); and iii) multichannel reflectance method (Gordon and Wang 1994; Durkee et al., 1986, 1991). Among them, dark object method is the most popular method for AOD retrieving. We present a method to calculate the AOD for the atmospheric correction with HJ-1 CCD data, which uses MODIS surface reflectance output (MOD09) as the priori datasets to support HJ-1A/B CCD aerosol retrieval (Sun et al., 2011)
Table 1 Technical parameters for HJ-1A/B CCD sensors
Spatial resolution 30 m (in nadir)
Swath width 360 km (CCD*2≥700 km)
Aspect angle 31°
Revisit period 2 days
Spectral resolution Band 1 (0.43-0.52 µm)
Band 2 (0.52-0.60 µm)
Band 3 (0.63-0.69 µm)
Band 4 (0.76-0.90 µm)
The objective of this study is focused on the retrieval of land surface reflectance from HJ-1 A/B satellites CCD data. Section 2 describes the methodology with respect to the atmospheric correction method, the aerosol optical depth retrieval method, and the land surface reflectance retrieval method. Section 3 shows the correction results and some preliminary validations. Section 4 gives some uncertainty analysis involved in the method. The conclusions are drawn in Section 5.

2 Methodology

Assuming that the land surface is Lambertian, the radiance in the solar spectrum which reaches HJ-1 A/B CCD at TOA can be approximately written as:
where 
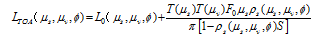
is the radiance measured by the satellite sensor at TOA; is the cosine of the solar zenith angle; is the cosine of the view zenith angle; is the relative azimuth angle between the direction of propagation of the emerging radiation and the incident solar direction; is the path radiance; is the total atmospheric transmittance along the sun to target path; is the total atmospheric transmittance along the target to sensor path; F0 is the solar irradiance at the TOA; represents the surface reflectance; S is the spherical albedo of the atmosphere.
The quantities, and S are as functions of the optical depth (τ), single scattering albedo (ω), and phase function (P(q)) of the scattering and absorbing constituents of the atmosphere. The calculations of and S are achieved with the aid of an atmospheric radiative transfer program, e.g., the Dave and Gazdag (1970) model. However, it is computationally prohibitive to run a radiative transfer calculation for every pixel in a daily global dataset. A better approach is to implement the look-up table approach. It consists of three steps: i) determining of AOD for the image; ii) creating the look-up tables with a radiative transfer code, such as 6S with the various AOD; and iii) calculating of with the value of AOD.

2.1 Aerosol optical depth retrieval

From equation (1), we can see that each term on the right hand side is a function of AOD. Quality of the surface reflectance estimates is strongly driven by the knowledge of AOD. Thus, the accurate retrieval of aerosols is an important step. When the reflectance of surface is low, the scattering effect dominates over dark surfaces, while this effect is mixed with absorption effect over brighter surfaces. Therefore, the aerosol scattering effect is stronger for low surface reflectance, and could be used in an inversion procedure to assess the AOD. Kaufman and Sendra (1997) suggested using dense dark vegetation (DDV), usually green forests, as the dark targets to derive the AOD. In order to estimate AOD over land, the sur-face reflectance of these dark pixels must be estimated to an uncertainty of 0.005-0.01. This uncertainty translates to an error in optical depth of 0.05-0.1 (Kaufman, 1993). Therefore we need a method to assess the surface reflectance through an aerosol layer of unknown op- tical depth. There are three methods often used to estimate the reflectance of the land surface. Kaufman and Sendra (1997b) used a vegetation index measured at TOA to detect the dense dark vegetation and then gave the reflectance. Since the vegetation index is affected significantly by the aerosol (Higurashi et al., 1999), the threshold value that defines dense vegetation varies from image by image depending on the aerosol concentration. To solve this problem, Holben et al., (2001) and Kaufman et al. (1988), used the 3.75 µm channel to de- tect dense vegetation. For longer wavelength, the reflectance is slightly affected by aerosol (Kaufman et al., 1988), except dust (Berk et al., 1989). Moreover, the 2.1 µm channel is presented on Global Imager GLI, EOS-MODIS and Landsat TM. The advantage of the 2.1 µm channel over the 3.75 µm channel is that it is not affected by emitted radiation. The 2.1 µm channel is almost transparent to most aerosol types (except dust) and therefore can be used to detect dark surface targets. Correlation between the surface reflection in the blue (0.49 µm), red (0.66 µm), and 2.1 µm has been established (Kaufman, 1988). Results from a variety of surface covers show that the surface reflectance at 0.49 µm ( ) and 0.66 µm can be predicted from that at 2.1 µm In the case of less than 0.1, one can obtain 
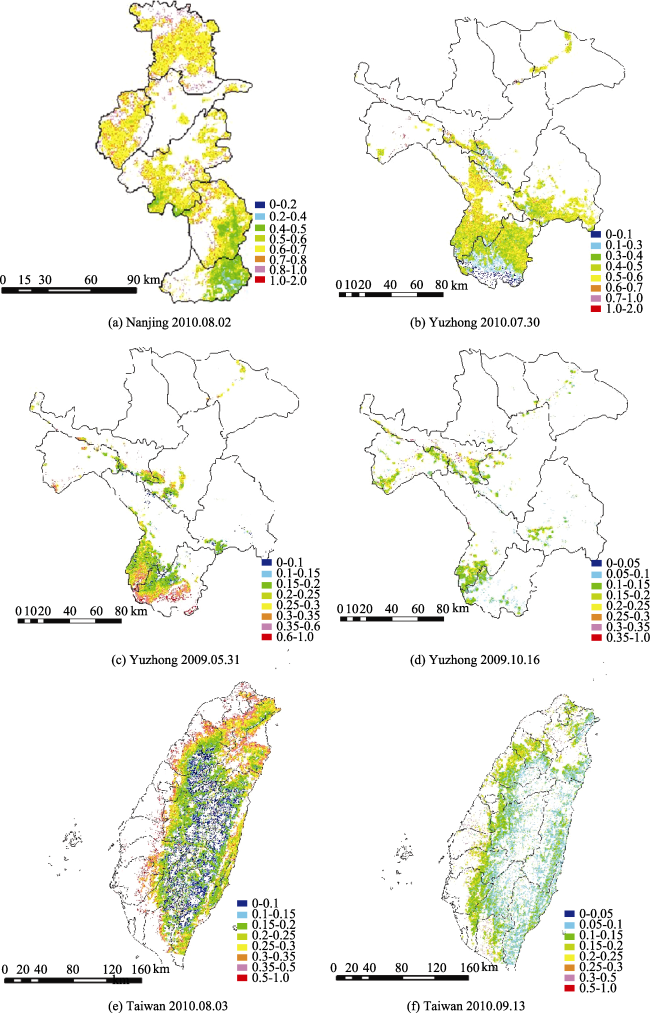
and It is a challenge to retrieve AOD from HJ-1A/B CCD data due to lack of spectral band around 2.1 µm. Although aerosol loadings can be obtained over some regions from vegetation indices, such as NDVI, the correction accuracy is still greatly affected by aerosol and the determination of DDV regions with great subjectivity (Kaufman et al., 1997b). The method proposed by Sun et al. (2011) is used to retrieve aerosol loadings, which uses MODIS surface reflectance output (MOD09) as the priori datasets to support HJ-1A/B CCD aerosol retrieval. The spatial resolution of HJ-1A/B CCD was transferred to 500 m and the correlation function of HJ-1A/B CCD and the MOIDS apparent reflectance were built based on their spectral response function and the spectrum of typical land types. MOD09 is used to provide the percentage of dense vegetation distributions, and then AOD is retrieved from equation (1) based on the surface reflectance relationship between red and blue bands over DDV regions developed by Kaufman (1988).

2.2 The look-up table

The surface reflectance can be estimated by solving the radiative transfer (RT) equation. To save time, here, we estimate surface reflectance with look-up table (LUT). This LUT was built by Second Simulation of the Satellite Signal in the Solar Spectrum (6S). 6S TR code is used for simulating the satellite signal between 0.25 μm and 4.0 μm (Vermote, 2006). Absorption and scattering of atmospheric gases and multi-scattering of aerosols are considered in calculating atmospheric transmittance. Users can measure surface data to define their own atmospheric model or use six different atmospheric models defined in 6S. Standard aerosol models, including continental model, maritime model, urban model, the Shettle model for background desert aerosol, biomass burning, and a stratospheric model are defined in this code. Users can also use their own aerosol model.
A LUT for surface reflectance can be produced through calculating the relationships among surface reflectance and main atmospheric parameters L0, S and transmittance under different AOD based on the settings of relevant parameters (Vermote, 2006). The following parameters were considered: (1) Observation conditions including solar zenith, solar azimuth, sensor zenith and sensor azimuth angles. Six sensor zenith angles from 0° to 35° with a step of 6°; 18 solar zenith angles from 0° to 85° with a step of 5°; 19 relative azimuth angles from 0° to 180° with a step of 10°. (2) Atmospheric model, northern mid-latitude summer and mid-latitude winter atmospheric models were selected in this LUT constructing. (3) Aerosol model, four aerosol models (the continental, oceanic, dust and biomass burning aerosol models) with AOD at 550 nm in 10 grades: including 0.0, 0.1, 0.2, 0.3, 0.4, 0.5, 0.8, 1.0, 1.5 and 2.0 are used to describe the aerosol conditions.

3 Results and analyses

3.1 Data description

Six images in three different areas representing typical areas of China are selected in this study: Nanjing in Jiangsu province with high vegetation coverage and serious air pollution; Yuzhong in Gansu province with low vegetation coverage and much air pollution; Taiwan with dense vegetation coverage and relatively clean air. The radiometric calibration and the geometric correction of the images have been performed. In order to illustrate the aerosol optical depth more clearly, we cut out the part images from the six HJ-1A/1B CCD images with the administrative boundary line of Nanjing, Jiangsu province, Yuzhong, Gansu province and Taiwan. These images are very clear except for a small patch of cloud in Nanjing City and some parts of Taiwan. In the false color composite image, the red pixels are covered by vegetation. We can see that most parts of Nanjing and Taiwan are covered by dense vegetation, while only the southern part of Yuzhong is covered by vegetation.

3.2 Retrieval results of aerosol optical depth

With the DDV data obtained from MOD09 data, AOD is retrieved from the six HJ-1 CCD images. Figure 1 is the results and we can see that the aerosol distributions in Nanjing and Taiwan are denser than that in Yuzhong of Gansu. This can be explained by the fact that ar-eas covered by dense vegetation in Nanjing and Taiwan are bigger than the area in Yuzhong. Some ground-based in-situ measurements of AOD acquired from AERONET (AErosol RObotic NETwork) is used to validate the estimated AOD results. The AERONET is a eries of ground-based remote sensing aerosol networks established by NASA and PHOTONS. The network provides a long-term, continuous and readily accessible public database of aerosol optical, microphysical and radiative properties for aerosol research and characterize-tion, as well as validation of satellite retrievals. The AERONET AOD of level 2.0 screened and quality-assured) is selected to validate the aerosol retrieval results. We use the average AOD of 20×20 pixels around the AERONET site to compare with the AOD acquired from AERONET (Table 2). Table 2 shows that the retrieval AOD results agree well with those of AERONET observations. Among the eight validation cases,the maximum error is 0.051, which is able to meet the AOD needs of atmospheric correction as mentioned in section 2.1.
Figure 1 Distributions of aerosol optical depth in Nanjing, Taiwan and Yuzhong
Table 2 Validation of aerosol optical depth by comparison with AERONET observation
Date Station of AERONET AOD for AERONET AOD for retrieval Absolute error
2010.08.02 Nanjing, Jiangsu province 0.60 0.638 0.038
2010.07.30 Yuzhong, Gansu province 0.52 0.495 0.025
2009.05.31 Yuzhong, Gansu province 0.26 0.265 0.005
2009.10.16 Yuzhong, Gansu province 0.17 0.189 0.019
2010.08.03 Taipei, Taiwan area 0.25 0.255 0.005
2010.08.03 Chen-Kung_Univ, Taiwan 0.10 0.151 0.051

3.3 Atmospheric correction

The reflectance can be retrieved with the following equation.
Based on 6S radiation transfer code, we establish the look-up table (LUT) of coefficients of atmospheric correction in equation (2). The LUT is established as a tree form. To correct image quickly and accurately, we enlarge position and interpolation of the coefficients of atmospheric correction.
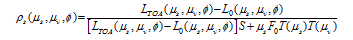
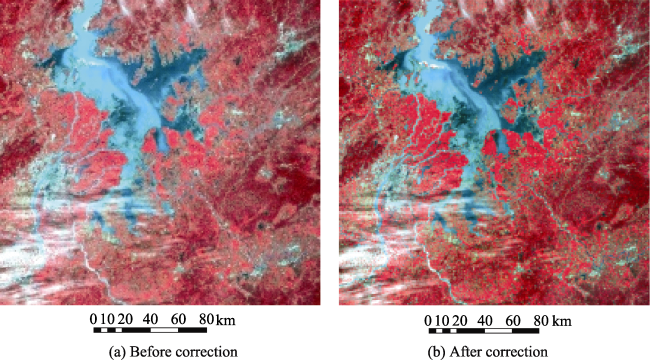
Figure 2 Comparison between images before and after atmospheric correction in the Poyang Lake and its surrounding areas
Figure 2 is the comparison between images before and after atmospheric correction in the of Poyang Lake and its surrounding areas. Figure 3a is the image before the atmospheric correction and Figure 3b is the image after the atmospheric correc-tion. The image becomes clearer when atmospheric correction has been done. We can see more details such as the river channels from the image when the atmospheric effect is removed.
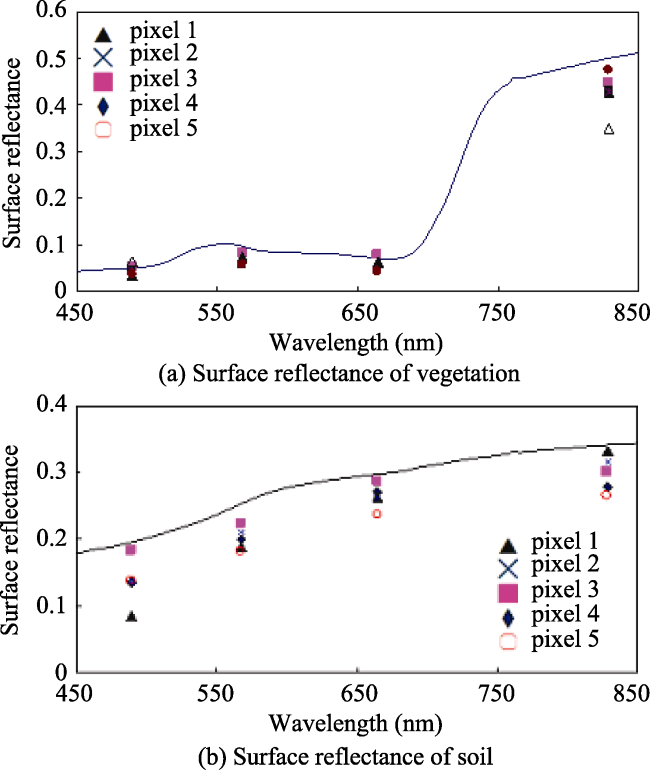
Figure 3 Reflectance of pixels and ground measurement after atmospheric correction in Yanzhou, Shandong province
There are three validation methods which can be used to evaluate the performance of the atmospheric correction.
(1) Comparison of the retrieved reflectance of HJ-1A/1B CCD after atmospheric correction with those measured by Analytical Spectral Devices (ASD) instrument from ground. Note that the ASD can obtain a continuous spectral curve of the reflectance in the visible/near-infrared wavelength, and the reflectance retrieved from HJ-1 A/B CCD data are band-based reflectance covering limited spectral width, the measured spectral reflectance needs to be integrated with the spectral response functions of HJ-1 A/B CCD for each band to obtain the corresponding band reflectance. Two types of land cover (vegetation and soil) are used in the comparison. Figure 2a is the comparison of the vegetation reflectance and Figure 2b is the soil reflectance. The continuous spectrum line is the reflectance measured by ASD instrument, and the discrete dots in four groups are the reflectance extracted from HJ-1A/1B CCD images. In Figure 3, it can be seen that the reflectance of vegetation and soil in the four bands have similar trend with the reflectance of ground measurement. The precision is higher when the reflectance is lower (e.g. the vegetation reflectance in visible bands), and the error increases with the increase of the reflectance (e.g. vegetation reflectance in near-infrared band and the soil reflectance in each band).
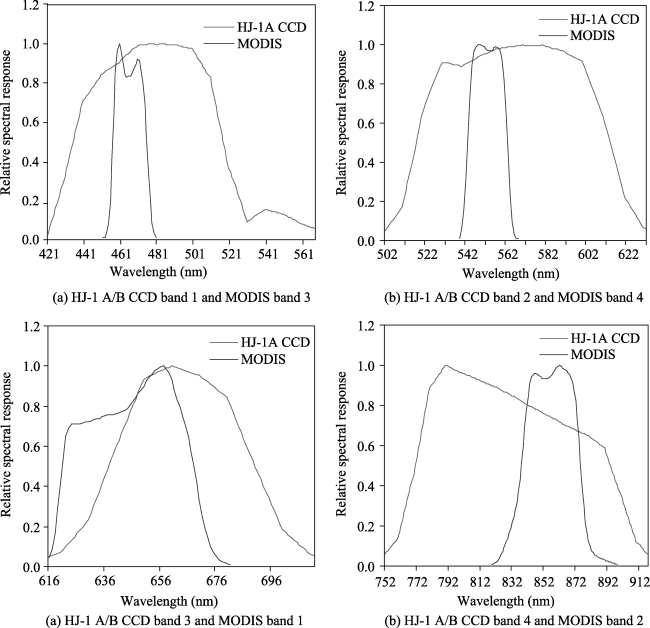
Figure 4 Spectral response function of HJ-1 A/B CCD and MODIS related bands
(2) Comparison with MODIS surface reflectance products. MOD09 product has 7 different bands, centered at 0.66, 0.87, 0.46, 0.56, 1.24, 1.64, and 2.13μm respectively with a spatial resolution of 500 m (Vermote et al., 1999). This product removed the effects of gaseous and aerosol scattering and absorption as well as adjacency effects caused by variation of land cover. Bidirectional Reflectance Distribution Function (BRDF) and atmosphere coupling effects, and contamination by thin cirrus have been considered in the product of MOD09. The product can reflect the actual reflectivity of the surface more realistically (Liang et al., 2002). Although there are some differences in spectral response function (Figure 4) between HJ-1 A/B CCD and the related bands of MODIS, the reflectance of the typical land types are almost the same, according to the simulation with the land surface spectrum by Sun et al. (2011). We compared the reflectance of the same area at the same time with HJ-1 A/B CCD and MODIS products (Figure 5). To avoid the impact of pixels mismatch, the pure pixels in the center of the uniform area in both two kinds of images were selected and the spatial resolution of HJ-1 A/B CCD was transferred to 500 m. Result shows that the reflectance of HJ-1 A/B CCD is well in accordance with the MODIS products (Table 3).
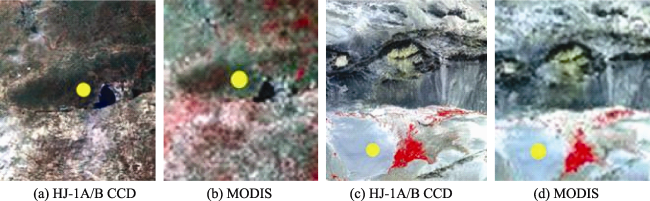
Figure 5 Images of land surface reflectance from HJ-1 A/B CCD and MODIS in Gong Geer grassland and Dunhuang Gobi site
Table 3 Reflectance of HJ-1A/1B CCD and MODIS in Gong Geer grassland and Dunhuang Gobi site
HJ-1A/1B CCD band Reflectance of HJ-1A/1B CCD MODIS Band Reflectance of MODIS
CCD1
Band 1 0.0570 Band 3 0.0462
Band 2 0.0821 Band 4 0.0843
Band 3 0.1202 Band 1 0.0958
Band 4 0.2066 Band 2 0.2297
CCD2
Band 1 0.2069 Band 3 0.1551
Band 2 0.2468 Band 4 0.2203
Band 3 0.2854 Band 1 0.2530
Band 4 0.2803 Band 2 0.2693

4 Uncertainty analysis

Uncertainty in the proposed atmospheric correction can come from many different sources. In this section, we discuss several important uncertainties.
(1) Radiometric calibration
Uncertainty on absolute calibration will affect the accuracy of the reflectance at TOA and thus the corrected reflectance. We simulate an error of ±2% on the TOA reflectance in the case of average aerosol loading (optical depth of 0.3 at 550 nm for a continental model) and compute the resulting error on surface reflectance. The relative error of 2% could translate to a higher error on surface reflectance for bands where atmospheric contribution is much larger than surface contribution, typically under high view zenith angle and in the short wavelengths (Figure 6).
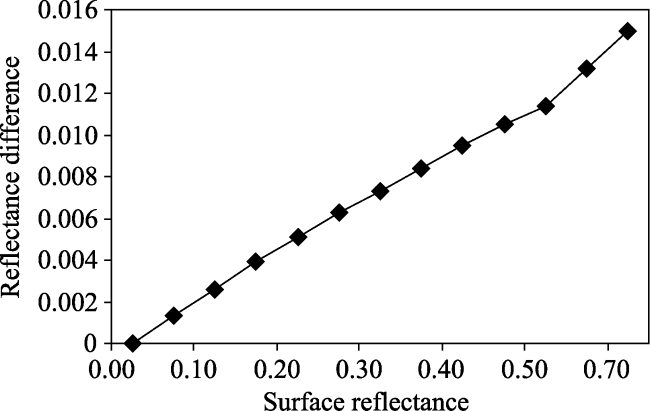
Figure 6 Reflectance difference caused by relative error of 2% TOA reflectance under different surface reflectance
(2) Atmospheric parameters assumption
Because of the complication of aerosol sources and atmospheric composition, accurate determination of aerosol models is very difficult. Northern mid-latitude summer and winter atmospheric models and four aerosol models in 6S were chosen to construct the LUT and were applied in land surface reflectance estimation. The difference of vapor content between the real atmosphere and the atmospheric models in 6S can lead to significant surface reflectance errors for the near infrared band. Optical parameters such as scattering phase function and single scattering albedo are different in different aerosol models and can cause certain errors in land surface estimation for each band of HJ-1 A/B CCD.
(3) Gaseous absorption and adjacency effect
Errors caused by uncertainties in gaseous absorption are found to be less than 0.005 in reflectance units for a surface reflectance of 0.05 by Fraser et al. (1992). The adjacency effect correction gives an approximation to the exact solution in the case of homogeneous background. Application of the correction to SPOT data for a target with reflectance of 0.2 surrounded by dark background reduces the error from adjacency effect at 550 nm from 0.005 to less than 0.001 in reflectance units (Vermote, 1990). Because the pixel size of HJ-1A/1B CCD is larger than that of SPOT, we can expect the errors from this effect to be smaller and the values of estimated land surface reflectance to be better.
(4) The look-up table interpolation
The look-up table is created with the 6S code to supply the needed parameters for a variety of sun-view geometries and aerosol loadings. The look-up table consisted of values related to 9 solar zenith angles, 13 view angles, 19 azimuthal angles, and 10 AOD values. Similar look-up table described in Fraser et al. (1989) reported that errors in the derived surface reflectance resulting from interpolation between entries in the look-up table were large only when either sun angle or view angle was extreme large (e.g larger than 70°). Uncertainty caused by interpolation from the look-up table was found to cause errors in the corrected reflectance of less than 0.005 for surface reflectance of 0.05 (Fraser et al., 1989; Fraser et al., 1992). For HJ-1A/1B CCD, the maximum view angle is less than 40°, thus the error should be much less.
(5) Other factors
Besides the factors mentioned above, other factors influencing the accuracy of HJ-1 A/B CCD surface reflectance retrieval include the Bi-directional reflectance function (BRDF), cloud screening, and systematic sensor errors, etc.

5 Conclusions

This study focused on the retrieval of land surface reflectance from HJ-1 A/B CCD data. The results are summarized as follows:
(1) A method of atmospheric correction was presented for calculating land surface reflectance from HJ-1 A/B CCD data. In this method, we used MODIS surface reflectance products as a prior knowledge to support the HJ-1 A/B CCD data to derive aerosol optical depth, based on the relationships between blue and red bands over dense vegetation areas.
(2) Pre-calculated look-up table providing three atmospheric correction coefficients is established. It can be used to calculate the land surface reflectance under different observation conditions and atmospheric conditions.
(3) Images of three different areas were selected to validate the proposed AOD estimation method in this study. Aerosol optical depth and land surface reflectance results were compared with ground measurements and MODIS products, and the results indicate that both the aerosol optical depth and the land surface reflectance can meet requirements.

The authors have declared that no competing interests exist.

1
Berk A, Bernstein L S, Robertson D C, 1989. MODTRAN: A moderate resolution model for LOWTRAN7, Report GL-TR-89-0122, Air Force Geophys. Lab, Bedford, MA.

2
Bréon F M, Deuzé J L, Tanré D, 1997. Validation of space borne estimates of aerosol loading from sun photometer measurements with emphasis on polarization.Journal of Geophysical Research, 102: 17187-17195.

3
Durkee P A, Pfeil F, Frost Eet al., 2006. Global analysis of aerosol particle characteristics.Atmos. Env., 25(11): 2457-2471.

4
Haan J F de, Hovenier J W, Kokke J M Met al.,1991. Removal of atmospheric influences on satellite borne imagery: A radiative transfer approach.Remote Sensing of Environment, 37: 1-21.

5
Hadjimitsis D G, Clayton C R I, Retails A, 2009. The use of selected pseudo-invarient targets for the application of atmospheric correction in multi-temporal studies using satellite remotely sensed imagery.International Journal of Applied Earth Observation and Geoinformation, 11(3): 192-200.

6
Hagolle O, Dedieu G, Mougenot Bet al., 2008.Correction of aerosol effects on multi-temporal images acquired with constant viewing angles: Application to Formosat-2 images.Remote Sensing of Environment, 112: 1689-1701.

7
Higurashi A, Nakajima T, 1999. Development of a two channel aerosol retrieval algorithm on global scale using NOAA/AVHRR. Journal of the Atmospheric Science, 56(7): 924-941.

8
Holben B N, Tanre D, Smirnov Aet al., 2001. An emerging ground-based aerosol climatology: Aerosol optical depth from AERONET. Journal of Geophysical Research:Atmospheres, 106(D11): 12067-12097.

9
Holben B N, Vermote E, Kaufman Y Jet al., 1992. Aerosol retrieval over land from AVHRR data: Application for atmospheric correction.IEEE Trans. Geosci. Remote Sens., 30: 212-222.

10
Holben B N, Vermote E, Kaufman Y Jet al., 1998. AERONET: A federated instrument network and data archive for aerosol characterization.Remote Sensing of Environment, 66(1): 1-16.

11
Husar R B, Prospero J M, Stowe L L, 1997. Characterization of tropospheric aerosols over the oceans with the NOAA advanced very high resolution radiometer optical depth operational product. J. Geophys. Res., 102(D14): 16,889-16,909.

12
Isaacs R G, Vogelmann A M, 1988. Multispectral sensor data simulation modeling based on the multiple scattering LOWTRAN code. Remote Sensing of Environment, 26(1): 75-99.

13
Kaufman Y J, 1993. Measurements of the aerosol optical thickness and the path radiance: Implications on aerosol remote sensing and atmospheric corrections.J. Geophys. Res., 98: 2677-2692.

14
Kaufman Y J, Sendra C, 1988. Algorithm for automatic atmospheric corrections to visible and near-IR satellite imagery.Int. J. Remote Sensing, 9(8): 1357-1381.

15
Kaufman Y J, Wald A E, Remer L Aet al., 1997. The MODIS 2.1-µm channel - correlation with visible reflectance for use in remote sensing of aerosol. IEEE Transactions on Geoscience and Remote Sensing, 35(5): 1286-1298.

16
Kokhanovsky A A, Breon F M, Cacciari Aet al., 2007. Aerosol remote sensing over land: A comparison of satellite retrievals using different algorithms and instruments.Atmos. Research, 85: 372-394.

17
Levy R C, Remer L A, Mattoo Set al., 2007. Second-generation operational algorithm: Retrieval of aerosol properties over land from inversion of moderate resolution imaging spectroradiometer spectral reflectance. Journal of Geophysical Research:Atmospheres, 112(D13): 1984-2012.

18
Liang S L, Fang H L, Chen M Zet al., 2001. Atmospheric correction of landsat ETM+ land surface Imagery (Part I): Methods.IEEE Transactions on Geoscience and Remote Sensing, 39(11): 2490-2498.

19
Moran M S, Jackson R D, Salter P Net al., 1992. Evaluation of simplified procedures for retrieval of land surface reflectance factors from satellite sensor output.Remote Sensing of Environment, 41: 169-184.

20
Remer L A, Tanre D, Kaufman Y J, 2006. MODIS ATBD: Algorithm for remote sensing of tropospheric aerosol from MODIS. Collection5. Product ID: MOD04/MYD04-C005, 3-20.

21
Richter R, 1996. A fast atmospheric correction algorithm applied to Landsat TM images.International Journal of Remote Sensing, 11: 159-166.

22
Smith H J P, Dube D J, Gardner M Eet al., 1987. FASCODE - Fast Atmospheric Signature Code (Spectral Transmittance and Radiance). Air Force Geophysics Laboratory, AFGL-TR-78-0081.

23
Sun L, Sun C K, Liu Q Het al., 2010. Aerosol optical depth retrieval by HJ-1/CCD supported by MODIS surface reflectance data.Science China Earth Science, 53(suppl.1): 74-80.

24
Vermote E, Tanre D, Deuze J Let al., 2006. Second simulation of a satellite signal in the solar spectrum-vector (6SV).IEEE Trans Geosci Remote Sens., 1-243.

25
Vermote E F, Vermeulen A, 1999. Atmospheric correction algorithm: Spectral reflectances (MOD09) Version 4.0. USA: NASA contract NAS5-96062.

26
Wang Q, Wu C Q, Li Q, 2010. Environment Satellite 1 and its application in the environmental monitoring. Journal of Remote Sensing, 14(1): 104-121.

Outlines

/