Research Articles

Spatial and temporal distribution of large volcanic eruptions from 1750 to 2010

  • HAO Zhixin , 1 ,
  • WANG Huan 1, 2 ,
  • ZHENG Jingyun , 1, *
Expand
  • 1. Key Laboratory of Land Surface Pattern and Simulation, Institute of Geographic Sciences and Natural Resources Research, CAS, Beijing 100101, China
  • 2. University of Chinese Academy of Sciences, Beijing 100049, China

*Corresponding author: Zheng Jingyun (1966-), specialized in climate change. E-mail:

Author: Hao Zhixin (1975-), specialized in climate change. E-mail:

Received date: 2014-03-31

  Accepted date: 2014-05-09

  Online published: 2014-06-20

Supported by

National Natural Science Foundation of China, No.41430528.Strategic Priority Research Program of the Chinese Academy of Sciences, No.XDA05080100.China Global Change Research Program, No.2010CB950100.Jiangsu Collaborative Innovation Center for Climate Change

Copyright

Journal of Geographical Sciences, All Rights Reserved

Abstract

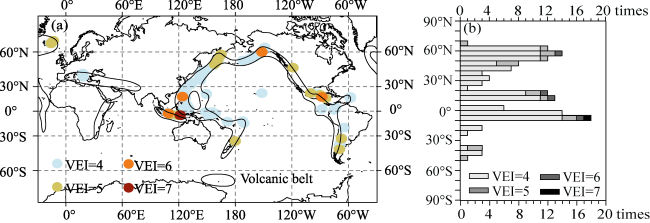
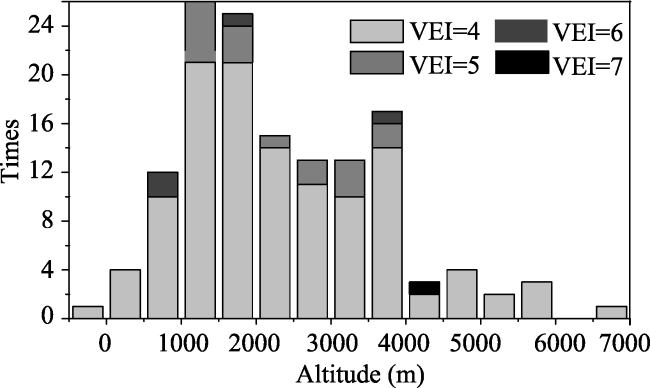
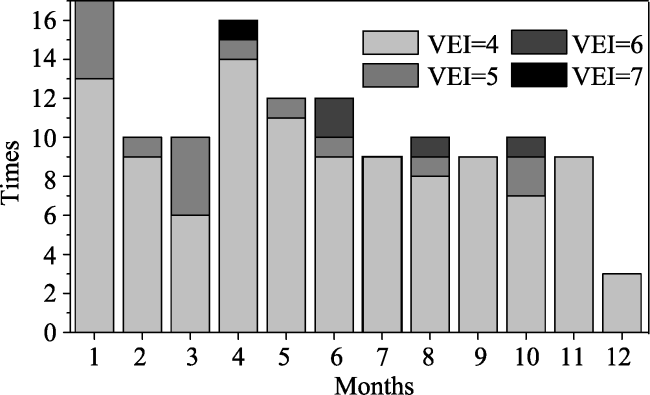
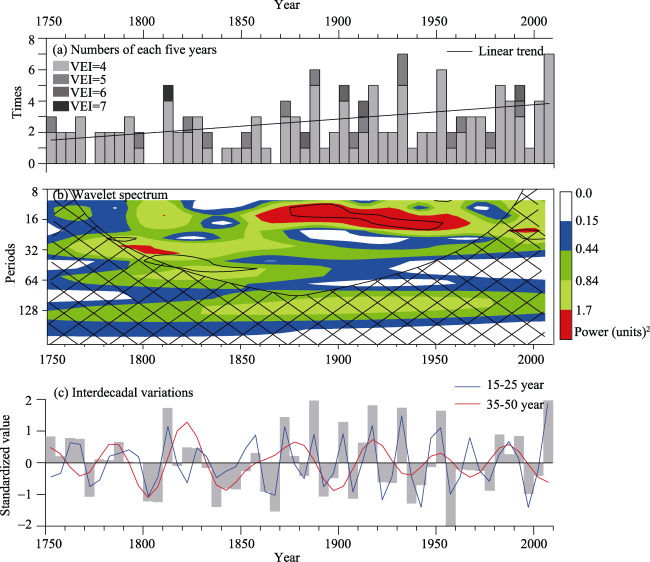
Using the dataset provided by the Smithsonian Institution’s Global Volcanism Program, we have extracted the large volcanic eruptions (volcanic explosivity index ≥ 4) from the period 1750-2010 and have then analyzed the main characteristics of large volcanic eruptions since 1750 according to their geographic latitudes, their elevations, and the years and months in which they occurred. The results show that most large volcanic eruptions were located around the margins of the Pacific Ocean and the islands of Sumatra and Java, especially in the equatorial regions (10°N-10°S). Large volcanic eruptions were concentrated at 1000-2000 m elevations and in the months of January and April. There were more eruptions in the summer half-year (from April to September) than in the winter half-year (from October to the next March). Large volcanic eruptions have interdecadal fluctuations, including cycles of 15-25 years and 35-50 years, which were detected by Morlet wavelet analysis, with the fluctuations being more frequent after 1870 than before. During the periods 1750-1760, 1776-1795, 1811-1830, 1871-1890, 1911-1920 and 1981-1995, there were relatively many large volcanic eruptions.

Cite this article

HAO Zhixin , WANG Huan , ZHENG Jingyun . Spatial and temporal distribution of large volcanic eruptions from 1750 to 2010[J]. Journal of Geographical Sciences, 2014 , 24(6) : 1060 -1068 . DOI: 10.1007/s11442-014-1138-7

1 Introduction

Volcanism is one of the important natural forcing mechanisms for climate change on interannual-interdecadal time scales, and its effects on climate have attracted much attention as a significant scientific problem in the field of global climate change. Some published studies (Robock, 2000; Robock et al., 2009) have shown that large volcanic eruptions with volcanic explosivity index (VEI) ≥ 4 (Newhall et al., 1982) have blasted large quantities of gases and tephra into the air, with the formation of a persistent layer containing sulfate aerosols at the bottom of the stratosphere. This leads to an increase in albedo and a reduction in direct solar radiation, which together cause a cooling effect on the land surface and a heating effect on the stratosphere. At the same time, this can alter the chemical composition of the stratosphere and cause abnormal photochemical processes. Furthermore, it can change the balance of SO2, CO2, H2S, CH4 and tiny solid particles in the air, with a further influence on regional and even global climate (Qian et al., 1994; Li, 2000). Hemispheric or global average temperature has been reduced by about 0.3 °C within 1-2 years after a large volcanic eruption, gradually falling back to normal over the following 4-5 years (Li, 2000; Li et al., 1996). The accumulated effects of successive large volcanic eruptions have even led to continuous cooling (Li et al., 1996).
The climate of China has also been significantly affected by large volcanic eruptions. For example, a summer cold disaster occurred over the lower reaches of the Yangtze River and the region from Northeast China to Inner Mongolia in 1992 after the 1991 Mount Pinatubo eruption (VEI = 6) in the Philippines (Xiao et al., 2011). The Mount Tambora eruption (VEI = 7) in Indonesia in 1815 also caused an obvious cooling over most regions of China from 1815 to 1817 (Yang et al., 2005). During the past 500 years, three persistent extreme drought events (1586-1589, 1638-1641 and 1965-1966) in the eastern monsoon region of China have also been linked with large volcanic eruptions (Shen et al., 2007).
Regional climate variations have been highly correlated with the VEI scale and the seasons and latitudes at which volcanic eruptions occurred, thus, analysis of the temporal and spatial characteristics of large volcanic eruptions worldwide is very important for further understanding of regional climate effects (Shen et al., 2007). Researchers have identified the 13 largest volcanic eruptions during the past 260 years from events in the historical records. Various effects of eruptions, including reductions in surface net radiation and the diurnal temperature range, global summer cooling, stratospheric warming and high-latitude winter warming, have been explored in the scientific literature (Oman et al., 2006). The characteristics of large volcanic pyroclastics (Gooding et al., 1983; Bluth et al., 2004) and the risks of volcanic disasters (Connor et al., 2001) have been analyzed. However, owing to a lack of records, studies of the temporal and spatial characteristics of large volcanic eruptions over history are still rare. Therefore, to provide basic data for further study of regional differences in climate change in China forced by volcanic activity and their driving mechanism, we have analyzed the temporal and spatial characteristics of large volcanic eruptions in the period 1750-2010 according to the latest data on worldwide Holocene volcanic activities and eruptions released by the Smithsonian Institution’s Global Volcanism Program (http://www.volcano.si.edu/index.cfm).

2 Data and methods

It is known that during the last 10,000 years there have been about 1500 volcanoes (Simkin et al., 1994), with about 80% of these being located at convergent plate boundaries (Zhang, 2011). Data for this research are derived from the Holocene large volcanic eruption chronology collected and organized by the Smithsonian Institution (http://volcano.si.edu/ search_eruption.cfm). The chronology includes 716 large volcanic eruptions from 9650 BC to AD 2010, together with detailed information on location (longitude, latitude and elevation), starting and ending dates (eruptive activity), tephra volume, and VEI for each eruption. The VEI is determined by the eruption type and duration, the tephra volume, and the height of the eruption cloud column (Table 1). In this paper, VEI≥ 4 defines a large volcanic eruption and VEI ≥ 5 defines a very large volcanic eruption.
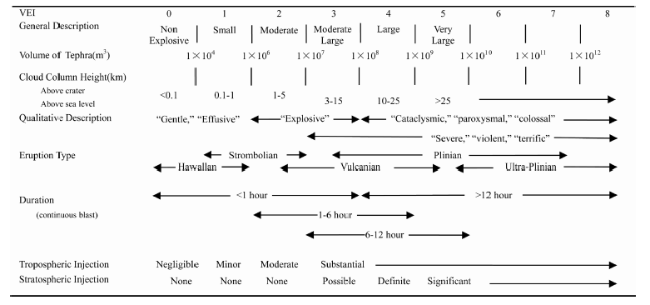
Table 1 Definition of VEI (from http://volcano.si.edu/search_eruption.cfm)
In this dataset, except for recent eruptions for which direct records exist, events (especially before 1750) were dated by anthropology, dendrochronology, tephrochronology, ice cores, varved lake sediments, 14C isotope, lichenometry, surface exposure fission track, hydration rind, potassium-argon, 40Ar/39Ar, magnetism, thermoluminescence, the uranium series, and the submarine hydrophone detection method. These records are therefore subject to dating errors by year, month or date. Therefore, in this paper, we use records after 1750 to analyze the temporal and spatial characteristics of global large volcanic eruptions. The method is introduced as followed: we first classify the 139 global large volcanic eruptions in the period 1750-2010 according to geographic latitude, eruption season, VEI, etc., and we then use wavelet analysis to explore the interdecadal variation characteristics of large volcanic eruptions.

3 Results

3.1 Spatial characteristics of large volcanic eruptions

Figure 1 shows the geographic locations of 139 large volcanic eruptions in 1750-2010 and the variation of occurrence number with latitude. It can be seen that the greatest number of large volcanic eruptions occurred in the circum-Pacific belt and Indonesia, New Guinea and the Philippines around the equatorial region. Of these eruptions, 110 (about 80% of the total) occurred in the circum-Pacific volcanic belt, 15 in the Sumatra-Java volcanic belt located in the equatorial region, 2 in the Mediterranean volcanic belt and 11 in the mid-Atlantic ridge volcanic belt. In particular, of the 21 very large volcanic eruptions (VEI ≥ 5), 15 occurred in the circum-Pacific volcanic belt, 4 in the Sumatra-Java volcanic belt and 2 in the mid-Atlantic ridge volcanic belt.
Figure 1 Spatial distributions of large volcanic eruptions from 1750 to 2010 (a), and variation of the number of volcanic eruptions with latitude (b). Volcanic zones were plotted based on a map of volcanic activities from the US Geological Survey.
From the variations in the number of eruptions with latitude (for each 5° of latitude) (Figure 1b), we can see that most of the large volcanic eruptions occurred in the equatorial region, followed by mid-high latitudes in the Northern Hemisphere. Overall, more eruptions occurred in the Northern Hemisphere than in the Southern Hemisphere.
In the Northern Hemisphere, there were 38 large volcanic eruptions (27.34% of the total) in the equatorial region (10°N-10°S), of which 25 occurred in the circum-Pacific volcanic belt and 13 in the Sumatra-Java volcanic belt. There were 29 eruptions (20.86% of the total) at low latitudes (10°N-30°N), all of which occurred in the circum-Pacific volcanic belt. There were 14 eruptions (10.07% of the total) at mid-low latitudes (30°N-45°N), of which 12 occurred in the circum-Pacific volcanic belt and 2 in the Mediterranean volcanic belt. There were 34 eruptions (24.46% of the total) at mid-high latitudes (45°N-60°N), all of which occurred in the circum-Pacific volcanic belt. There were 13 eruptions (9.35% of the total) at high latitudes (>60°N), of which 11 were in the mid-Atlantic ridge volcanic belt and 2 in the circum-Pacific volcanic belt.
In the Southern Hemisphere, there were 4 large volcanic eruptions (2.88% of the total) at low latitudes (10°S-30°S), of which 2 were in the circum-Pacific volcanic belt and 2 in the Sumatra-Java volcanic belt. There were 7 eruptions (5.04% of the total) at mid latitudes (30°S-60°S), all of which occurred in the circum-Pacific volcanic belt.
Of the 21 very large volcanic eruptions, one-third (7 eruptions) occurred at high latitudes in the Northern Hemisphere, all of which were concentrated in the circum-Pacific volcanic belt. There were 5 eruptions (23.81% of the total) at low latitudes in the Northern Hemisphere, all of which were in the circum-Pacific volcanic belt. There were 4 eruptions (19.05% of the total) in the equatorial region, all of which were in the Sumatra-Java volcanic belt. There were only 2 eruptions at high latitudes of the Northern Hemisphere, both of which were in the mid-Atlantic ridge volcanic belt. In the Southern Hemisphere, 3 very large volcanic eruptions (14.29% of the total) occurred at mid latitudes, all of which were in the circum-Pacific volcanic belt.
The variation of the occurrence number of large volcanic eruptions with elevation (for each 500 m) in the period 1750-2010 is plotted in Figure 2. It can be seen that 109 of the large volcanic eruptions (78.4% of the total) occurred at altitudes of 1000-4000 m, of which 26 were at 1000-1500 m and 25 at 1500-2000 m, accounting for 18.7% and 18.0% of the total, respectively. Of the very large volcanic eruptions, 18 (85.7% of the total) were at 1000-4000 m, with only 3 occurring at other altitudes.
Figure 2 Variation of the number of large volcanic eruptions with elevation from 1750 to 2010

3.2 Temporal characteristics of large volcanic eruptions

3.2.1 Distribution through the year
Figure 3 illustrates the distribution of 127 large volcanic eruptions by month over the past 260 years (there are 12 events for which the month of the explosion is unknown). There were significantly greater numbers of large volcanic eruptions in January and April than in other months: 16 and 17, respectively, accounting for 13.39% and 12.60% of the total. May and June took second place in this regard, with 12 eruptions (9.45% of the total). February, March, August and October each had 10 eruptions (7.87% of the total), and July, September and November each had 9 eruptions (7.09% of the total). There were only 3 large volcanic eruptions in December, accounting for just 2.36% of the total.
With regard to seasonal variations, there was a slightly greater number of large volcanic eruptions in the summer half-year (April to September) than in the winter half-year (October to the next March): 68 compared with 59. In the summer half-year, the number of large volcanic eruptions showed a gradually decreasing trend from April to September. In the winter half-year, there was an 11-fold difference between the month with the greatest number of eruptions (January) and the month with the least (December), with the other months having almost the same numbers of eruptions, with the exception of October, which had slightly more.
Figure 3 Variation of the number of large volcanic eruptions by month from 1750 to 2010
In contrast, the number of very large volcanic eruptions (VEI ≥ 5) in the winter half-year (12) was greater than that in the summer half-year (8). Of the winter eruptions, there were 4 (20% of the total) in each of January and March and 3 (15% of the total) in October. Only 1 very large eruption occurred in February and there were none in September, November or December. The greatest numbers of very large eruptions in the summer half-year were in June (3 eruptions, accounting for 15% of the total). There were 2 very large eruptions in each of April and August (10% of the total) and 1 in May (5% of the total). No very large volcanic eruptions occurred in July or September.
3.2.2 Changes at interannual-interdecadal time scale
It can be seen from Figure 4a that the number of large volcanic eruptions in each five-year interval in the period 1750-2010 shows a generally increasing trend. However, because the volcanic chronology was reconstructed from historical documents, with fewer records being available for the earlier part of the period, the increasing trend does not reflect an increasing number of large volcanic eruptions; rather, it is believed to represent increased reporting of eruptions from a greater number of observers, with a wider geographic distribution and better communications, as well as wider publication of results (http://www.volcano.si.edu/ faq.cfm). For this reason, after counting the numbers of large volcanic eruptions for each five-year interval from 1750 to 2010 (Figure 4a), we detrended the occurrence number sequence using a linear fitting curve with the least-squares method (Xie, 2006) and then analyzed the cycle and the phase changes of volcanic eruptions detected by Morlet wavelet analysis (Torrence et al., 1998) (Figure 4b). We extracted two main cycles at 15-25 years and 35-50 years based on the wavelet coefficients to draw curves showing the changes with time (Figure 4c, where positive values correspond to greater numbers of large volcanic eruptions for each five consecutive years and negative values correspond to fewer large volcanic eruptions). The results show that a cycle of 35-50 years for large volcanic eruptions prevailed before 1870, but was replaced by a cycle of 15-25 years after that (Figure 4b), meaning that large volcanic eruptions have been more frequent since 1870. On the 35-50-year time scale, large volcanic eruption events mainly occurred in 1750-1760, 1776-1795 and 1811-1830, with relatively few in 1761-1775, 1796-1810 and 1831-1860. On the 15-25-year time scale, large volcanic eruptions mainly occurred in 1871-1880, 1886-1890, 1901-1905, 1911-1920, 1946-1955, 1981-1995 and 2006-2010, but few in other periods.
Figure 4 Interannual-interdecadal variations of large volcanic eruptions from 1750 to 2010. (a) Numbers in each five-year interval and linear trend (note that the first interval is actually six years, being based on the period 1750-1755). (b) Wavelet spectrum, with the 90% confidence level circled by black contours and the cones of influence indicated by the cross-hatched region. (c) Detrended standardized series from (a) together with 15-25-year and 35-50-year cycles.

4 Discussion and conclusions

4.1 Discussion

Study of the statistical characteristics of large volcanic eruptions with regard to their distributions over geographic latitudes and through the year and with regard to their periodicity is of great importance for determining their role in driving global or regional extreme climate events (Zeng et al., 1995).
The year 1816 was called the “year without a summer” because of a sequence of abnormal weather events. There was excessive rainfall over the whole of Europe and persistent low summer temperatures (the average monthly temperature in the summer in London was 2-3 ºC lower than in normal years), with dramatic consequences for agriculture, including failed harvests. In the northeastern United States, there were storms and frost disasters in the summer, while in South Africa, the growing season was hit by cold and wet weather. This extremely cold summer on a global scale has been linked to the 1815 Tambora eruption in Indonesia (Stothers, 1984; Harington, 1992). Furthermore, reconstruction of the climate using the trees rings as proxy showed that the Laki eruption in 1783 led to the lowest summer temperature in northwest Alaska over the past 400 years and caused the great famine and reduced population of 1779-1791 (Jacoby et al., 1999). However, there exist significant differences in the ways in which volcanic eruptions influence winter and summer temperatures. For example, Robock and Mao (1992) selected the eight largest volcanic eruptions in the period 1883-1992 and found that there was an obvious increase in winter temperature in Eurasia and North America but a significant decrease in the Middle East up to 2 years after the events.
In contrast to these global considerations, there has been little research into regional climate effects of volcanic eruptions in China. In further work, the statistical results of this paper will be used to explore the relationships between the spatial distribution type of extreme climate events in China and volcanic eruptions.

4.2 Conclusions

From our analysis of the global chronology of large volcanic eruptions since 1750, the following conclusions can be drawn regarding the principal features of these events over the past 260 years:
(1) About 90% of the total number of large volcanic eruptions are accounted for by eruptions on the coasts of the Pacific (about 80%) and the islands of the Sumatra-Java volcanic belt (about 10%). Most large volcanic eruptions occurred in the equatorial region, followed by high latitudes in the Northern Hemisphere. There were significantly more in the Northern Hemisphere than in the Southern Hemisphere. In contrast, very large volcanic eruptions mainly occurred at high latitudes in the Northern Hemisphere, followed by low latitudes in the Northern Hemisphere and the equatorial region.
(2) Large volcanic eruptions were mainly concentrated at elevations of 1000-1500 m and 1000-2000 m.
(3) The greatest numbers of large volcanic eruptions occurred in January and April, with each month accounting for more than 12% of the total, and the number in the summer half-year (from April to September) was slightly higher than that in the winter half-year (October to the following March). In contrast, the number of very large volcanic eruptions was clearly higher in the winter half-year than in the summer half-year.
(4) The year 1870 was the shift point of the cycle change for large volcanic eruptions since 1750. A cycle of 35-50 years was dominant before 1870, but a cycle of 15-25 years prevailed after that. Large volcanic eruptions mainly occurred in 1750-1760, 1776-1795, 1760-1830, 1871-1890, 1911-1920 and 1911-1995, with fewer in other periods.

The authors have declared that no competing interests exist.

1
Bluth G J S, Rose W I, 2004. Removal processes of volcanic ash particles from the atmosphere. In: Proceedings, 2nd International Conference on Volcanic Ash and Aviation Safety. Office of the Federal Coordinator for Meteorology (OFCM), Washington, DC. 51-54.

2
Connor C B, Hill B E, Winfrey Bet al., 2001. Estimation of volcanic hazards from tephra fallout.Natural Hazards Review, 2(1): 33-42.

3
Gooding J L, Clanton U S, Gabel E Met al., 1983. El Chichón volcanic ash in the stratosphere: Particle abundances and size distributions after the 1982 eruption.Geophysical Research Letters, 10(11): 1033-1036.

4
Harington C R, 1992. The year without a summer? World climate in 1816. Canadian Museum of Nature, Ottawa, 576 pp.

5
Jacoby G C, Workman K W, D’Arrigo R D, 1999. Laki eruption of 1783, tree rings, and disaster for northwest Alaska Inuit.Quaternary Science Reviews, 18(12): 1365-1371.

6
Li Ni, 2000. Gases disaster from volcano eruption.Journal of Natural Disasters, 9(2): 127-131. (in Chinese)

7
Li Xiaodong, Wang Shaowu, Liu Ruoxin, 1996. Advances in volcano-climatology.Seismological and Geomagnetic Observation Research, 4(17): 74-80. (in Chinese)

8
Newhall C G, Self S, 1982. The volcanic explosivity index (VEI): An estimate of explosive magnitude for historical eruptions.Journal of Geophisical Research, 87(C2): 1231-1238.

9
Oman L, Robock A, Stenchikov G Let al., 2006. High-latitude eruptions cast shadow over the African monsoon and the flow of the Nile.Geophysical Research Letters, 33(18): 1-5.

10
Qian Yongfu, Huang Yuanyuan, 1994. The effects of ozone, clouds and aerosols on the zonally average climate.Acta Geographica Sinica, 49(3): 266-274. (in Chinese)

11
Robock A, 2000. Volcanic eruptions and climate.Reviews of Geophysics, 38(2): 191-219.

12
Robock A, Mao J, 1992. Winter warming from large volcanic eruptions.Geophysical Research Letters, 19(24): 2405-2408.

13
Robock A, Marquardt A, Kravitz Bet al., 2009. Benefits, risks, and costs of stratospheric geoengineering.Geophysical Research Letters, 36(19): 1-9.

14
Shen Caiming, Wang Wei-Chyung, Hao Zhixinet al., 2007. Exceptional drought events over eastern China during the last five centuries.Climatic Change, 85(3/4): 453-471.

15
Simkin T, Siebert L, 1994. Volcanoes of the World. 2nd ed. Tucson: Geoscience Press, 1-368.

16
Stothers R B, 1984. The great Tambora eruption in 1815 and its aftermath.Science, 224(4654): 1191.

17
Torrence C, Compo G P, 1998. A Practical Guide to Wavelet Analysis.Bulletin of the American Meteorological society, 79(1): 61-78.

18
Xiao Dong, Li Jianping, 2011. Mechanism of stratospheric decadal abrupt cooling in the early 1990s as influenced by the Pinatubo eruption.Chinese Science Bulletin, 56(4/5): 333-341. (in Chinese)

19
Xie Tongxin, 2006. Straight line fitted by minimum two multiplications.Journal of Beijing Polytechnic College, 5(3): 5-7. (in Chinese)

20
Yang Yuda, Man Zhimin, Zheng Jingyun, 2005. A serious famine in Yunnan (1815-1817) and the eruption of Tambola Volcano. Fudan Journal (Social Sciences Edition), (1): 79-85. (in Chinese)

21
Zeng Zhaomei, Zhang Mingli, Ji Jinjun, 1995. The patterns of the temperature and sea level pressure in various cold and warm periods within recent 100 years.Acta Geographica Sinica, 50(2): 149-159. (in Chinese)

22
Zhang Yingjie, 2011. Plate tectonic and geological processes.Science & Technology Information, (31): 817. (in Chinese)

Outlines

/