
Journal of Geographical Sciences >
Spatial-temporal patterns of vegetation dynamics and their relationships to climate variations in Qinghai Lake Basin using MODIS time-series data
*Corresponding author: Li Shuheng, PhD, E-mail: lish@nwu.edu.cn
Author: Guo Wei, PhD, specialized in physical geography. E-mail: williamguo@xjtu.edu.cn
Received date: 2013-10-08
Accepted date: 2014-07-10
Online published: 2014-06-20
Supported by
National Science & Technology Support Program, No.2012BAH31B03.National Natural Science Foundation of China, No.41301007.No.40901101.The Fundamental Research Funds for the Central Universities, No.xjj2013079
Copyright
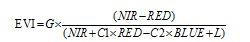
Global warming has led to significant vegetation changes in recent years. It is necessary to investigate the effects of climatic variations (temperature and precipitation) on vegetation changes for a better understanding of acclimation to climatic change. In this paper, we focused on the integration and application of multi-methods and spatial analysis techniques in GIS to study the spatio-temporal variation of vegetation dynamics and to explore the vegetation change mechanism. The correlations between EVI and climate factors at different time scales were calculated for each pixel including monthly, seasonal and annual scales respectively in Qinghai Lake Basin from the year of 2001 to 2012. The primary objectives of this study are to reveal when, where and why the vegetation change so as to support better understanding of terrestrial response to global change as well as the useful information and techniques for wise regional ecosystem management practices. The main conclusions are as follows: (1) Overall vegetation EVI in the region increased 6% during recent 12 years. The EVI value in growing seasons (i.e. spring and summer) exhibited very significant improving trend, accounted for 12.8% and 9.3% respectively. The spatial pattern of EVI showed obvious spatial heterogeneity which was consistent with hydrothermal condition. In general, the vegetation coverage improved in most parts of the area since nearly 78% pixel of the whole basin showed increasing trend, while degraded slightly in a small part of the area only. (2) The EVI change was positively correlated with average temperature and precipitation. Generally speaking, in Qinghai Lake Basin, precipitation was the dominant driving factor for vegetation growth; however, at different time scale its weight to vegetation has differences. (3) Based on geo-statistical analysis, the autumn precipitation has a strong correlation with the next spring EVI values in the whole region. This findings explore the autumn precipitation is an important indicator, and then, limits the plant growth of next spring.
Key words: Qinghai Lake Basin; EVI; precipitation; temperature; correlation analysis
GUO Wei , NI Xiangnan , JING Duanyang , LI Shuheng . Spatial-temporal patterns of vegetation dynamics and their relationships to climate variations in Qinghai Lake Basin using MODIS time-series data[J]. Journal of Geographical Sciences, 2014 , 24(6) : 1009 -1021 . DOI: 10.1007/s11442-014-1134-y
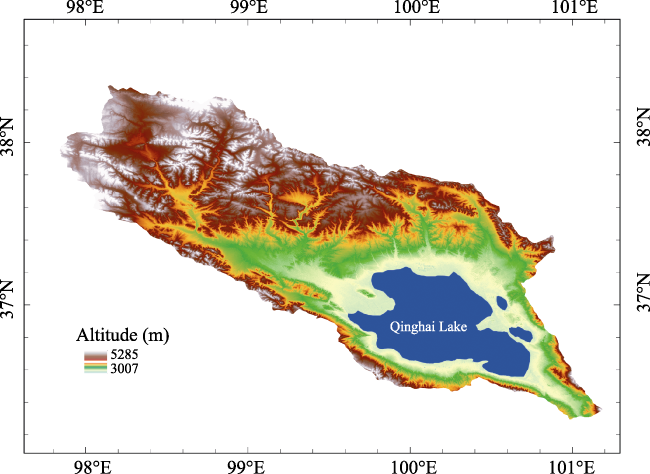
Figure 1 Map of the Qinghai Lake Basin |
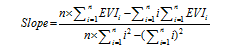
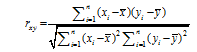
 is the average vegetation index for all years/month;
  is the average temperature or precipitation for all years/month (Xu, 2002; Mu et al., 2013).
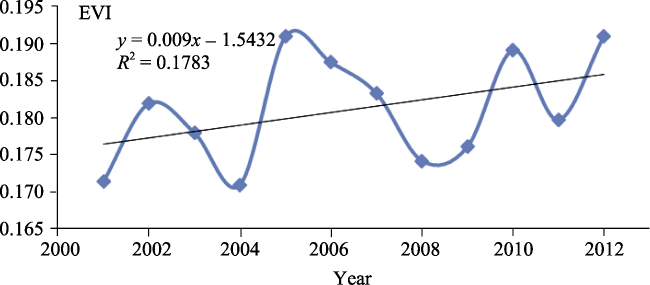
Figure 2 Variation of annual EVI of the Qinghai Lake Basin during 2001 to 2012 |
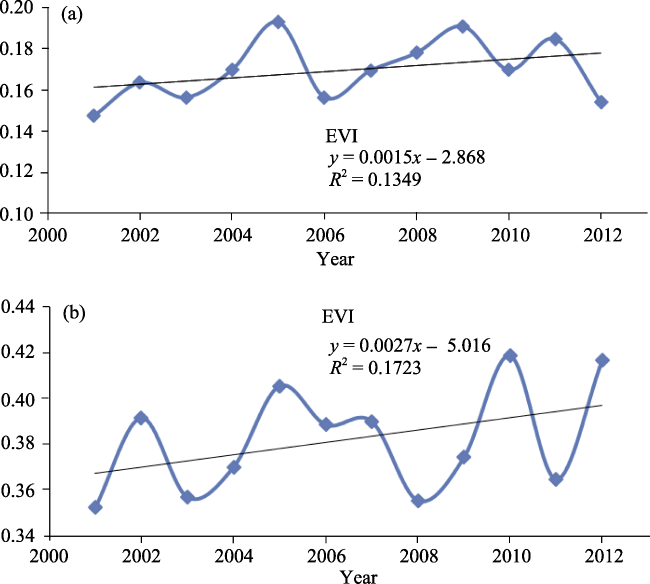
Figure 3 EVI change tendency in spring (a) and summer (b) from 2001 to 2012 |
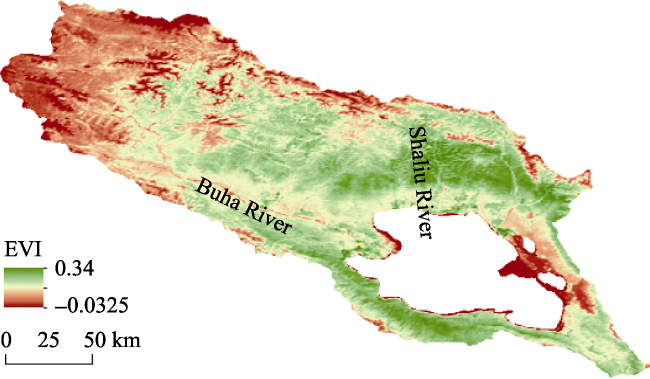
Figure 4 Spatial pattern of annual mean EVI from 2001 to 2012 |
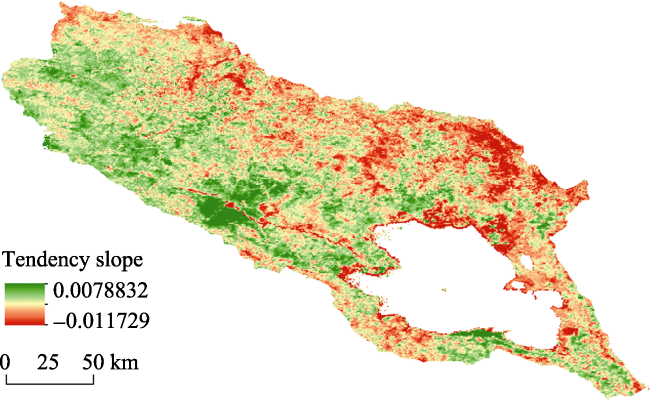
Figure 5 Spatial pattern of EVI change tendency |
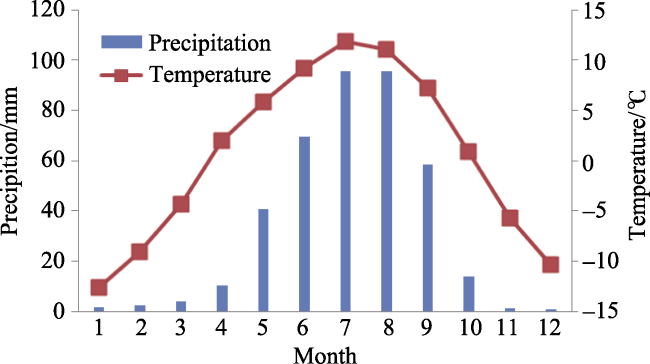
Figure 7 Monthly climatic factors variation pattern |
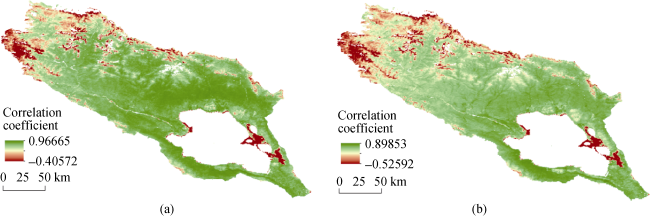
Figure 6 Correlations between annual EVI and climate factors in the Qinghai Lake Basin during 2001-2012 (a. with annual precipitation; b. with annual mean temperature) |
Figure 8 Correlations between monthly EVI and climate factors of current month in the Qinghai Lake Basin during 2001-2012 (a. with annual precipitation; b. with annual mean temperature) |
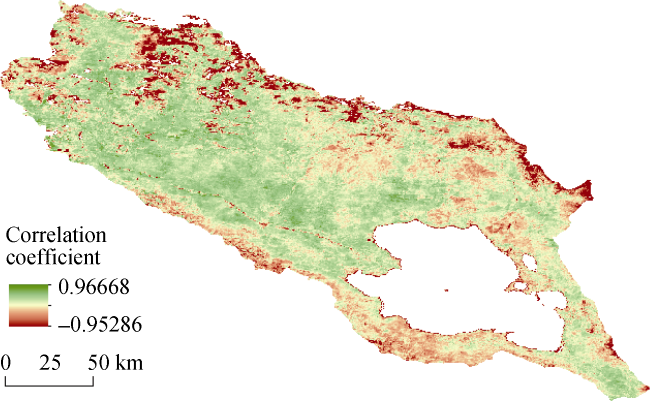
Figure 9 Correlations between autumn precipitation and next spring EVI value from 2001 to 2012 |
The authors have declared that no competing interests exist.
| 1 |
|
| 2 |
|
| 3 |
|
| 4 |
|
| 5 |
|
| 6 |
|
| 7 |
|
| 8 |
|
| 9 |
|
| 10 |
|
| 11 |
|
| 12 |
|
| 13 |
|
| 14 |
|
| 15 |
|
| 16 |
|
| 17 |
|
| 18 |
|
| 19 |
|
| 20 |
|
| 21 |
|
| 22 |
|
| 23 |
|
| 24 |
|
| 25 |
|
| 26 |
|
| 27 |
|
| 28 |
|
| 29 |
|
| 30 |
|
| 31 |
|
| 32 |
|
| 33 |
|
| 34 |
|
| 35 |
|
| 36 |
|
| 37 |
|
| 38 |
|
| 39 |
|
| 40 |
|
| 41 |
|
/
| 〈 |
|
〉 |
