Research Articles

Inter-annual variations in vegetation and their response to climatic factors in the upper catchments of the Yellow River from 2000 to 2010

  • CAO Ran , 1, 2 ,
  • JIANG Weiguo , 1, 2 ,
  • YUAN Lihua 1, 2 ,
  • WANG Wenjie 3 ,
  • LV Zhongliang 4 ,
  • CHEN Zheng 1, 2
Expand
  • 1. State Key Laboratory of Earth Surface Processes and Resource Ecology, Beijing Normal University, Beijing 100875, China
  • 2. Key Laboratory of Environmental Change and Natural Disaster, Beijing Normal University, Beijing 100875, China
  • 3. Chinese Research Academy of Environmental Sciences, Beijing 100012, China
  • 4. National Meteorological Center of CMA, Beijing 100081, China

*Corresponding author: , PhD, E-mail:

Author: Cao Ran (1990-), Graduate Student, specialized in ecological remote sensing and natural hazard and risk analysis. E-mail: .

Received date: 2014-05-30

  Accepted date: 2014-07-10

  Online published: 2014-06-20

Supported by

National Natural Science Foundation of China, No.41171318.National Key Technology Support Program, No.2012BAH32B03.No.2012BAH33B05.The Remote Sensing Investigation and Assessment Project for Decade-Change of the National Ecological Environment (2000-2010)

Copyright

Journal of Geographical Sciences, All Rights Reserved

Abstract

To understand the variations in vegetation and their correlation with climate factors in the upper catchments of the Yellow River, China, Normalized Difference Vegetation Index (NDVI) time series data from 2000 to 2010 were collected based on the MOD13Q1 product. The coefficient of variation, Theil-Sen median trend analysis and the Mann-Kendall test were combined to investigate the volatility characteristic and trend characteristic of the vegetation. Climate data sets were then used to analyze the correlation between variations in vegetation and climate change. In terms of the temporal variations, the vegetation in this study area improved slightly from 2000 to 2010, although the volatility characteristic was larger in 2000-2005 than in 2006-2010. In terms of the spatial variation, vegetation which is relatively stable and has a significantly increasing trend accounts for the largest part of the study area. Its spatial distribution is highly correlated with altitude, which ranges from about 2000 to 3000 m in this area. Highly fluctuating vegetation and vegetation which showed a significantly decreasing trend were mostly distributed around the reservoirs and in the reaches of the river with hydropower developments. Vegetation with a relatively stable and significantly decreasing trend and vegetation with a highly fluctuating and significantly increasing trend are widely dispersed. With respect to the response of vegetation to climate change, about 20-30% of the vegetation has a significant correlation with climatic factors and the correlations in most areas are positive: regions with precipitation as the key influencing factor account for more than 10% of the area; regions with temperature as the key influencing factor account for less than 10% of the area; and regions with precipitation and temperature as the key influencing factors together account for about 5% of the total area. More than 70% of the vegetation has an insignificant correlation with climatic factors.

Cite this article

CAO Ran , JIANG Weiguo , YUAN Lihua , WANG Wenjie , LV Zhongliang , CHEN Zheng . Inter-annual variations in vegetation and their response to climatic factors in the upper catchments of the Yellow River from 2000 to 2010[J]. Journal of Geographical Sciences, 2014 , 24(6) : 963 -979 . DOI: 10.1007/s11442-014-1131-1

1 Introduction

Terrestrial vegetation is an important indicator in the evaluation of the terrestrial ecological environment and plays a leading part in the maintenance of balance in ecosystems (Tucker et al., 1986; Sun et al., 1988; Fan et al., 2012). As a result of global climate change and intense human activity, the spatio-temporal variations in vegetation are showing significant changes (Xu et al., 2011; Li et al., 2013; Yin et al., 2014). It is therefore important to monitor dynamic changes in vegetation and to investigate the factors that are driving these changes in order to guide regional environmental management (Kawabata et al., 2001). As a result of recent developments in remote sensing, serial remote sensing images are now easy to collect over long time periods and have become important sources of data for monitoring dynamic changes in vegetation. Data from sensors such as NOAA/AVHRR, SPOT/VGT and MODIS have been widely used in previous studies (Li H X et al., 2011; Li et al., 2012; Nie et al., 2012; Yang et al., 2012; Mu et al., 2013). And for this study, instead of NOAA/AVHRR and SPOT/VGT, MOD13Q1 data were chosen because they have advantages on spatial and temporal resolution and provide more precise information of the land surface. Due to its high correlation with vegetation coverage, biomass, leaf area index and net primary production (Baret and Guyot, 1991; Gutman and Ignatov, 1998), the Normalized Difference Vegetation Index (NDVI) is the most common indicator used to reflect the growth status of vegetation (Sun et al., 1988; Santin-Janin et al., 2009). NDVI time series are therefore the most important data sets for monitoring dynamic changes in vegetation.
Much research has been published about monitoring vegetation dynamics on global, national and regional scales. Kawabata et al. (2001) analyzed inter-annual trends on a global scale from 1982 to 1990 and investigated the effects of climate on inter-annual variations. Zhang et al. (2014) detected inter-annual variations and trends in global land surface phenology from 1982 to 2010. Li et al. (2013) detected variations in vegetation activity at a national scale for China. Hao et al. (2012) investigated the inter-annual and monthly relationships between NDVI for grasslands and forests with climatic variables in the upper reaches of the Yellow River.
These previous studies have shown that two characteristics of variations in vegetation can be extracted from the NDVI time series. First, the volatility characteristic reflects the fluctuation in the amount of vegetation over time. The coefficient of variation is the indicator most widely used to measure the degree of fluctuation (Tucker et al., 1991). Milich and Weiss (2000) identified desertification in the Sahel area by analyzing the relations between the coefficient of variation and vegetation coverage. Secondly, the trend characteristic reflects whether vegetation is degraded or restored over time. The correlation coefficient between NDVI and the corresponding time and linear regressions are commonly used to investigate the trend characteristic (Piao and Fang, 2001; Zhang et al., 2008; Jiang et al., 2011; Song et al., 2011). Unfortunately, this method is easily affected by outliers (Neeti and Eastman, 2011). The Theil-Sen trend analysis and Mann-Kendall test method have been proved to be more robust in exploring significant trends in changes in vegetation (Pouliot et al., 2009; Fensholt et al., 2012; Hou et al., 2012; Wang et al., 2013; Fuller and Wang, 2014). However, few studies have combined these two aspects to understand the characteristics of variations in vegetation, especially on the pixel scale, which is intuitively easier to understand for decision-maker (Yuan et al., 2013).
Much of the research on the driving factors of variations in vegetation show that climatic factors, especially precipitation and temperature, have a significant correlation with dynamic changes in vegetation (Li H X et al., 2011; Li et al., 2012; Wu et al., 2014). However, the correlation of vegetation with climatic factors is also dependent on the type of vegetation, the soil type, soil moisture level, altitude and other factors (Sun et al., 1988; Chuai et al., 2013). In addition, human activities may be the key factors influencing local vegetation dynamics rather than climatic factors. Therefore it is important to investigate the spatial heterogeneity of the response of vegetation to climate change. The response of vegetation to climate change has been widely studied using correlation analysis (Ma et al., 2006; Zhong et al., 2010). Zhang et al. (2003) used a simple correlation coefficient to determine the main influencing factor and used a partial correlation coefficient to investigate the degree of influence of each individual factor. Mao et al. (2011) investigated the relationship between NDVI and climate change and changes in land use/land cover using a simple correlation coefficient and a partial correlation coefficient. Correlation analysis is therefore a common and effective way of investigating the relations between variations in vegetation and climate change.
In this work, the NDVI time series data from 2000 to 2010 were collected based on MOD13Q1 data at a resolution of 250 m. The coefficient of variation, Theil-Sen median trend analysis and the Mann-Kendall test were combined to investigate the volatility characteristic and trend characteristic of vegetation over this time period. Climate data, land use/land cover data and information on hydropower development were then added to analyze the factors influencing the inter-annual changes in vegetation in the Longyangxia-Liujiaxia (Long-Liu) basin of the Yellow River, China.

2 Materials and methods

2.1 Study area

The Long-Liu Basin is located in the upper catchment of the Yellow River from 100.06°E to 103.54°E and from 35.18°N to 36.47°N (Figure 1). The main stream of the Yellow River flows through this basin with a length of 469.3 km, starting upstream of the Longyangxia Reservoir and ending downstream of the Liujiaxia Reservoir. The basin covers a total area of 25,094 km2. The geographical location of the Long-Liu Basin is at the junction of the Tibetan Plateau and the Loess Plateau. The terrain of the Long-Liu Basin is high in the west and low in the east; the mean altitude is 2949 m. The turbulent river passes through mountains and hills; the river bed becomes narrow and the gradient of the river is steep enough to generate electricity (Gao and Song, 1984). Twelve hydropower stations have been built, or are being built, in this basin. The climate of the Long-Liu Basin is dry with scarce rainfall, but high evaporation. The average temperature is 2.3-10.5°C and the annual accumulative precipitation is 251.1-617.2 mm. The sunshine duration ranges from 2400 to 2700 hours, so there is a good coverage of vegetation (Wu et al., 1998). However, there are also severe ecological and environmental issues, such as water and soil erosion, grassland degradation and desertification. In addition, the high concentration of hydropower developments means that the fragile ecosystem is facing increasingly severe challenges.

2.2 Data sources and preprocessing

2.2.1 MODIS NDVI
The NDVI data sets used in this study are the MODIS vegetation index product data (MOD13Q1) obtained from NASA’s Earth Observing System. This data set was collected from February 2000 to December 2010 with a spatial resolution of 250 m and a temporal resolution of 16 days. The original Sinusoidal projection was transformed into the WGS84/Albers equal area conic projection using the MODIS Reprojection Tool. The resample method is the adjacent natural method. The monthly NDVI data were calculated by the maximum value composite method, which minimizes the effects of clouds, atmospheric conditions and solar altitude (Holben, 1986). The annual NDVI data sets are the average of monthly NDVI data sets.
2.2.2 Climate data sets
Climate data sets consisting of the annual accumulative precipitation and annual average temperatures from 2000 to 2010 were collected from the National Meteorological Center of China. The data were collected from 24 meteorological stations with the spatial distributions shown in Figure 1. To investigate the spatial correlation of climatic factors with vegetation coverage, the meteorological data were interpolated on site using the ordinary Kriging method and the spatial resolution is 250 m.
Figure 1 Location of the Longyangxia-Liujiaxia basin
2.2.3 Other information
Land use/land cover data in 2010 which was supplemented for result analysis was derived from HJ-1A/1B images by visual interpretation. It was obtained from Satellite Environment Center, Ministry of Environmental Protection. Its spatial resolution is 30 m. The informations about hydropower development were collected from website.

3 Methods

3.1 NDVI time series analysis

In this study, the coefficient of variation was selected to investigate the volatility characteristic of the NDVI time series. Theil-Sen median trend analysis and the Mann-Kendall test were combined to investigate the trend characteristic of the NDVI time series.
3.1.1 Coefficient of variation
The coefficient of variation (CV) is a statistical measure of the dispersion of data points in a data series around the mean. It is a useful statistic for comparing the degree of variation from one data series to another, even if the means are very different from each other. The CV is commonly used to reflect the inter-annual volatility of vegetation (Tucker et al., 1991; Milich, 2000; Mao et al., 2011). It is calculated as follows:
where xi is the annual mean NDVI in year i and 
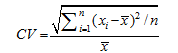
is the average annual mean NDVI from 2000 to 2010. When the CV value is large, the data are more dispersed and the inter-annual changes in vegetation are larger. When the CV value is small, the data are more compact and the vegetation is more stable.
3.1.2 Theil-Sen median trend analysis
Theil-Sen median trend analysis combined with the Mann-Kendall test can effectively identify trends in large sets of time series data and this combination has been used previously to analyze long time series data for vegetation (Milich and Weiss, 2000; Lunetta et al., 2006; Fensholt et al., 2012).
The Theil-Sen median trend analysis is a robust method of examining trends based on non-parametric statistics (Theil, 1950a, 1950b, 1950c; Sen, 1968; Hoaglin et al., 2000) and is particularly effective for the estimation of trends in small series (Hoaglin et al., 2000). This method has been adopted for the analysis of variations in vegetation and has proved to be more suitable than linear regression (Milich and Weiss, 2000; Lunetta et al., 2006; Fensholt et al., 2012). The calculation principle is to divide the time series data into n(n-1)/2 pairwise combinations first and then to calculate the slope of each data pair. The Theil-Sen median slope is then the median of all the slopes. Its computational formula is:
where ß is the Theil-Sen median slope, Median is the median of a set of data values, i and j represent the years, and NDVIi is the NDVI value of year i. If ß > 0, then the NDVI time series has an increasing trend and this means that the vegetation has been recovering in this time period. If ß < 0, then the NDVI time series has a decreasing trend and this means that the vegetation has degraded in this time period.
3.1.3 Mann-Kendall trend test
The Mann-Kendall trend test is a non-parametric statistical test method used to assess the significance of the Theil-Sen median slopes (Fuller and Wang, 2014). It has been widely applied to analyze the trends and variations in hydrological and meteorological time series and to investigate long time series for vegetation (Fensholt et al., 2012). The advantage of this method is that the samples do not need to follow a certain distribution and are free of interference from a few outliers (Kendall, 1975; Tosic, 2004). For a time series {NDVIt}, the statistic Z is defined as:
where
where NDVIi and NDVIj represent the NDVI value at times i and j, n is the length of the time series (11 years in this instance) and sgn is the symbol of sign function; the value of Z ranges from - to +. By looking up the normal distribution table, for a given significance level of 0.05, if |Z| > 1.96, the time series has a significant variation at the level of 0.05.

3.2 Correlation analysis

Correlation analysis was used to investigate the relationships between vegetation and climatic factors. In this study, we selected the partial correlation coefficient to analyze the relationships between NDVI and climatic factors. When two independent variables associate with the dependent variable at the same time, the partial correlation coefficient is used to study the correlation between one of the independent variables and the dependent variable by excluding the impact of the other independent variable (Li et al., 2013).
The Pearson correlation coefficient is defined as follows:
where rxy is the Pearson correlation coefficient of variables x and y, xi is NDVI of the year i, yi is the temperature or precipitation of the year i and is the average NDVI in the years 2000-2010. Similarly, is the average temperature or precipitation in the years 2000-2010; n = 11 in this paper.
The partial correlation coefficient then is defined as:
where rxy z is the partial correlation coefficient of variables x and y obtained by excluding the effects of variable z and rxy is the Pearson correlation coefficient of variables x and y. Similarly, rxz is the Pearson correlation coefficient of variables x and z and ryz is the Pearson correlation coefficient of variables y and z. The value of the partial correlation coefficient ranges from +1 to -1. If the value is equal to zero, there is no relationship between the variables. If the value is positive, this means that the two variables have changed. If the value is negative, then the two variables have changed in opposite directions.
To check the validity, a significance test is required. Testing for the significance of the partial correlation coefficient commonly uses the t distribution. By checking a look-up table, if |r|≥0.602, then the partial correlation coefficient is significant at a significance level of 0.05; if |r|≥0.735, then the partial correlation coefficient is highly significant at a significance level of 0.01.

4 Results

4.1 Inter-annual changes in vegetation

There are two characteristics in the inter-annual changes of vegetation, as mentioned above, they are the volatility characteristic and trend characteristic. In this study, the two characteristics were studied on both regional and pixel scales.
4.1.1 Inter-annual changes in NDVI at a regional scale
The NDVI values of the vegetation-covered area (NDVI>0.1) were averaged to investigate the inter- annual changes at a regional scale. As shown in Figure 2, the NDVI values fluctuated between 0.29 and 0.38 with an increasing trend from 2000 to 2010. However, the NDVI time series fluctuated more during the time period 2000-2005 than during 2006-2010. This means that the vegetation in the study area improved slightly from 2000 to 2010, but its inter-annual change was larger in 2000-2005 than in 2006-2010.
Figure 2 Inter-annual change in vegetation on the regional scale from 2000 to 2010
4.1.2 Inter-annual changes in NDVI on the pixel scale
(1) Volatility analysis
Based on the results of the CV analysis, the geometrical interval classification method was used to divide the volatility of the vegetation into five levels (Table 1). The areas with the lowest fluctuation in vegetation (CV = 0.015-0.095) account for 19.90% of the total area of vegetation. The areas where CV ranges from 0.095 to 0.109 account for 20.63% of the area and the moderate fluctuation areas, where CV ranges from 0.109 to 0.189, account for 53.86%. The higher fluctuation zones in which CV ranges from 0.189 to 0.650 account for 4.08% and the highest fluctuation zones (CV=0.650-3.317) account for the smallest area of vegetation (1.53%). Therefore the vegetation volatility of the Long-Liu Basin is stable overall, but fluctuates in local areas.
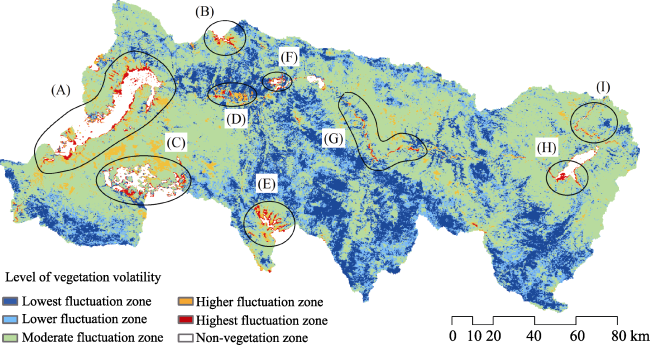
Table 1 Classification of coefficient of variation and corresponding proportions of area in the Long-Liu Basin
CV Volatility level Area (%)
0.015-0.095 Lowest fluctuation 19.90
0.095-0.109 Lower fluctuation 20.63
0.109-0.189 Moderate fluctuation 53.86
0.189-0.650 Higher fluctuation 4.08
0.650-3.317 Highest fluctuation 1.53
Combined with the spatial distribution of the volatility level (Figure 3), we can see that, although the highest fluctuation zone accounts for only 1.53% of the total area of vegetation, its spatial distribution has an obvious pattern. The highest fluctuation zone is mainly distrib-uted around the reservoirs and the reaches of the river with hydropower development, such as the Longyangxia Reservoir (zone A), the reach between the Laxiwa hydropower station and the Nina hydropower station (zone D), the reach from the Kangyang hydropower station to the Huangfeng hydropower station (zone G), the end of the Liujiaxia Reservoir’s backwater area (zone H) and downstream of the Liujiaxia Reservoir (zone I). However, this highest fluctuation zone is also distributed in areas of desert and bare rock, such as the north of Guide County (zone B), the central Guinan County (zone C), the north shore of the river between the Shanpeng hydropower station and the Lijiaxia Reservoir (zone F), and the south of Guide County (zone E).
Figure 3 Spatial distribution of level of vegetation volatility in the Long-Liu Basin
(2) Trend analysis
According to the results of the Theil-Sen median slope analysis and the Mann-Kendall test, the trend was divided into four levels (Table 2). Vegetation with SNDVI < 0 and Z values less than -1.96 has a significantly decreasing trend and accounts for 1.89% of the area covered by vegetation. Vegetation with SNDVI < 0, but with Z values ranging from -1.96 to 1.96 has an insignificant decreasing trend and accounts for 17.15% of the area covered by vegetation. Vegetation with SNDVI > 0 and Z > 1.96 has a significantly increasing trend and accounts for the largest part of the study area (44.06%). Vegetation with SNDVI > 0 but Z values ranging from -1.96 to 1.96 has an insignificant increasing trend and account for 36.90% of the area covered by vegetation. Therefore the vegetation in the Long-Liu Basin has increased overall, but a few regions have a significantly decreasing trend.
Table 2 Classification of Theil-Sen median slope analysis and Mann-Kendall test and corresponding area proportions in the Long-Liu Basin
SNDVI Z Trend level Area (%)
<0 < -1.96 Significant decreasing 1.89
<0 -1.96 to 1.96 Insignificant decreasing 17.15
≥0 -1.96 to 1.96 Insignificant increasing 36.90
≥0 ≥1.96 Significant increasing 44.06
As shown in Figure 4, the zones with significantly decreasing vegetation cover are mainly distributed along the reservoirs and reaches with hydropower stations close by, such as the Longyangxia Reservoir (zone A), the reach between the Laxiwa hydropower station and the Nina hydropower station (zone D), the reach from the Kangyang hydropower station to the Huangfeng hydropower station (zone J), and the end of Liujiaxia Reservoir’s backwater area (zone M). In addition, the zones with significantly decreasing vegetation cover are also distributed in farmland (zone B), forest land (zones E and G), grassland (zones C and K), wetland (zone H), built-up area (zones F and N) and bare land (zones I and L). However, these areas are scattered over the study area and do not have any common characteristics in their spatial distribution.
Figure 4 Spatial distribution of trend in vegetation levels in the Long-Liu Basin
(3) Comprehensive analysis
Based on the volatility and trend analyses, the significant trends, including the significantly increasing trends (SNDVI > 0 and Z > 1.96) and significantly decreasing trends (SNDVI < 0 and Z<-1.96), should be studied further. To reduce any unnecessary information, the volatility was reclassified into two levels by merging the lowest, lower and moderate fluctuation levels into a relatively stable level (0.015 < CV < 0.189) and merging the higher and highest fluctuation levels into a highly fluctuating level (0.189≤CV<3.317). As shown in Table 3, there are now five types of variation in vegetation: relatively stable and significantly decreasing (95%); highly fluctuating and significantly decreasing (63%); relatively stable and significantly increasing (42.14%); highly fluctuating and significantly increasing (1.76%); and vegetation with an insignificant trend (54.53%).
Table 3 Classification of coefficient of variation, Theil-Sen median slope analysis, the Mann-Kendall test and the corresponding area proportions in the Long-Liu bain
CV SNDVI Z Variation type Area (%)
0.015 to 0.189 <0 < -1.96 Relatively stable and significantly decreasing 0.95
0.189 to 3.317 <0 < -1.96 Highly fluctuating and significantly decreasing 0.63
0.015 to 0.189 >0 >1.96 Relatively stable and significantly increasing 42.14
0.189 to 3.317 >0 >1.96 Highly fluctuating and significantly increasing 1.76
- - -1.96 to 1.96 Insignificant trend 54.52
Figure 5 shows that the regions which are highly fluctuating and with a significantly decreasing trend (red zone) are mostly distributed around the reservoirs and the reaches with hydropower developments. The vegetation in these regions has large inter-annual differences and has been obviously degrading. The regions with a relatively stable, but significantly decreasing trend (orange zone) are dispersed on built land, grassland, forest land, wetland and bare land. Vegetation in these regions has small inter-annual differences, but has been obviously degrading. The spatial distribution of regions with relatively stable and significantly increasing trends in vegetation (green zone) have a high correlation with altitude, which ranges from about 2000 to 3000 m. Vegetation in these areas has small inter-annual differences and have been obviously improving. Regions with high fluctuations and a significantly increasing trend (blue zone) are areas with farmland partly returning to grassland areas. Vegetation in these areas has large inter-annual changes and has been significantly improving.
Figure 5 Spatial distribution of vegetation variation types in the Long-Liu bain

4.2 Correlation of changes in vegetation with climate change

Precipitation and temperature are the most important climatic factors related to the vegetation variation. First, we analyzed their influences separately. And then, we combined their influences to find the key factor.
4.2.1 Partial correlation of NDVI with precipitation
As shown in Table 4, the partial correlation coefficient of NDVI with precipitation is generally positive, although only small areas have a significant correlation. The highly significant and positive correlation areas account for 3.98% of the total and the significant and positive correlation areas account for 8.36%. The highly significant and negative correlation areas account for 0.78% and the significant and negative correlation areas account for 2.13%. The partial correlations of NDVI with precipitation are insignificant in most regions (84.75%).
Table 4 Classification of correlation of NDVI with precipitation and corresponding area proportion in the Long-Liu Basin
rp Correlation level Area (%)
-0.99 to -0.735 Highly significant and negative correlation** 0.78
-0.735 to -0.602 Significant and negative correlation* 2.13
-0.602 to 0 Insignificant and negative correlation 30.64
0 to 0.602 Insignificant and positive correlation 54.11
0.602 to 0.735 Significant and positive correlation* 8.36
0.735 to 0.99 Highly significant and positive correlation** 3.98

Note: rp is the partial correlation coefficient of NDVI with precipitation.* Correlation coefficient is significant at a level of 0.05. ** Correlation coefficient is significant at a level of 0.01.

As shown in Figure 6, the partial correlation coefficient of NDVI with precipitation is spatially heterogeneous. The negative correlation zone with significance levels of 0.05 and 0.01 are mainly concentrated in: (1) valley areas on the plain, where construction land and farmland are the main land use types and where the intensity of human activity is high; and (2) alpine regions where the altitude is relatively high and the main land cover type is forest. The NDVI values of these regions decrease with the increase of precipitation. The zone with a significant positive correlation (significance levels 0.05 and 0.01) is mainly concentrated in grassland. The NDVI of these regions increases with increasing amounts of precipitation. Because the natural vegetation in these areas is not influenced by human activity, precipitation is the main driving factor in the growth of vegetation.
Figure 6 Spatial distribution of the correlation levels of NDVI with precipitation in the Long-Liu Basin
4.2.2 Partial correlation of NDVI with temperature
As shown in Table 5, the partial correlation coefficient of NDVI with temperature was generally positive. The areas of highly significant and positive correlation account for 5.92% of the total area and the significant and positive correlation areas account for 10.9%. The highly significant and negative correlation areas account for 0.16% and the significant and negative correlation areas account for 0.71%. The partial correlations of NDVI with temperature are insignificant in most regions.
Table 5 Classification of correlation of NDVI with temperature and corresponding area proportion in the Long-Liu Basin
rt Correlation level Area (%)
-0.99 to -0.735 Highly significant and negative correlation** 0.16
-0.735 to -0.602 Significant and negative correlation* 0.71
-0.602 to 0 Insignificant and negative correlation 21.75
0 to 0.602 Insignificant and positive correlation 60.56
0.602 to 0.735 Significant and positive correlation* 10.9
0.735 to 0.99 Highly significant and positive correlation** 5.92

Note: rt represents the partial correlation coefficient of NDVI with temperature.* Correlation coefficient is significant at a level of 0.05.** Correlation coefficient is significant at a level of 0.01.

Figure 7 shows that the partial correlation coefficient of NDVI with temperature is spatially heterogeneous. The negative correlation zone at significance levels of 0.05 and 0.01 is mainly concentrated in farmland or bare land downstream of the Liujiaxia Reservoir. The NDVI values of these regions decrease with increasing temperature. The significantly positive correlation zone at significance levels of 0.05 and 0.01 is mainly concentrated in grassland in the center of the study area. The NDVI values of these regions increase with increasing temperature. The temperature is the main influence on the growth of vegetation.
4.2.3 Comprehensive analysis
In combination of the results of the partial correlation of NDVI with precipitation and temperature (Table 6 and Figure 8), it can be seen that the regions with a significant correlation of NDVI with precipitation account for 8.96% and regions with a significant correlation of NDVI with temperature account for 11.21% of the total area. Regions with a significant correlation of NDVI with both precipitation and temperature account for 4.25% of the area. Vegetation in the remaining areas does not have a significant correlation with either precipitation or temperature - that is, the inter-annual change of vegetation in these areas cannot be explained by climatic factors.
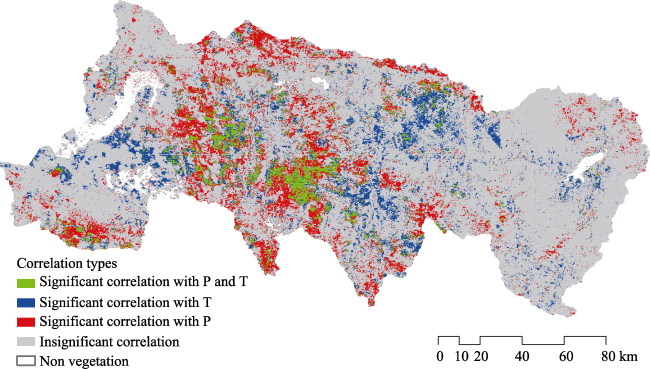
Table 6 Classification of correlation of NDVI with precipitation and temperature and corresponding area proportions in the Long-Liu Basin
R Correlation type Area (%)
|rp|≥0.602 Significant correlation of NDVI with precipitation* 8.96
|rt|≥0.602 Significant correlation of NDVI with temperature* 11.21
|rp|≥0.602 and |rt|≥0.602 Significant correlation of NDVI with precipitation and temperature* 4.25
|rp|≤0.602 or |rt|≤0.602 Insignificant correlation 75.59

Note: rp represents the partial correlation of NDVI with precipitation; rt represents the partial correlation of NDVI with temperature.*The correlation coefficient is significant at a level of 0.05.

By calculating the percentage of each correlation type in each variation type (Figure 9), it can be seen that 76.16% of the vegetation with a relatively stable and significantly decreasing trend has an insignificant correlation with climatic factors. Other factors, such as human activity, are the key factors affecting the inter-annual change in vegetation in these areas. Of the 23.84% of vegetation that has a significant correlation with climatic factors, the regions in which precipitation is the key factor account for 11.46% of the total area, the regions in which temperature is the key factor account for 9.6% the total area, and the regions in which both precipitation and temperature have an influence account for 2.79%. Similarly, 76.87% of the vegetation with a highly fluctuating and significant decreasing trend has an insignificant correlation with climatic factors. Of the 23.23% of these areas that have a significant correlation with climatic factors, precipitation is the key factor accounting for 11.73%, temperature is the key factor accounting for 8.07%, and both precipitation and temperature account for 3.33% of the total area. A total of 74.53% of the area of vegetation with a relatively stable and significantly increasing trend has an insignificant correlation with climatic factors. The remaining area (25.47%) has a significant correlation with climatic factors, among which precipitation is the key factor accounting for 12.51%, temperature is the key factor accounting for 7.71% and both temperature and precipitation are key factors accounting for 5.24%. In the same way, 71.27% of the vegetation areas with a highly fluctuating and significantly increasing trend have an insignificant correlation with climatic factors. Therefore 28.73% of the vegetation areas have a significant correlation with climatic factors, among which precipitation as the key factor accounts for 18.14%, temperature as the key factor accounts for 5.4% and both temperature and precipitation are key factors accounting for 5.19% of the total area.
Figure 7 Spatial distribution of the correlation levels of NDVI with temperature in the Long-Liu Basin
Figure 8 Spatial distribution of the correlation types in the Long-Liu Basin Note: P = precipitation; T = temperature

5 Discussion and conclusions

The NDVI time series data based on MOD13Q1 data at a resolution of 250 m were collected from 2000 to 2010. The variation of coefficient, the Theil-Sen median trend analysis and the Mann-Kendall test were combined to investigate the volatility characteristic and trend characteristic of the vegetation. Climate data sets were then added to analyze the correlation of variations in vegetation with climate change. The main conclusions are as follows.
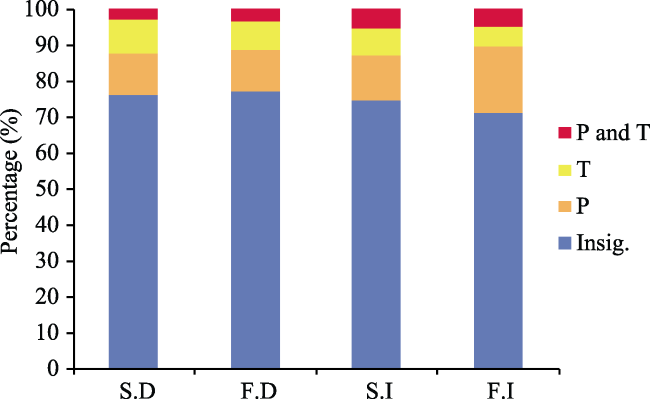
Figure 9 Proportion of correlation types in variation types in the Long-Liu Basin. Note: SD = vegetation with relatively stable and significantly decreasing trend; FD = vegetation with a highly fluctuating and significant decreasing trend; SI = vegetation with relatively stable and significantly increasing trend; FI = vegetation with highly fluctuating and significant increasing trend; P = precipitation; T=temperature; Insig. = insignificant correlation
(1) The NDVI time series data sources are easily accessed and commonly used to study inter-annual changes in vegetation. Methods combining the coefficient of variation, the Theil-Sen median trend analysis and the Mann-Kendall test are an effective way to investigate the characteristics of variations in vegetation. Volatility and significant trends can be recognized on both regional and pixel scales. By adding climate data, the response of vegetation to climate change can be understood by using correlation analysis.
(2) In terms of temporal variation, vegetation in this study area improved slightly from 2000 to 2010. The volatility is larger in the time period 2000-2005 than in 2006-2010. In terms of spatial variation, vegetation with a highly fluctuating and significantly decreasing trend is mostly distributed around the reservoirs and in the reaches of the river with hydropower developments. Vegetation with a relatively stable and significantly decreasing trend is more dispersed. Vegetation with a relatively stable and significantly increasing trend has a high correlation with altitude, which ranges from about 2000 to 3000 m. Vegetation with a high fluctuation and significantly increasing trend is in area partly converting from farmland to grassland.
(3) With respect to the response of vegetation to climate change, about 20-30% of the vegetation has a significant correlation with climatic factors. Regions with precipitation as the key factor account for more than 10% of the total area; regions with temperature as the key factor account for less than 10%; and regions with precipitation and temperature both influencing the changes in vegetation account for about 5% of the total area. More than 70% of the vegetation has an insignificant correlation with climatic factors. The areas with positive correlation are larger than those with a negative correlation.
Methods used in this study are easy to be applied in other study areas. Meanwhile, these methods are reasonable and suitable to investigate the vegetation variation. The variation of coefficient has been widely used to measure the degree of fluctuation (Tucker et al., 1991) and reflects the inter-annual volatility of vegetation (Tucker et al., 1991; Milich, 2000; Mao et al., 2011). The Theil-Sen trend analysis and Mann-Kendall test method are combined to be more robust in exploring significant trends in changes in vegetation (Pouliot et al., 2009; Fensholt et al., 2012; Hou et al., 2012; Wang et al., 2013; Fuller and Wang, 2014).
Results obtained from this study are consistent with previous studies in all but different in detail (Hao et al., 2012). Furthermore, this study spatialized the relationship between vegetation variation and climate change.
However, there are some deficiencies in this study. For example, more than 70% of the vegetation has an insignificant correlation with climatic factors and these other factors should be investigated in future studies. For example, the Long-Liu Basin has a high concentration of hydropower development. In the process of hydropower construction, the river is intercepted by obstacles for the building of the dams. After the completion of the dams, the water level fluctuates in the reservoirs and in the reaches with hydropower development, as a result of the regulation of runoff by the dams. Therefore the vegetation in the zones with a fluctuating water level will have large differences in the composition and diversity of species (Lu et al., 2010) and will show a generally decreasing trend, but will still possess a capacity for restoration (Quinn et al., 2005; Li W P et al., 2011). These regions should be investigated further.

The authors have declared that no competing interests exist.

1
Baret F, Guyot G, 1991. Potentials and limits of vegetation indices for LAI and APAR assessment.Remote Sensing of Environment, 35: 161-173.

2
Chuai X W, Huang X J, Wang W Jet al., 2013. NDVI, temperature and precipitation changes and their relationships with different vegetation types during 1998-2007 in Inner Mongolia, China. International Journal of Climatology, 33: 1696-1706.

3
Fan N, Xie G D, Zhang C Set al., 2012. Spatial-temporal dynamic changes of vegetation cover in Lancang river basin during 2001-2010.Resource Science, 34: 1222-1231. (in Chinese)

4
Fensholt R, Langanke T, Rusmussen Ket al., 2012. Greenness in semi-arid areas across the globe 1981-2007: An Earth observing satellite based analysis of trends and drivers.Remote Sensing of Environment, 121: 144-158.

5
Fuller D O, Wang Y, 2014. Recent trends in satellite vegetation index observations indicate decreasing vegetation biomass in the southeastern saline everglades wetlands.Wetlands, 34: 67-77.

6
Gao Z X, Song Z S, 1984. Hydrographic profiles of the upper catchments of the Yellow River.Journal of China Hydrology, 3: 55-58. (in Chinese)

7
Gutman G, Ignatov A, 1998. The derivation of the green vegetation fraction from NOAA/AVHRR data for use in numerical weather prediction models.International Journal of Remote Sensing, 19: 1533-1543.

8
Hao F H, Zhang X, Ouyang Wet al., 2012. Vegetation NDVI linked to temperature and precipitation in the upper catchments of the Yellow River. Environmental Modeling and Assessment 17: 389-398.

9
Hoaglin D C, Mosteller F, Tukey J W, 2000. Understanding Robust and Exploratory Data Analysis. New York: Wiley.

10
Holben B N, 1986. Characteristics of maximum-value composite images from temporal AVHRR data.International Journal of Remote Sensing, 7: 1471-1434.

11
Hou X Y, Wu T, Yu L Jet al., 2012. Characteristics of multi-temporal scale variation of vegetation coverage in the Circum Bohai Bay Region, 1999-2009.Acta Ecologica Sinica, 32: 297-304.

12
Jiang W G, Hou P, Zhu X Het al., 2011. Analysis of vegetation response to rainfall with satellite images in Dongting Lake. Journal of Geographical Sciences, 21: 135-149.

13
Kawabata A, Ichii K, Yamaguchi Y, 2001. Global monitoring of interannual changes in vegetation activities using NDVI and its relationships to temperature and precipitation.International Journal of Remote Sensing, 22: 1377-1392.

14
Kendall M, 1975. Rank Correlation Methods. London: Charles Griffin.

15
Li F, Zeng Y, Li X Set al., 2014. Remote sensing based monitoring of interannual variations in vegetation activity in China from 1982 to 2009.Science China Earth Sciences, 57: 1-7.

16
Li H X, Liu G H, Fu B J, 2011. Response of vegetation to climate change and human activity based on NDVI in the Tree-River Headwaters region.Acta Ecologica Sinica, 31: 5495-5504. (in Chinese)

17
Li J G, Pu L J, Liu J Pet al., 2012. The temporal and spatial characteristics of vegetation activity in Three Gorges Reservoir area (Chongqing) from 2001 to 2010 and its influencing factors.Resources Science, 34: 1500-1507. (in Chinese)

18
Li S S, Yan J P, Liu X Yet al., 2013. Response of vegetation restoration to climate change and human activities in Shaanxi-Gansu-Ningxia region.Journal of Geographical Sciences, 23: 98-112.

19
Li W P, Zeng Y, Wu B Fet al., 2011. Research and monitoring of vegetation recovery based on remote sensing in the drawdown area of the Three Gorges Bain.Resources and Environment in the Yangtze Basin, 20: 332-338. (in Chinese)

20
Lu Z J, Li L F, Huang H Det al., 2010. Preliminary effects of impounding on vegetation in drawdown zone of the Three Gorges Reservoir Region. Journal of Wuhan Botanical Research, 28(3): 303-314. (in Chinese)

21
Lunetta R S, Knight J F, Ediriwickrema J, 2006. Land-cover change detection using multi-temporal MODIS NDVI data.Remote Sensing of Environment, 105: 142-154.

22
Ma M G, Wang J, Wang X M, 2006. Advances in the inter-annual variability of vegetation and its relation to climate based on remote sensing.Journal of Remote Sensing, 10: 421-431. (in Chinese)

23
Mao D H, Wang Z M, Song K Set al., 2011. The vegetation NDVI variation and its responses to climate change and LUCC from 1982 to 2006 year in northeast permafrost region.China Environmental Science, 32: 283-292. (in Chinese)

24
Milich L, Weiss E, 2000. GAC NDVI interannual coefficient of variation (cov) images: Ground truth sampling of the Sahel along north-south transects.International Journal of Remote Sensing, 21: 235-260.

25
Mu S J, Yang H F, Li J Let al., 2013. Spatio-temporal dynamics of vegetation coverage and its relationship with climate factors in Inner Mongolia, China.Journal of Geographical Sciences, 23: 231-246.

26
Neeti N, Eastman J R, 2011. A contextual Mann-Kendall approach for the assessment of trend significance in image time series.Transactions in GIS, 15: 599-611.

27
Nie Q, Xu J H, Cao Let al., 2012. The vegetation coverage dynamic coupling with climatic factors in northeast China transect.Environmental Management, 50: 405-417.

28
Piao S L, Fang J Y, 2001. Dynamic vegetation cover change over the last 18 years in China.Quaternary Sciences, 21: 194-302. (in Chinese)

29
Pouliot D, Latifovic R, Olthof I, 2009. Trends in vegetation NDVI from 1 km AVHRR data over Canada for the period 1985-2006.International Journal of Remote Sensing, 30: 149-168.

30
Quinn C H, Ndangalasi H J, Gerstle Jet al., 2005. Effect of the Lower Kihansi Hydropower Project and post-project mitigation measures on wetland vegetation in Kihansi Gorge, Tanzania.Biodiversity and Conservation, 14: 297-308.

31
Santin-Janin H, Garel M, Chapuis J -Let al., 2009. Assessing the performance of NDVI as a proxy for plant biomass using non-linear models: A case study on the Kerguelen archipelago.Polar Biology, 32: 861-871.

32
Sen P K.1968. Estimates of the regression coefficient based on Kendall's tau.Journal of the American Statistical Association, 63:1379-1389.

33
Song F Q, Xing K X, Liu Yet al., 2011. Monitoring and assessment of vegetation variation in Northern Shaanxi based on MODIS/NDVI.Acta Ecologica Sinica, 31: 354-363. (in Chinese)

34
Sun H Y, Wang C J, Niu Zet al., 1988. Analysis of vegetation cover change and the relationship between NDVI and environmental factors by using NOAA time series data. Journal of Remote Sensing, 2: 204-210. (in Chinese)

35
Theil H, 1950a. A rank-invariant method of linear and polynomial regression analysis: I.Proceedings of Koninklijke Nederlandse Akademie van Wetenschappen, 53: 386-392.

36
Theil H, 1950b. A rank-invariant method of linear and polynomial regression analysis: II.Proceedings of Koninklijke Nederlandse Akademie van Wetenschappen, 53: 521-525.

37
Theil H, 1950c. A rank-invariant method of linear and polynomial regression analysis: III.Proceedings of Koninklijke Nederlandse Akademie van Wetenschappen, 53: 1397-1412.

38
Tosic I, 2004. Spatial and temporal variability of winter and summer precipitation over Serbia and Montenegro.Theoretical and Applied Climatology, 77: 47-56.

39
Tucker C J, Justice C O, Prince S D, 1986. Monitoring the grasslands of the Sahel 1984-1985.International Journal of Remote Sensing, 7: 1571-1581.

40
Tucker C J, Newcomb W W, Los S Oet al., 1991. Mean and inter-year variation of growing seasons normalized difference vegetation index for the Sahel 1981-1989.International Journal of Remote Sensing, 12: 1133-1135.

41
Wang F, Wang X, Zhao Yet al., 2013. Temporal variations of NDVI and correlations between NDVI and hydro-climatological variables at Lake Baiyangdian, China.International Journal of Biometeorology, doi: 10.1007/s00484-013-0758-4.

42
Wu S H, Zhou S L, Chen D Xet al., 2014. Determining the contribution of urbanization and climate change to NPP variations over the last decade in the Yangtze River Delta, China.Science of the Total Environment, 472: 397-406.

43
Wu Z Y, Ren D C, Zhang R Y, 1998. Chronicles of the Yellow River. Zhengzhou: Henan People’s Publishing House, 100-106. (in Chinese)

44
Xu D Y, Li C L, Zhuang D Fet al., 2011. Assessment of the relative role of climate change and human activities in desertification: A review.Journal of Geographical Sciences, 21: 926-936.

45
Yang Y, Xu J H, Hong Y Let al., 2012. The dynamic of vegetation coverage and its response to climate factors in Inner Mongolia, China.Stochastic Environmental Research and Risk Assessment, 26: 357-373.

46
Yin F, Deng X Z, Jin Qet al., 2014. The impacts of climate change and human activities on grassland productivity in Qinghai Province, China.Frontiers in Earth Science, 8: 93-103.

47
Yuan L H, Jiang W G, Shen W Met al., 2013. The spatio-temporal variations of vegetation cover in the Yellow River Basin from 2000 to 2010.Acta Ecologica Sinica, 33: 7798-7806. (in Chinese)

48
Zhang X Y, Tan B, Yu Y Y, 2014. Interannual variations and trends in global land surface phenology derived from enhanced vegetation index during 1982-2010.International Journal of Biometeorology, 58: 547-564.

49
Zhang Y C, Zhao Z Q, Li S Cet al., 2008. Indicating variation of surface vegetation cover using SPOT NDVI in the northern part of North China.Geographical Research, 27: 745-754. (in Chinese)

50
Zhang Y D, Xu Y T, Gu F Xet al., 2003. Correlation analysis of NDVI with climate and hydrological factors in oasis and desert.Acta Phytoecologica Sinica, 27: 816-821. (in Chinese)

51
Zhong L, Ma Y M, Salama M Set al., 2010. Assessment of vegetation dynamics and their response to variations in precipitation and temperature in the Tibetan Plateau.Climatic Change, 103: 519-535.

Outlines

/